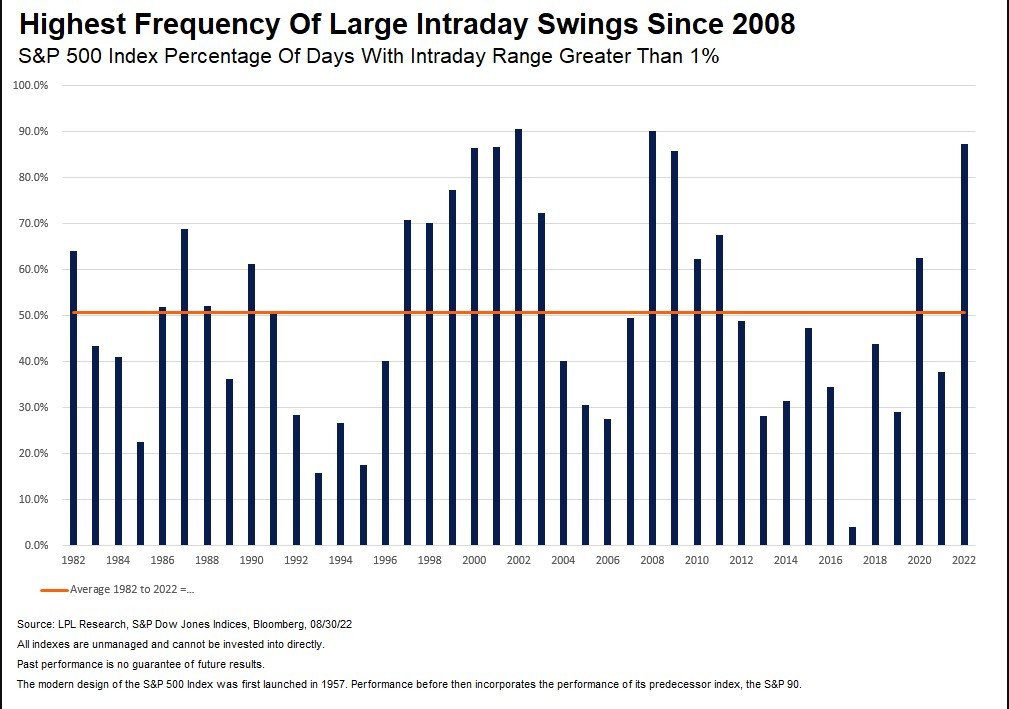
- 2022 has been the most volatile year in the S&P 500 since 2008.
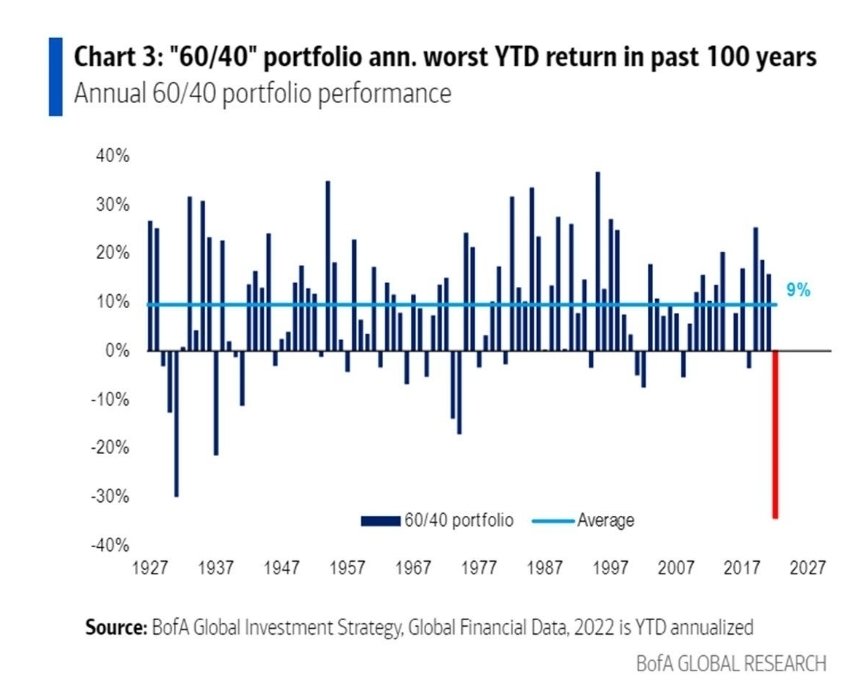
- The traditional 60/40 portfolio, of 60% stocks and 40% bonds, has suffered its worst YTD return in the past 100 years.
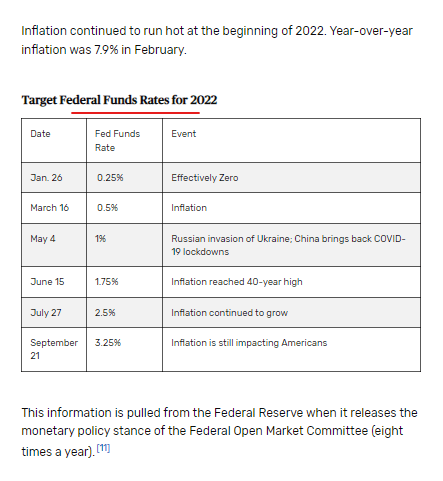
- The markets have also seen 40-year high inflation readings and the fastest Federal Reserve Open Market Committee (FOMC) “Fed” rate hiking campaign in 40-years as well.
- VIEW THE YOUTUBE VIDEO HERE: https://youtu.be/7QrQYgflQUY
2022 has been the most volatile year in the S&P 500 since 2008.
The traditional 60/40 portfolio, of 60% stocks and 40% bonds, has suffered its worst YTD return in the past 100 years.
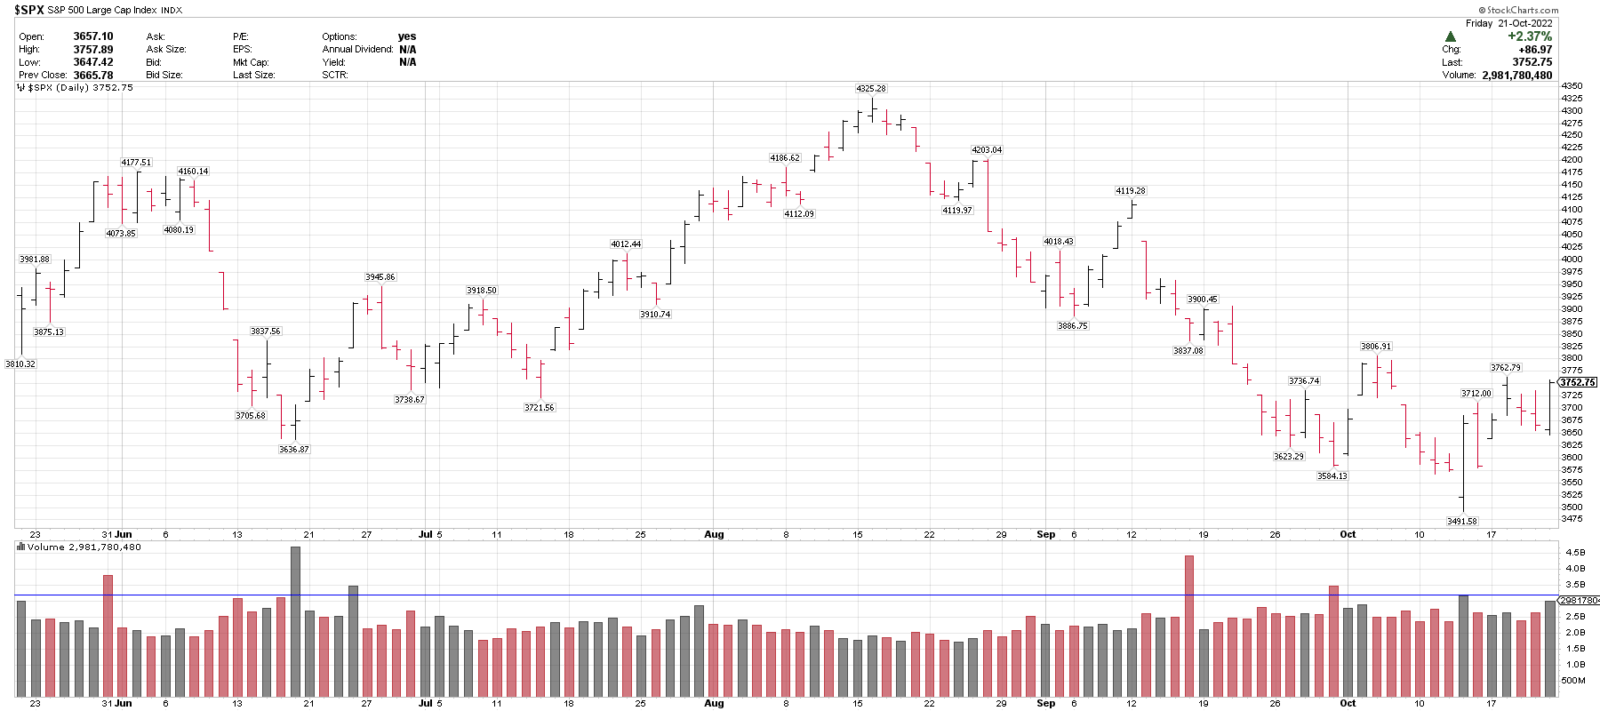
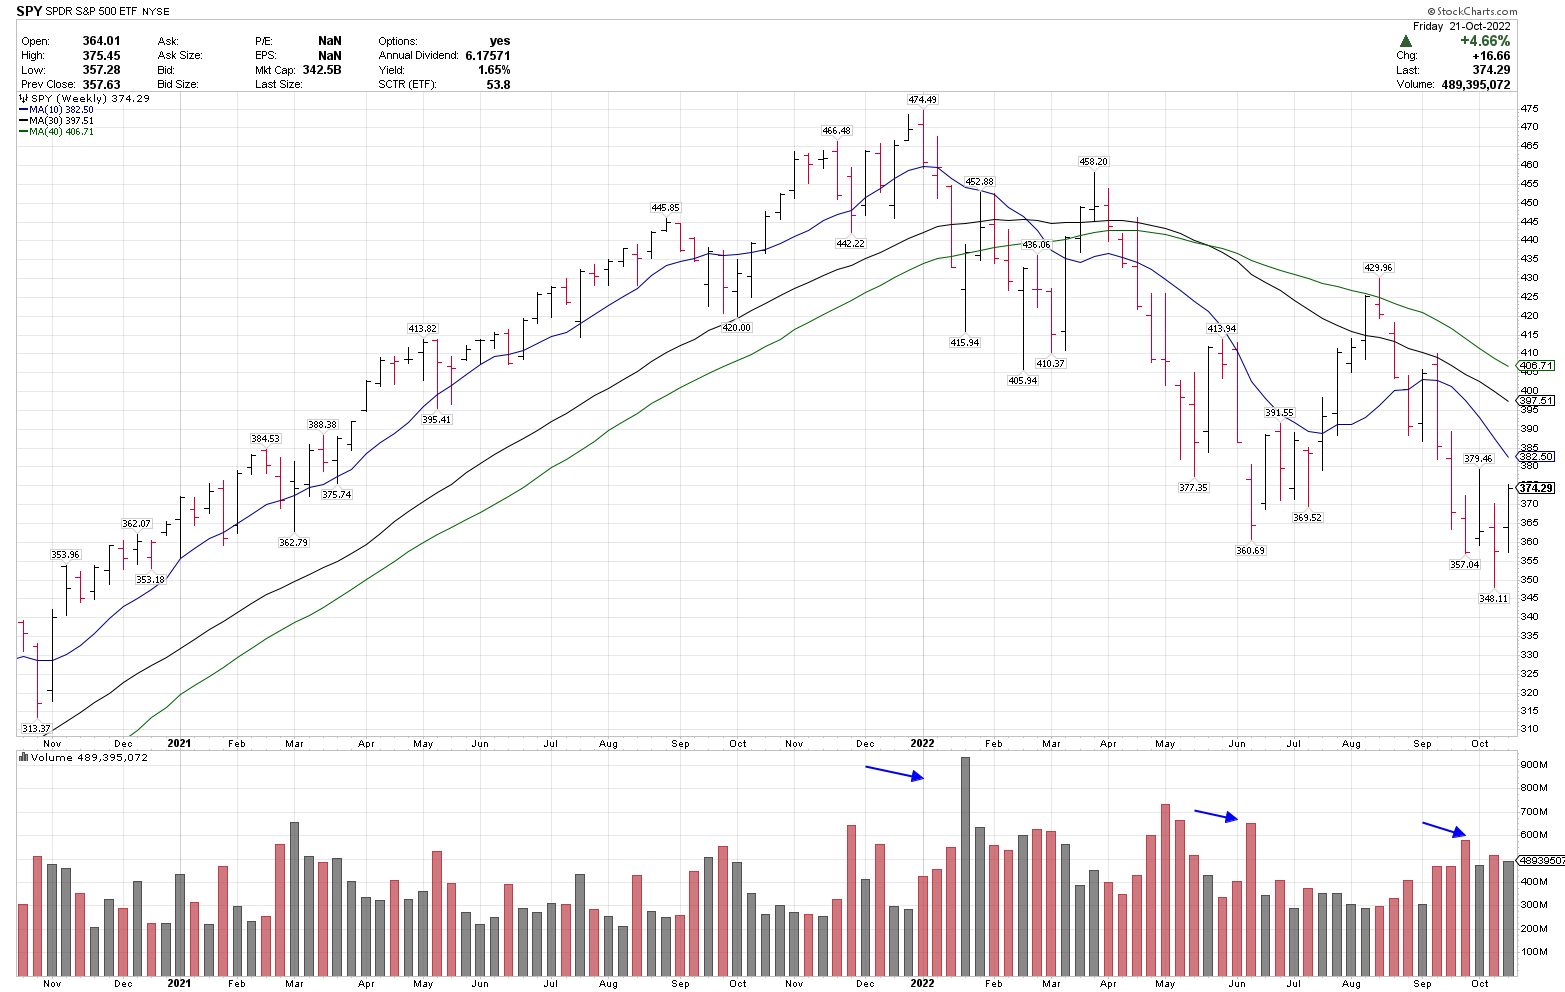
- The S&P 500 index (SPX) had a very high-volume reversal day on October 13, after the September CPI data was reported.
- The major question on investors and traders’ minds currently is if the recent market reversal is a Bear Market Rally or if the final lows are in the market.
- My view is that the October 13 low is at least a tradable (near-term) low, which could develop into more. A close below 3500 in (SPX) could negate this view. More details below.
- I am not saying that the final lows aren’t in, they very well could be. I haven’t seen all of the signs that I look for, yet. I stay open minded to all outcomes.
- There are quite a few factors that could increase the chances of the final lows being in. I will cover them near the end of this report.
- Nothing in this report is a prediction or market call. Each market is unique. Markets can put in a low at any time
- I started actively trading and investing in 1998 and have been experienced 3 technical Bear markets before the 2022 Bear Market – 2000-2002, 2007-2009, and 2020.
- Also, a sharp drawdown in 2018 that we will look at.
- In this blog and video, I am going to share my views of what prior Bear Markets had in common at their final lows, where I think that we are in this cycle and 5 best ideas to trade and invest in today’s market.
- I am not going to make any comparison to prior Bear markets with regard to duration or drawdown percentage.
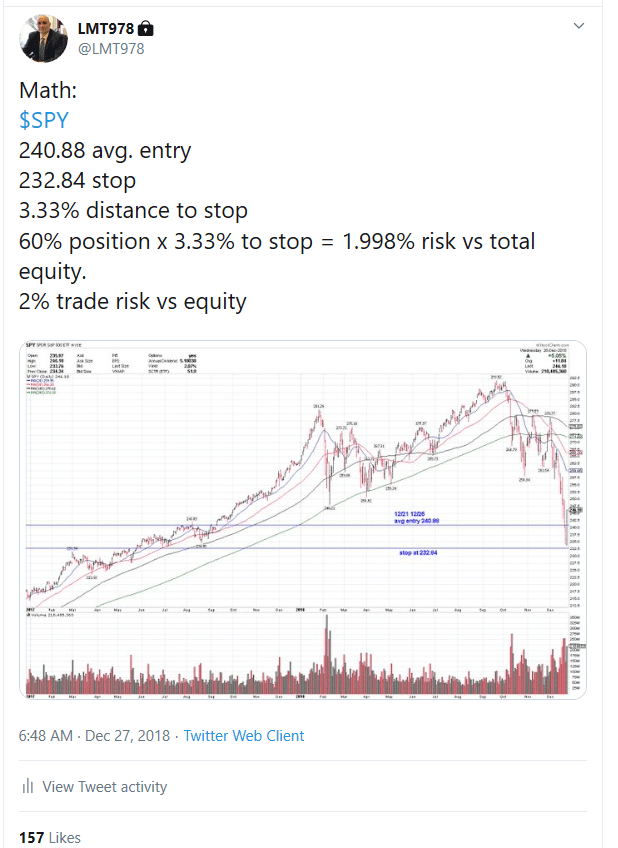
I did go all-in at the 2018 (SPX) low on 12/26/18, when I saw all 5 of my 5 key “market-bottom” signals.
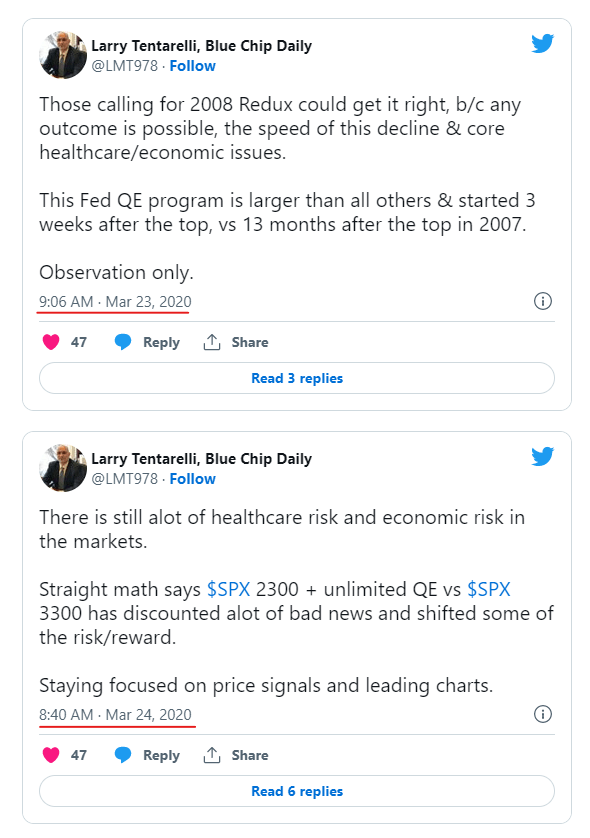
My 2020 views, at the bottom on 3/23.
Start a 30-day free trial to Blue Chip Daily here: Blue Chip Daily Trend Report
5 key factors that I have observed in prior final Bear Market lows:
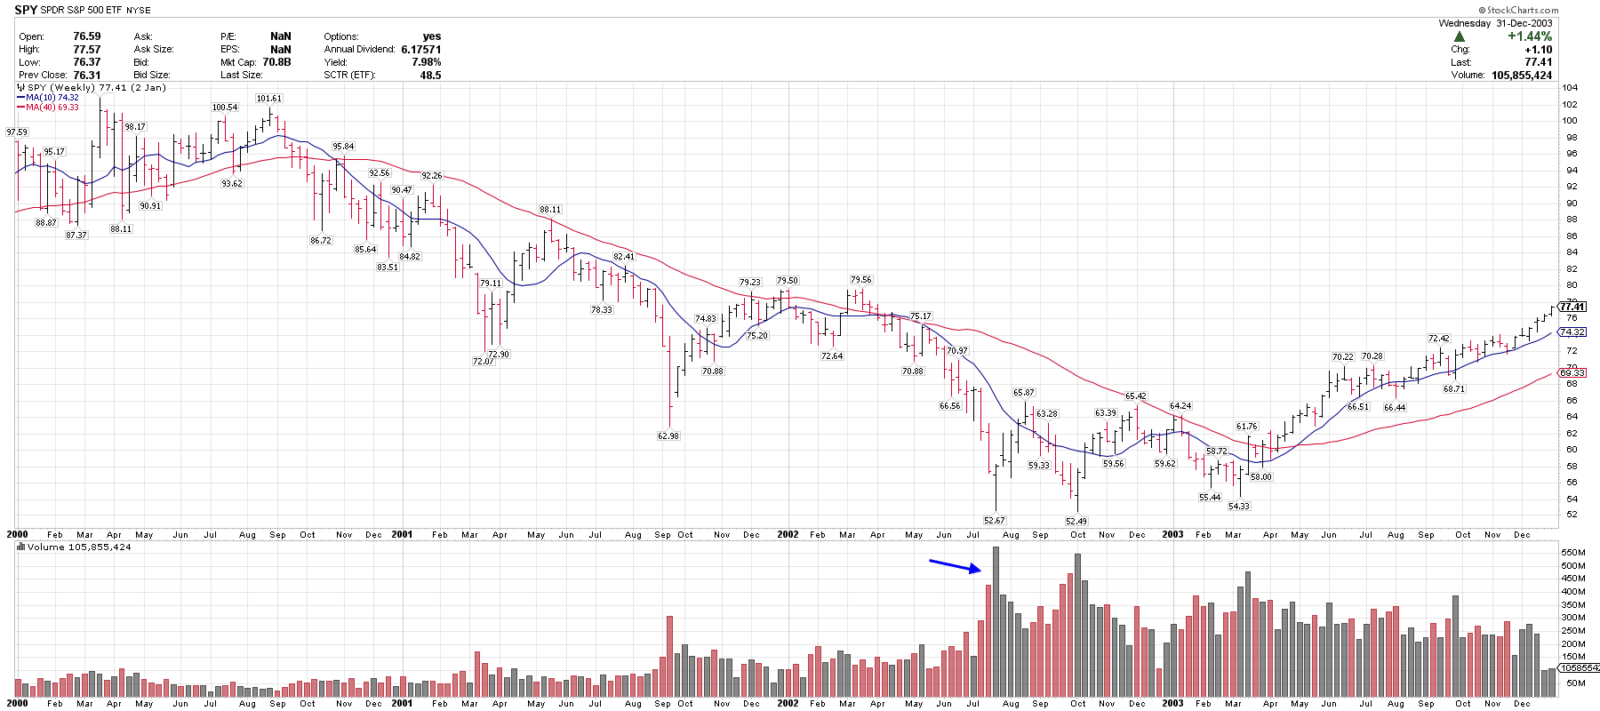
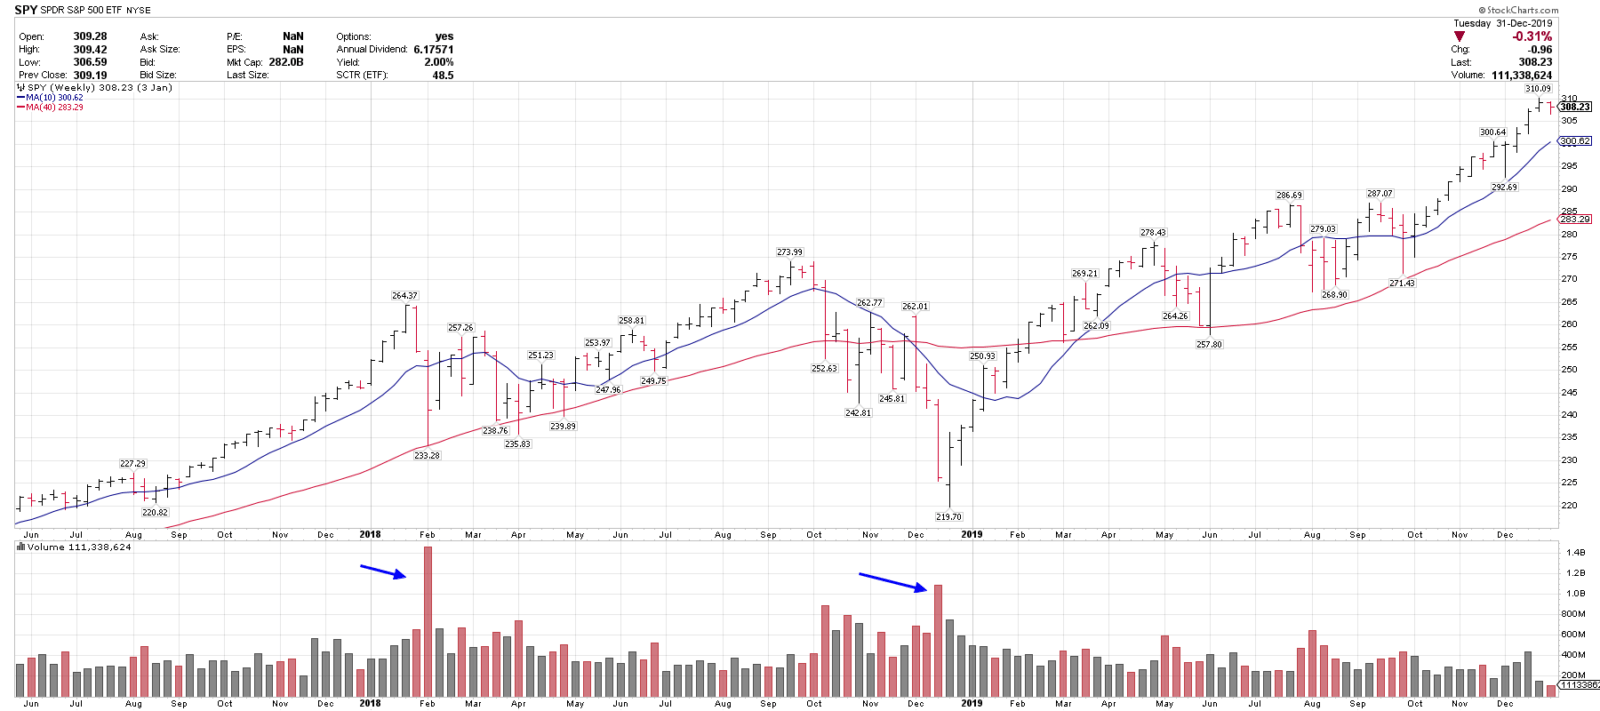
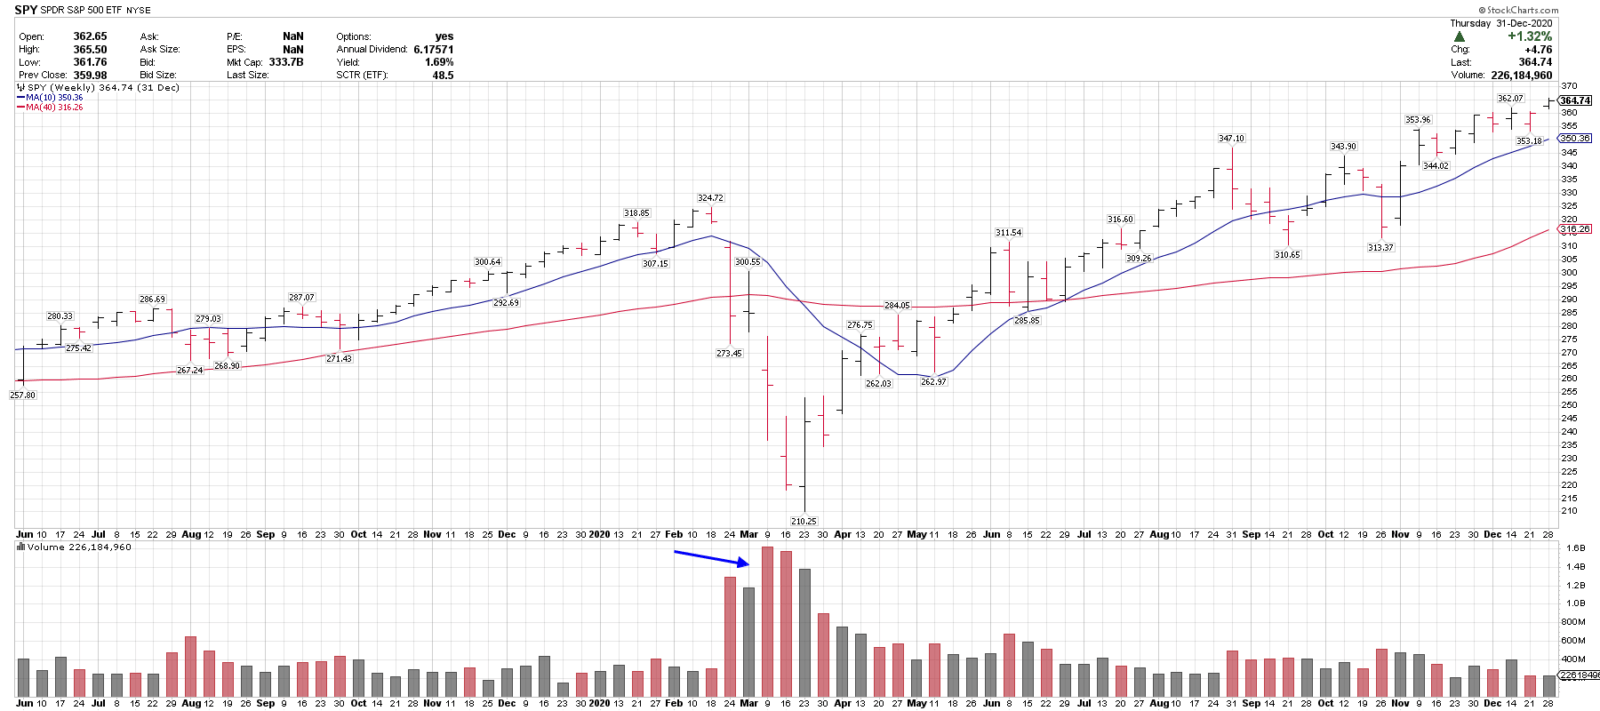
1. A very high-volume selling flush and reversal.
2. A sharp spike and reversal in volatility. (VIX)
3. Extremely oversold oscillator readings.
4. Extreme pessimism and low investor exposure.
5. Fed easing.
1. A very high-volume selling flush and reversal.
2002 Bear Market Low
2009 Bear Market Low
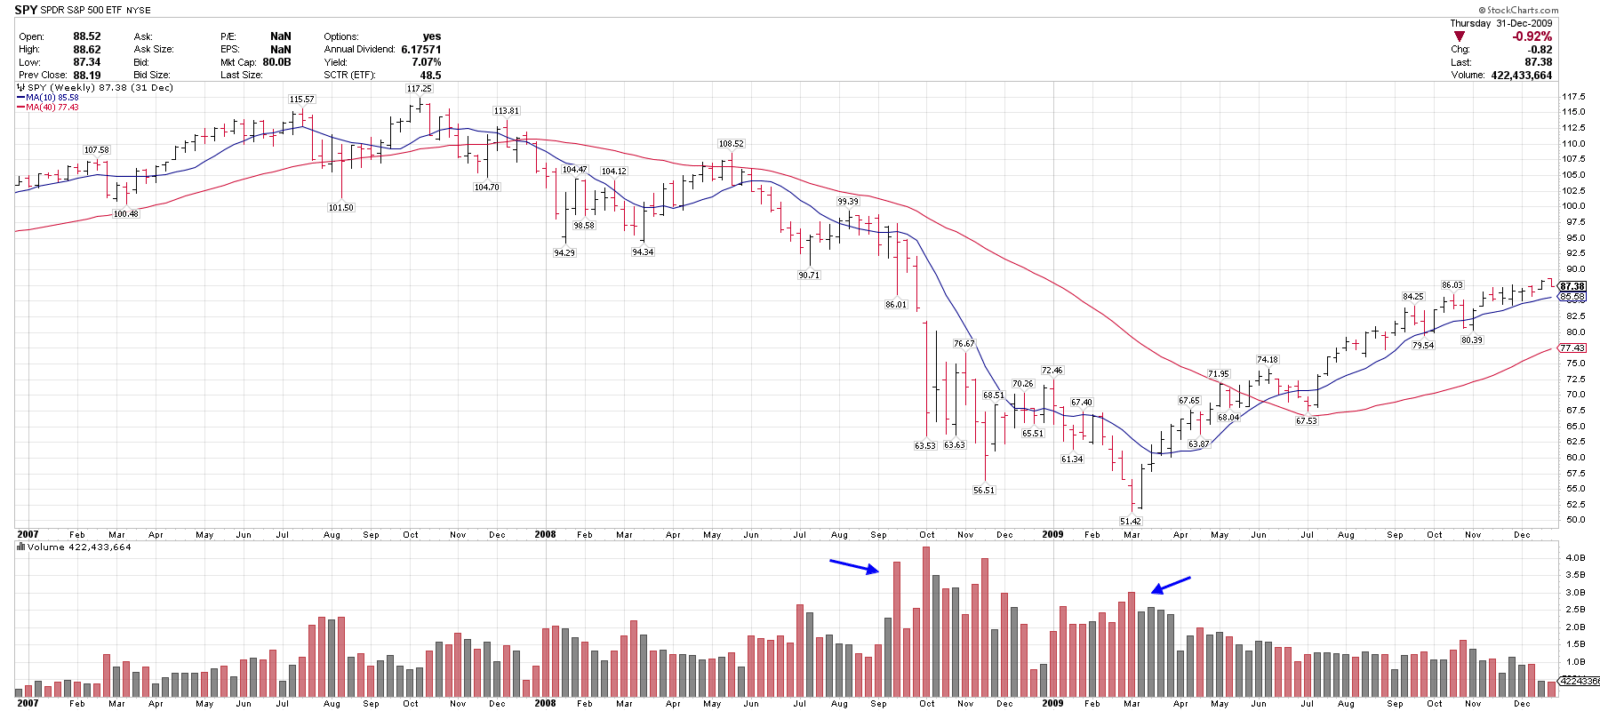
BLOG: It’s a Market of Stocks: 196 S&P 500 Stocks That Bottomed in Q4 2008 – Blue Chip Daily Trend Report
2018 Bear Market Low
2020 Bear market low
2022 Bear market
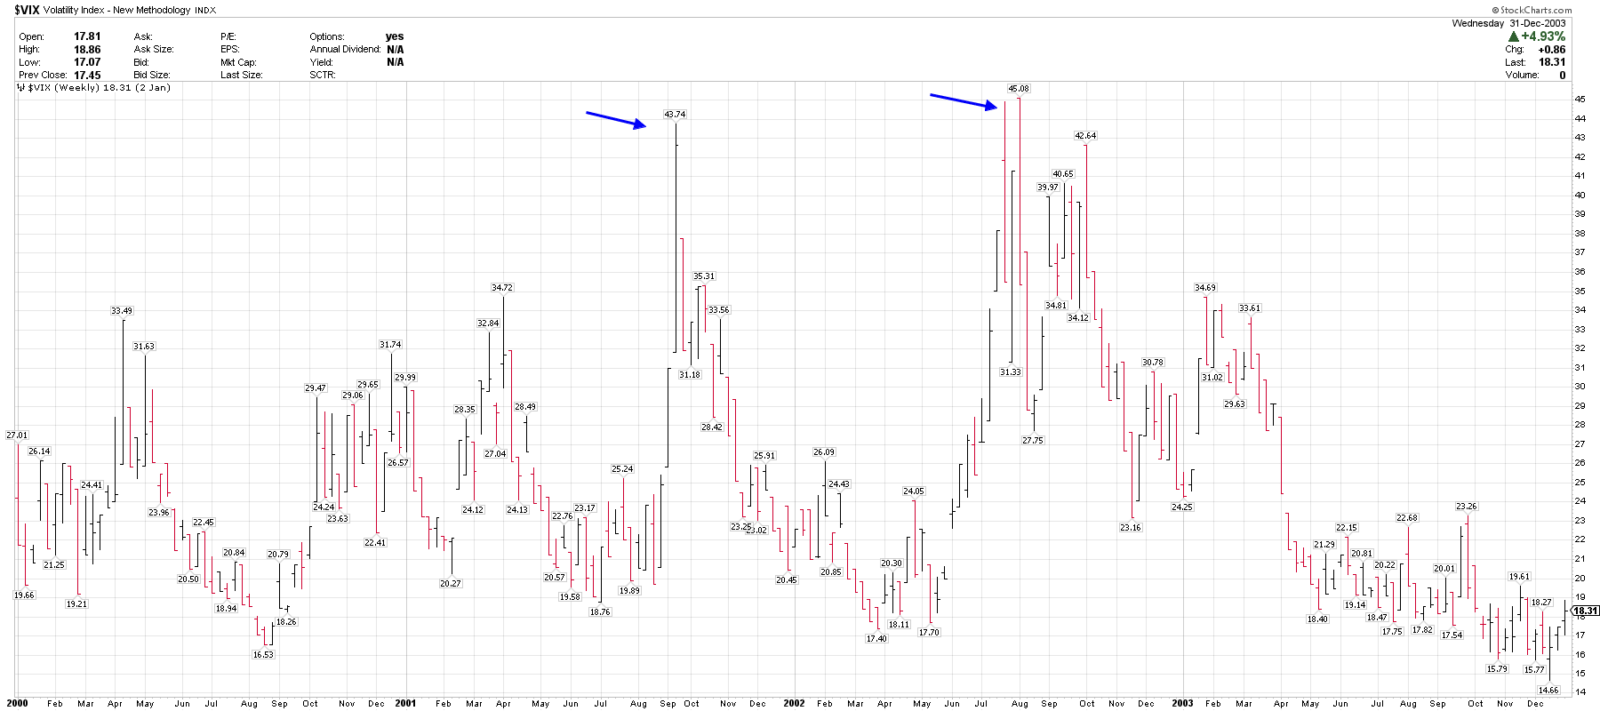
2. A sharp spike and reversal in volatility (VIX).
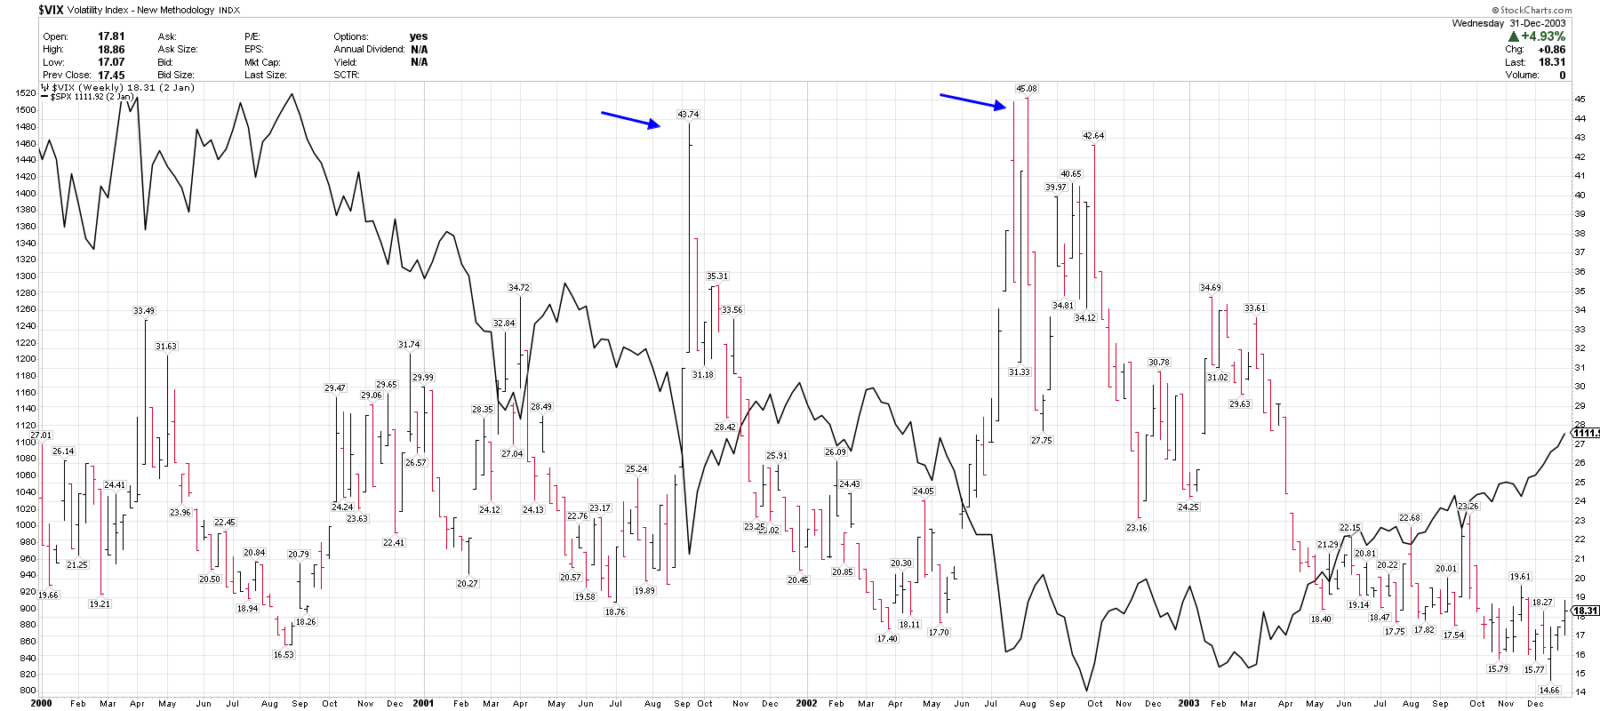
2000-2002 VIX
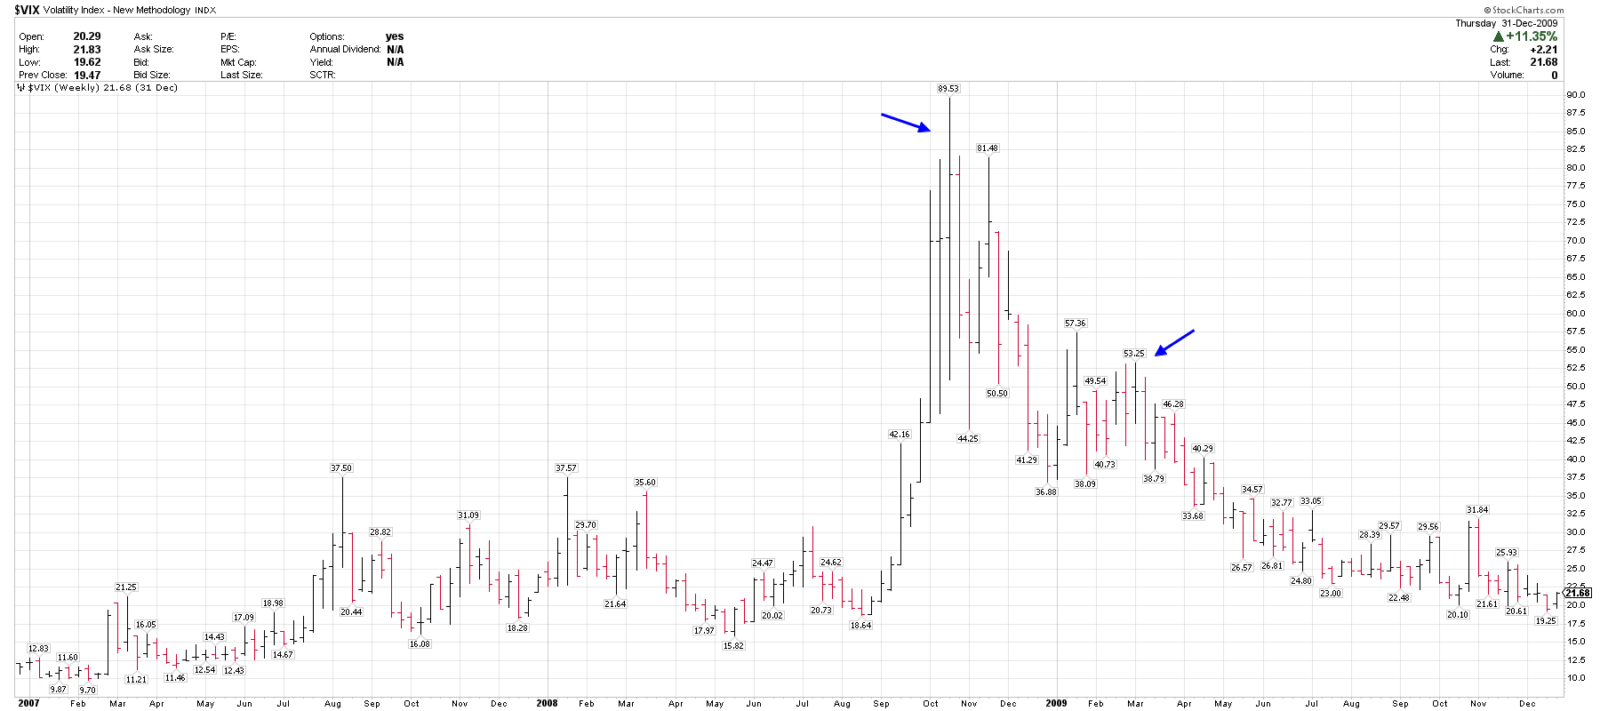
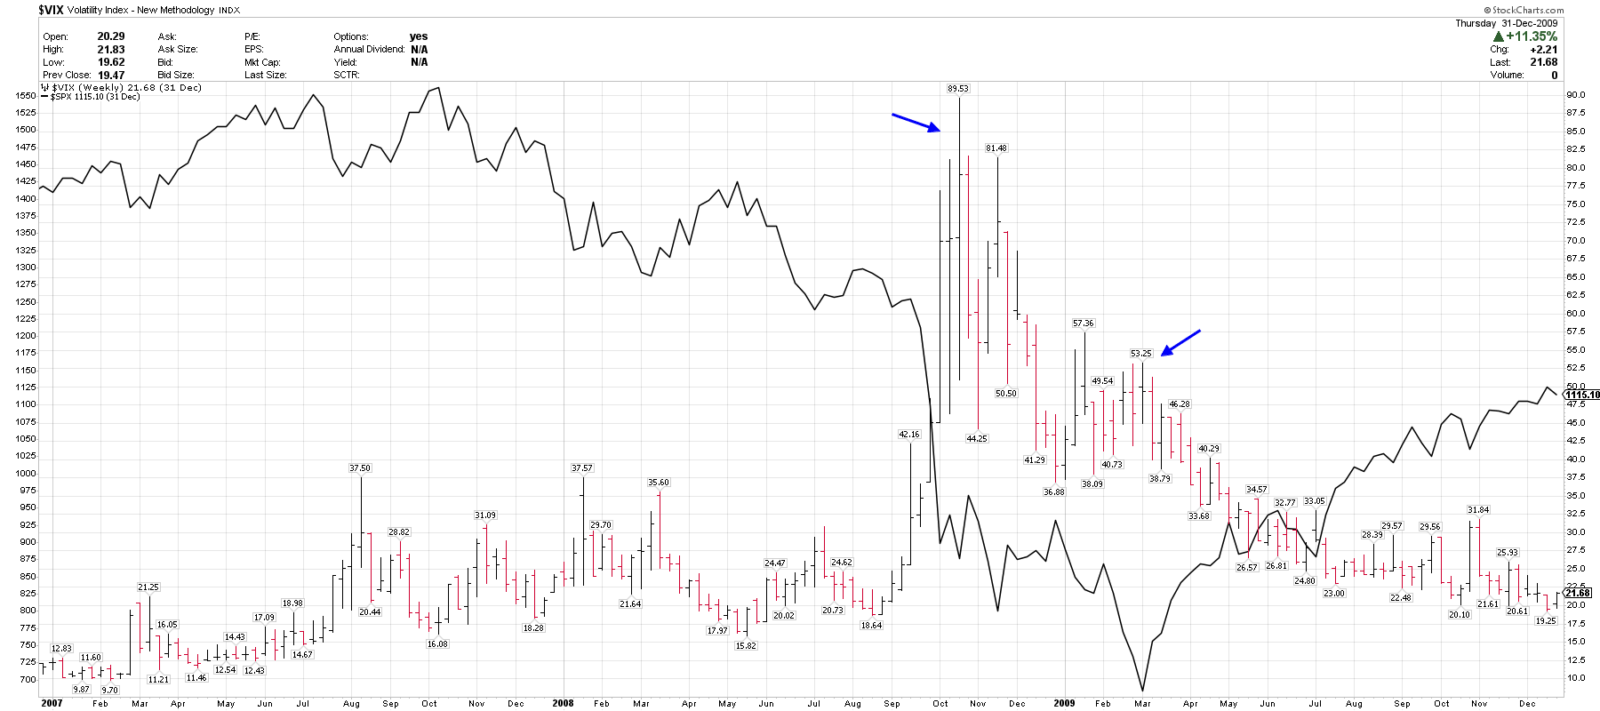
2007-2009
2018
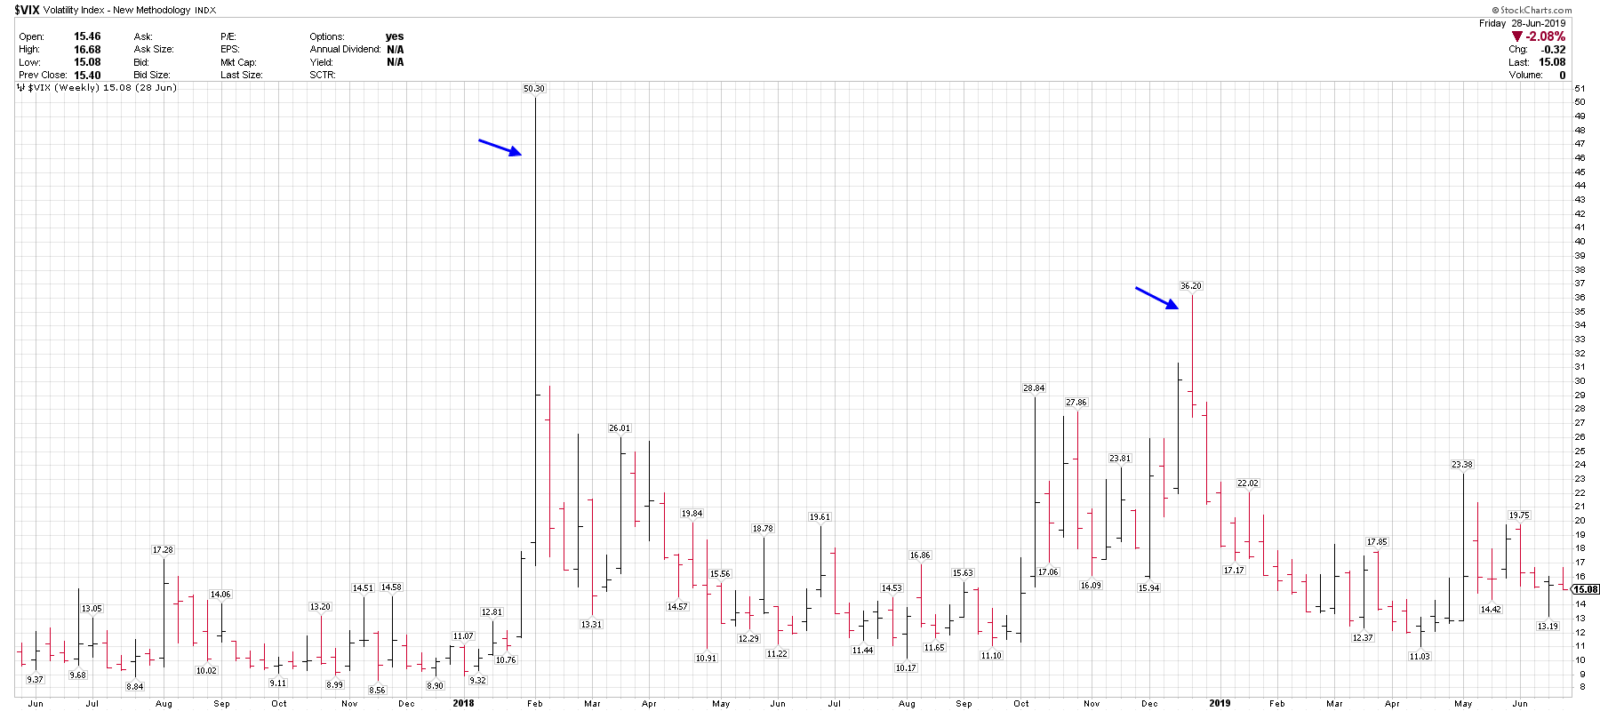
2020
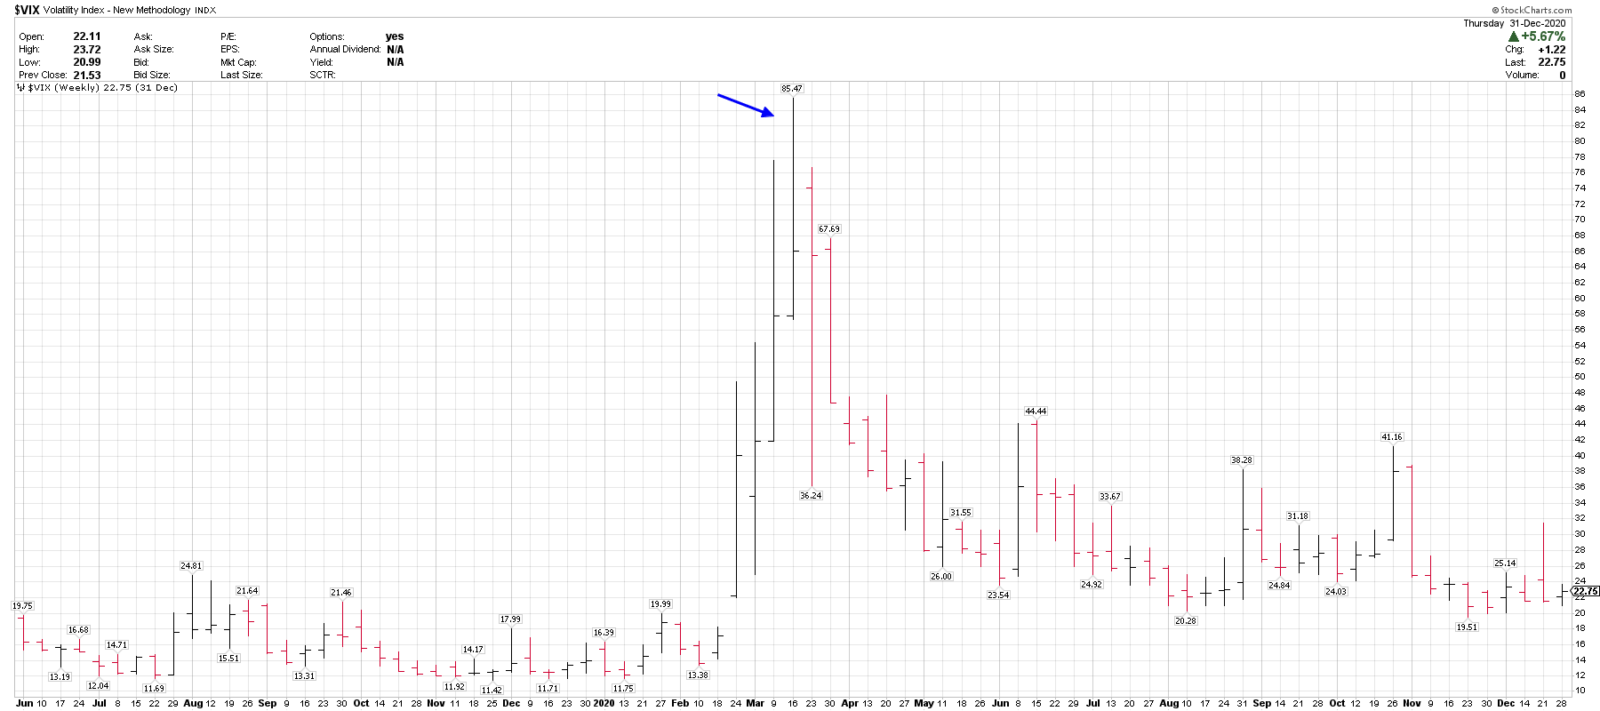
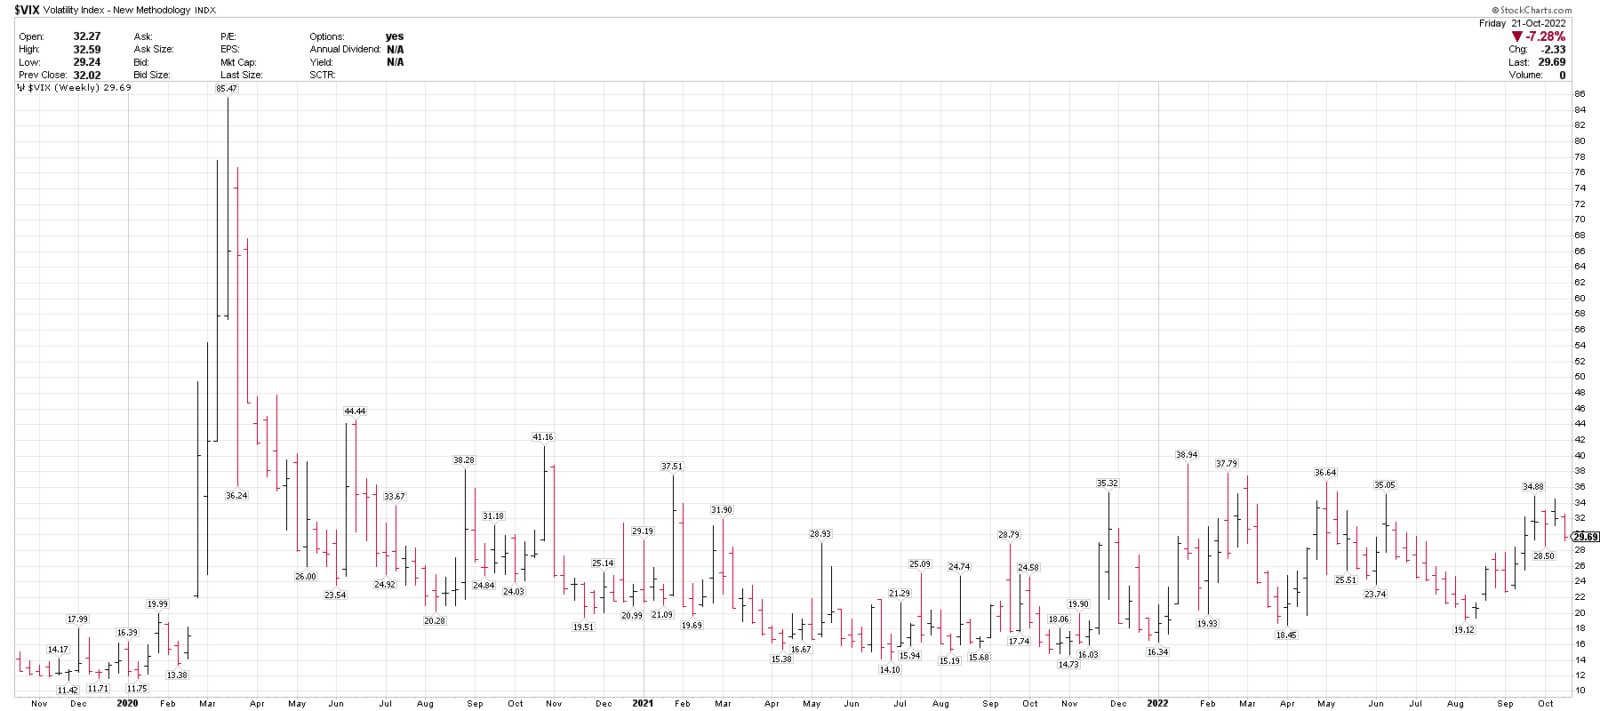
2022 VIX
No major spike, as of yet.
2002 VIX vs SPX
2009 VIX vs SPX
2018 VIX vs SPX
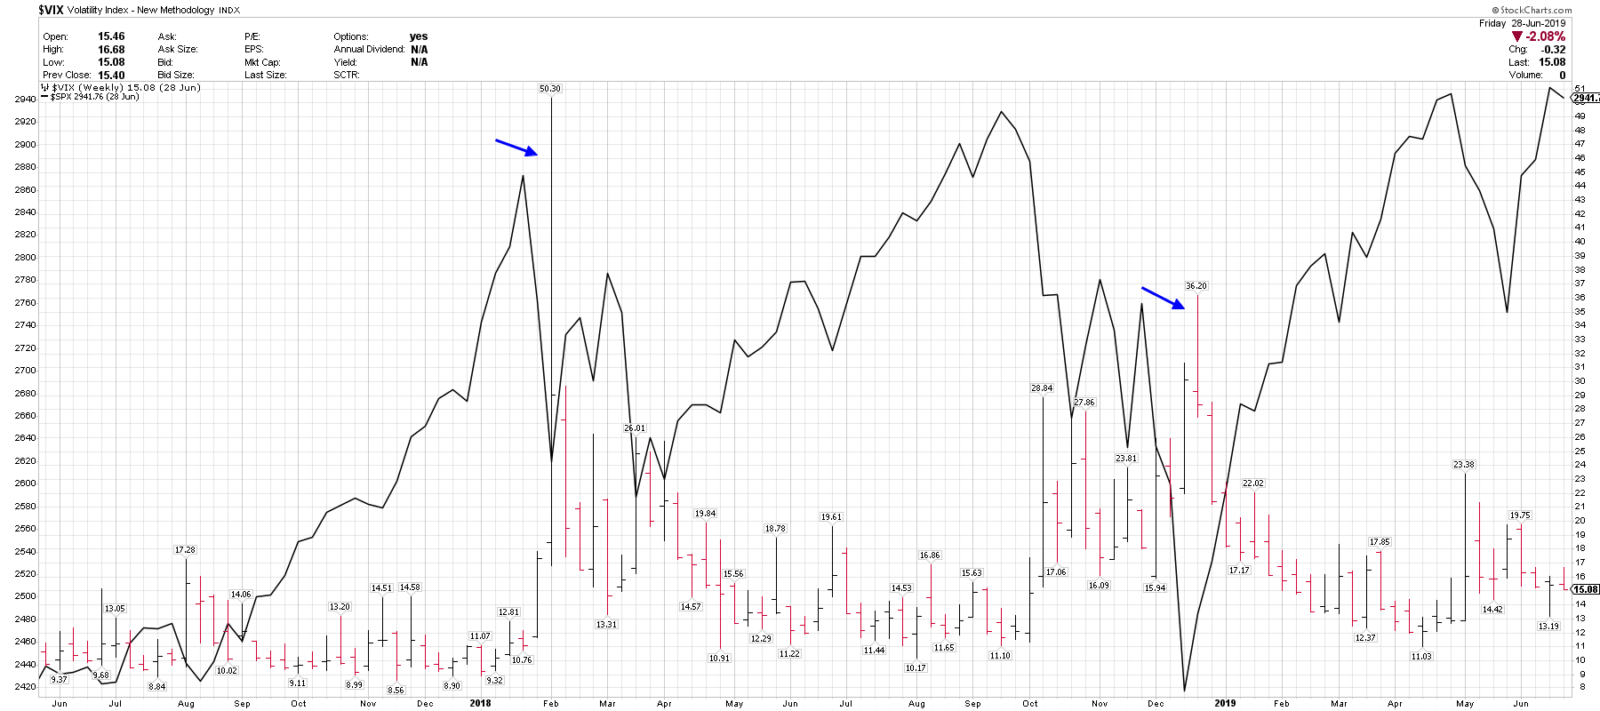
2020 VIX vs SPX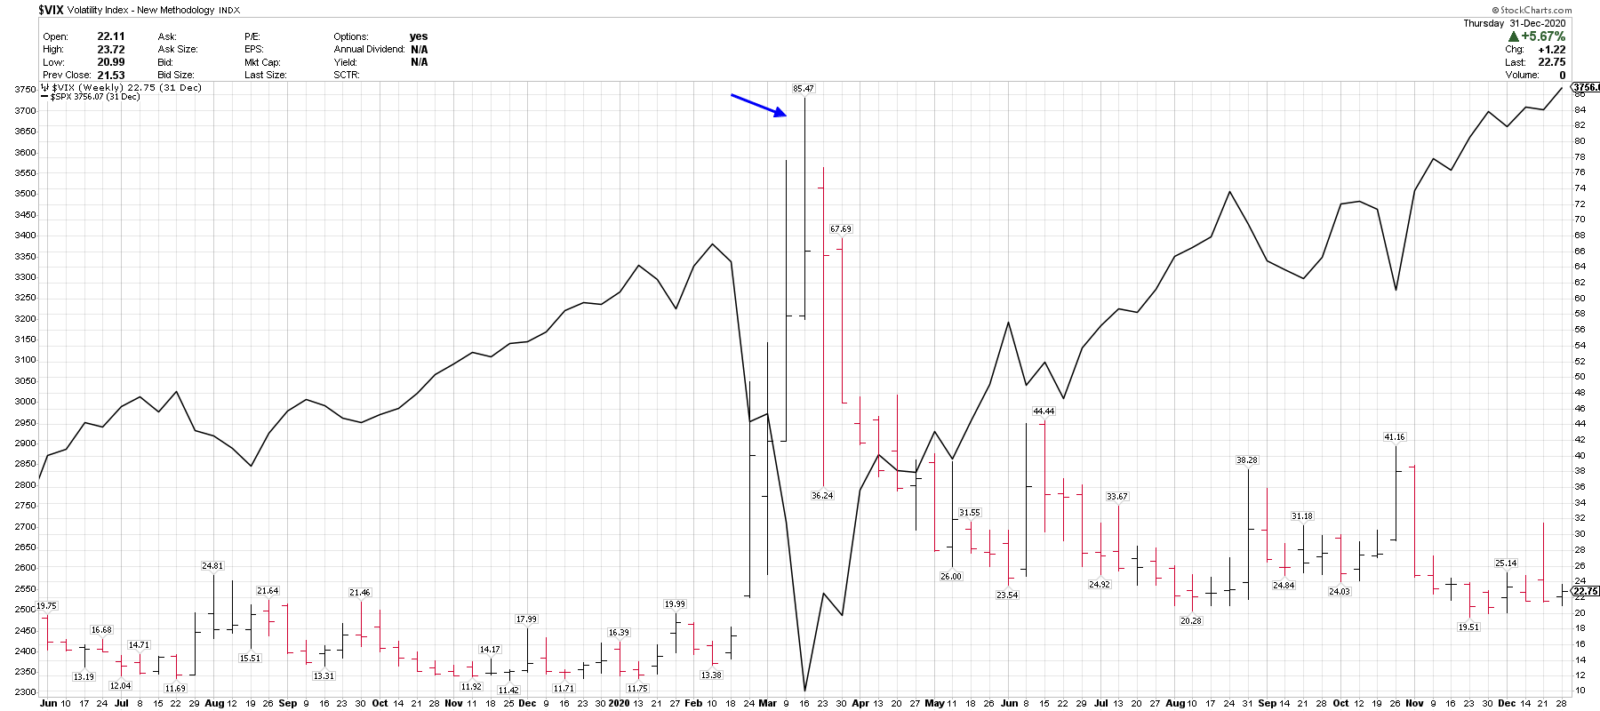
3. Extremely oversold oscillator readings
S&P 500 McClellan Oscillator reached the 4th most oversold level on record, -152.31, in late September 2022.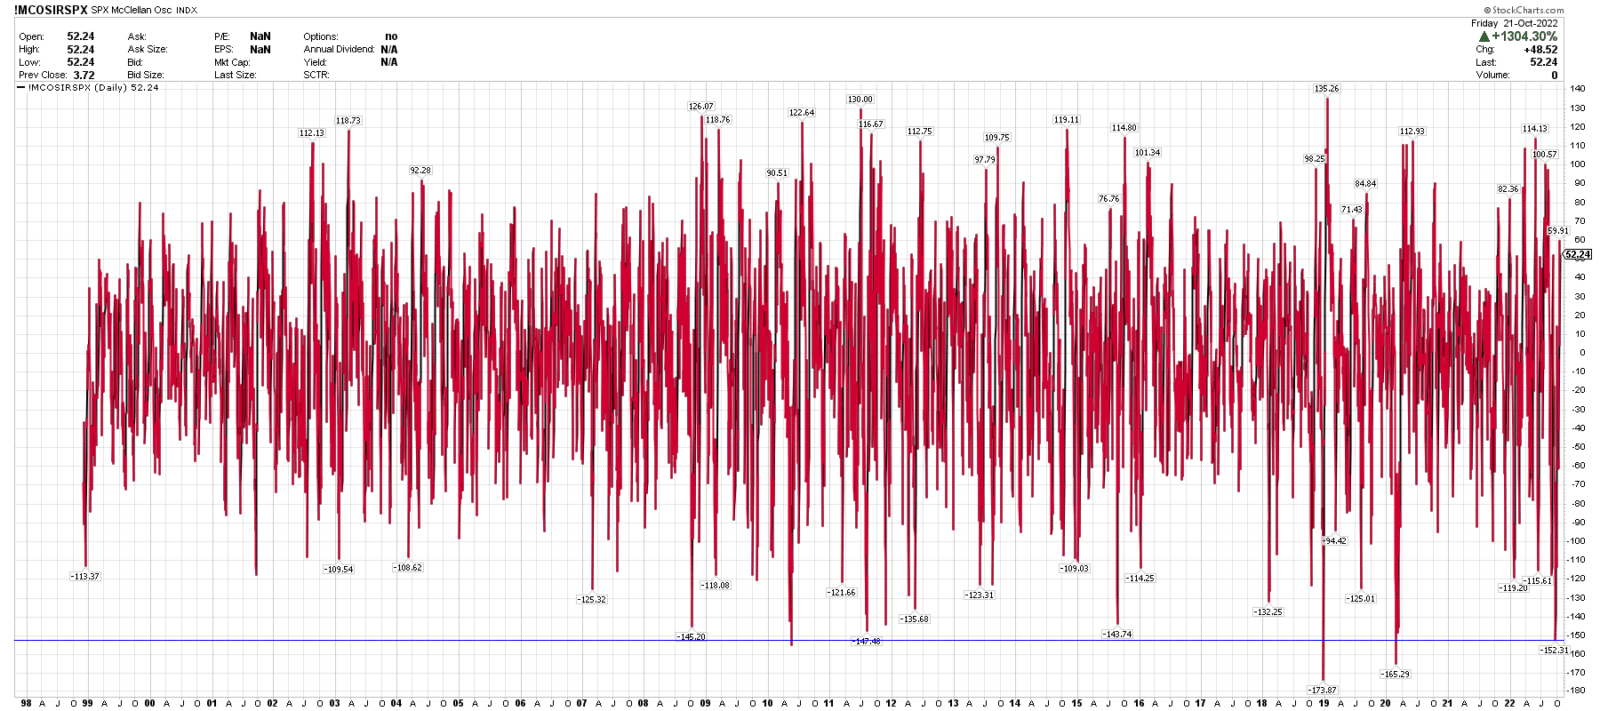
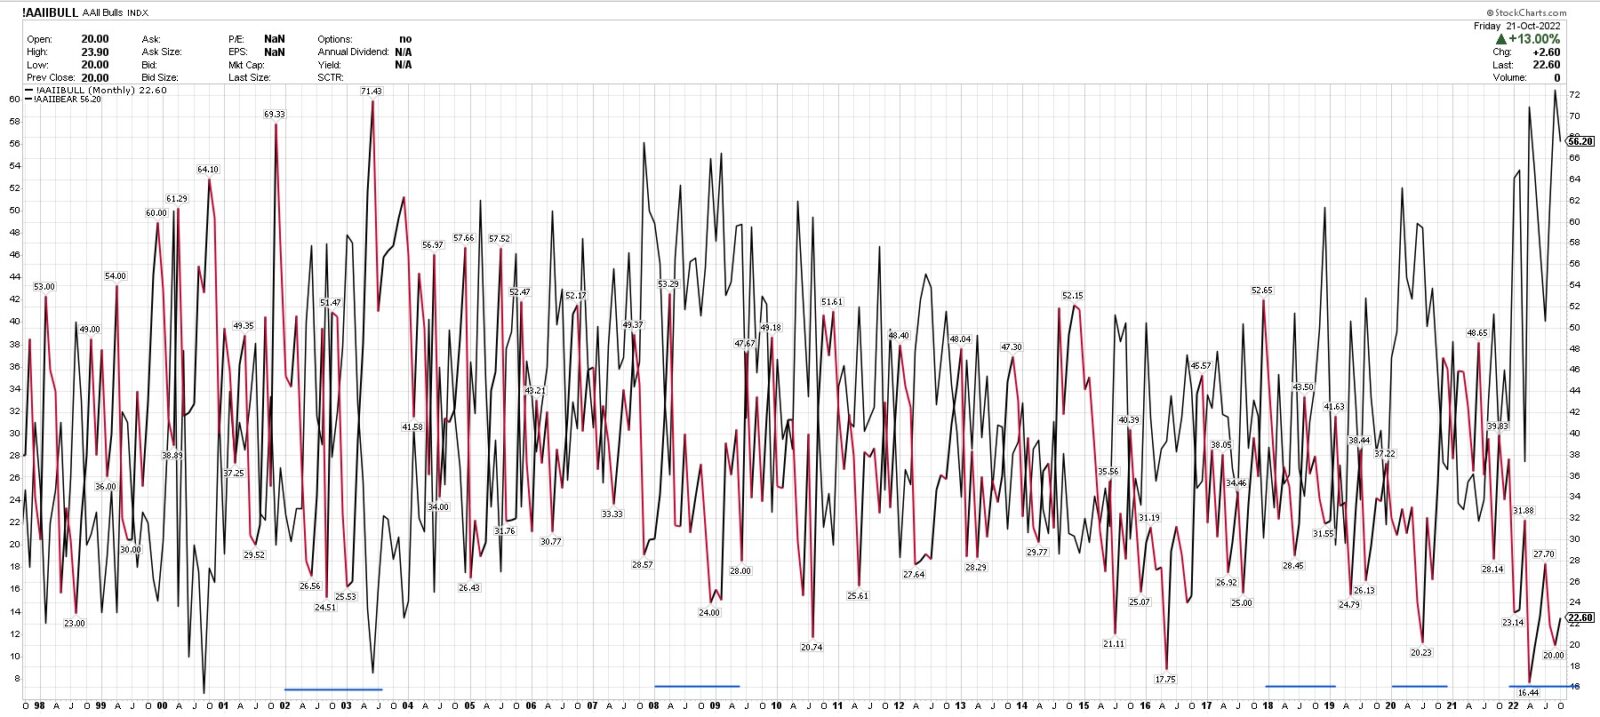
4. Extreme pessimism and low investors/fund manager positioning.
2022 AAII Bulls vs Bears at extreme levels.
From Bank of America Global Fund Manager Survey, dated 10/18/22.
Data and report available to the general public.
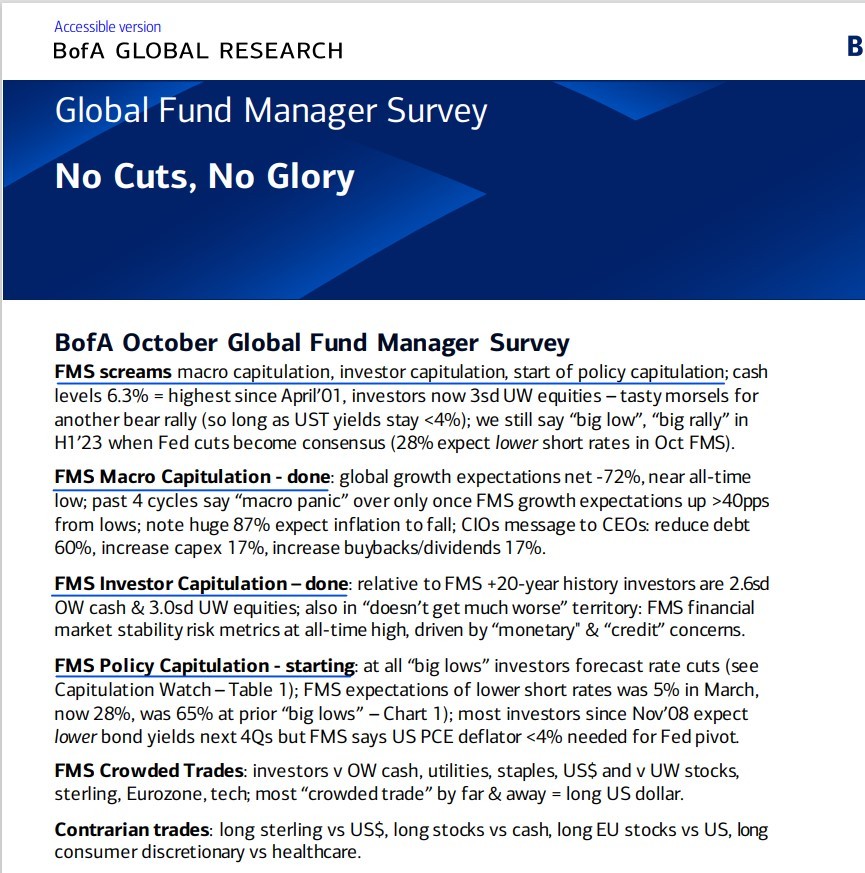
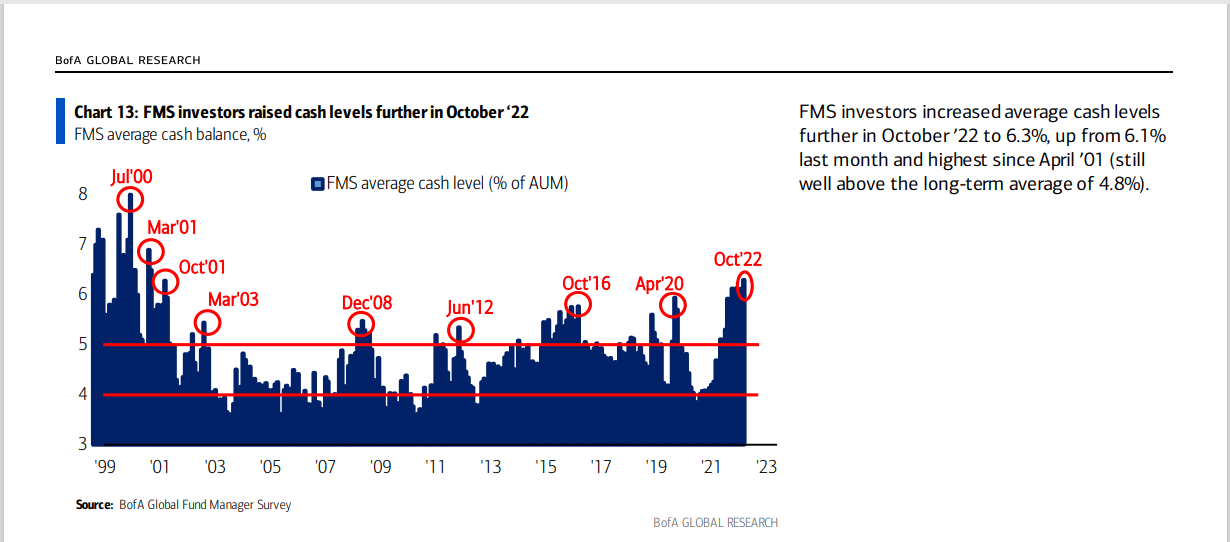
BofA Fund Manager Survey 10/18/22
Cash at 21-year highs
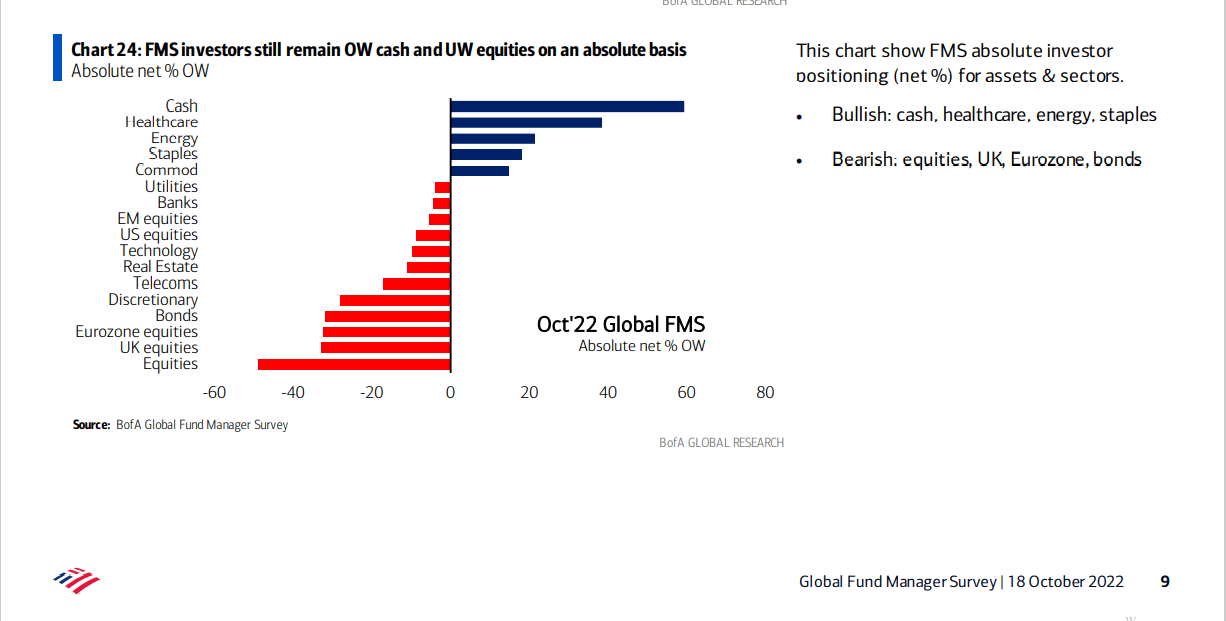
 BOA FMS Positioning
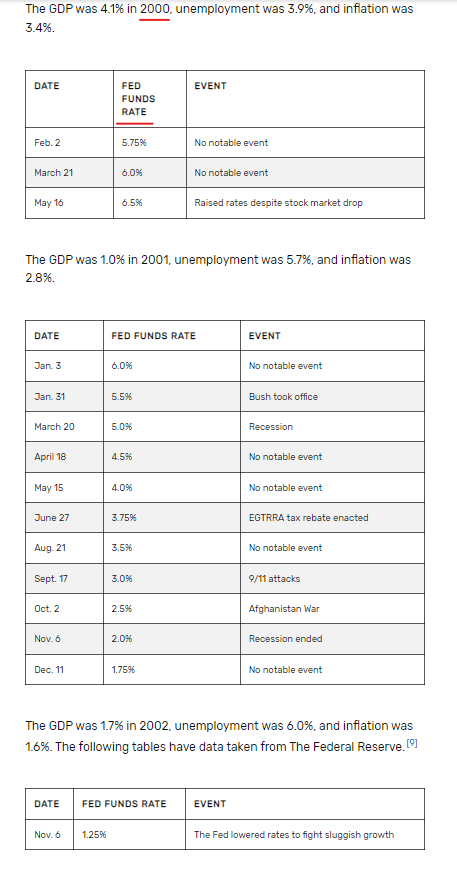
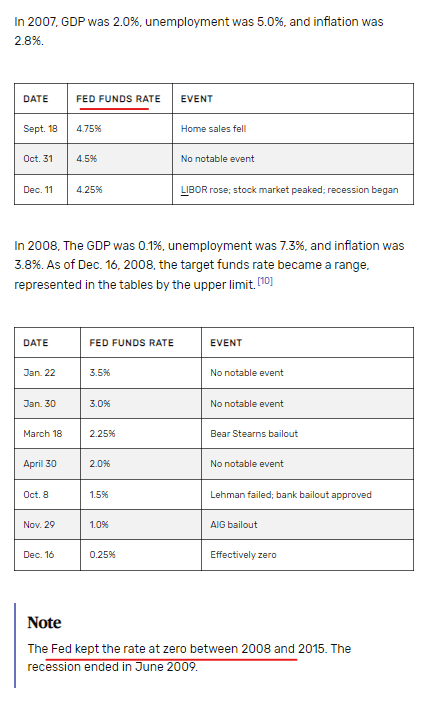
5. Fed Easing and Liquidity
- At the past 4 major market lows, the Fed was cutting interest rates, also engaged in Quantitative Easing (QE) (2008 and 2020), or pivoted on their tightening stance, (2018).
- The Fed is currently raising interest rates at the fastest rate in over 40-year and is engaged in Quantitative Tightening (QT).
2000-2002 rate cutting cycle
 2007-2009 cycle
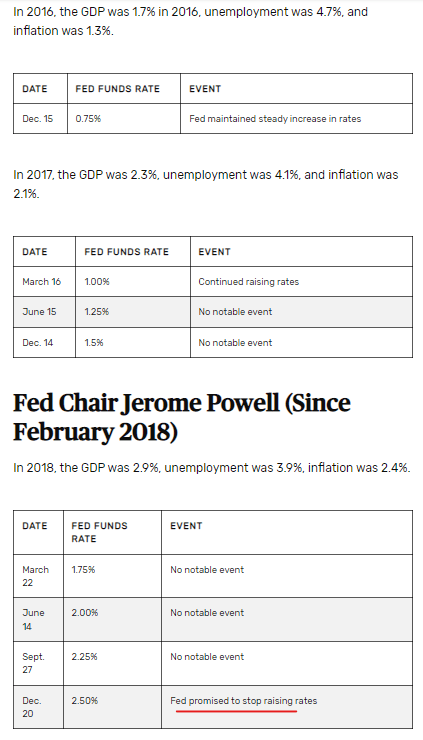
 2018 end of rate cuts.
 2020 rate cutting cycle.
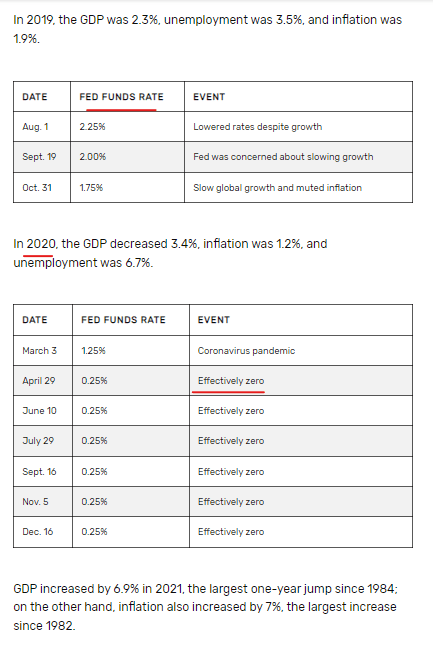 2022 rate hiking cycle.
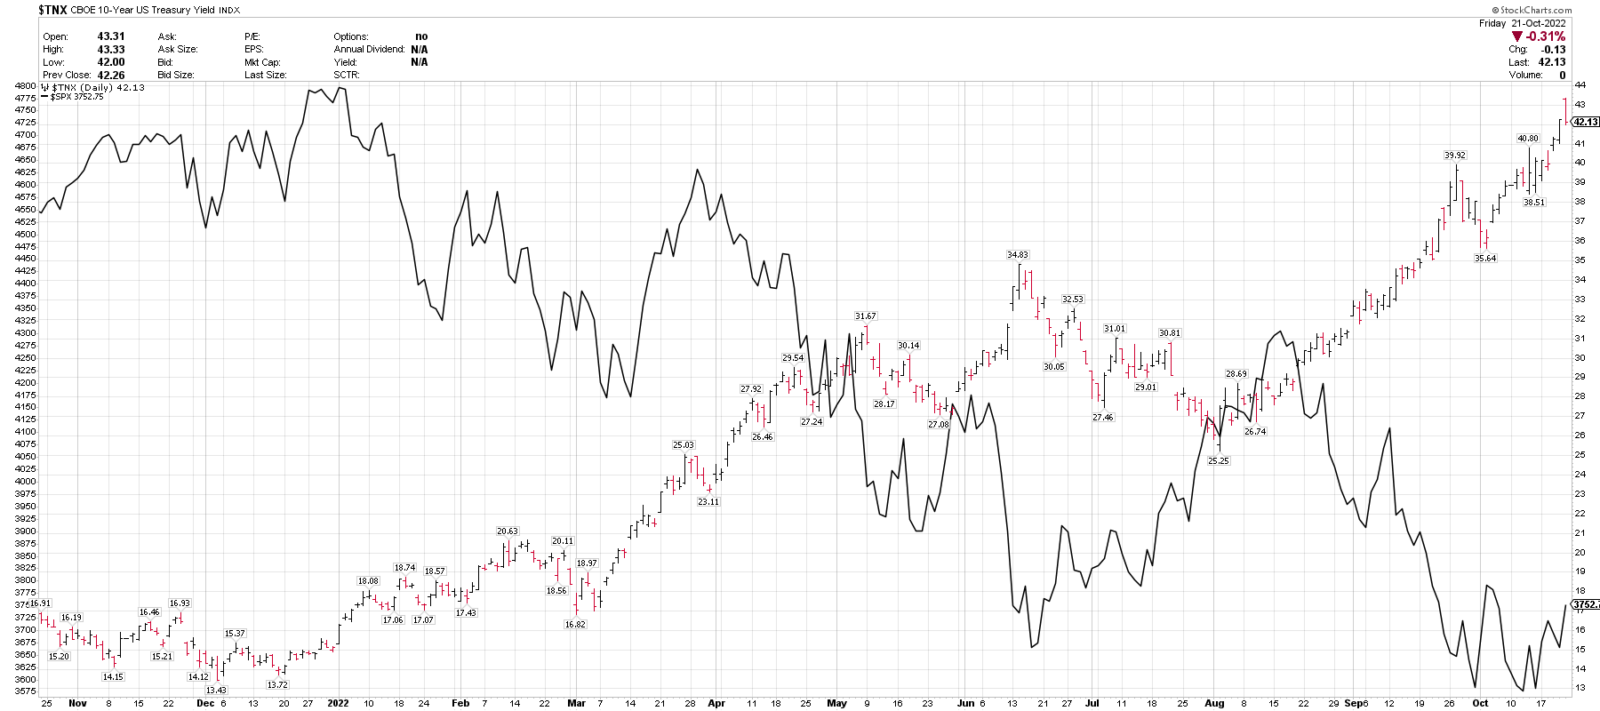
Bond Yields
- CBOE 10-Year US Treasury Yield (TNX) vs S&P 500 Index (SPX)
- (TNX) and (SPX) have been heavily inversely correlated in 2022.
- Higher inflation = higher bond yields (TNX) = lower stocks (SPX).
- Any potential significant drop in bond yields could be a major benefit for the S&P 500 index.
SUMMARY:
My view and positioning for now is that we have seen two of the five major bottoming signals:
- Extremely oversold oscillator readings
- Extreme pessimism and low investors/fund manager positioning.
- I don’t believe that we have seen a massive volume price spike and reversal nor volatility spike and reversal.
- The Fed is still hiking, although they are likely getting closer to the end of the hiking cycle, at least from a point perspective.
- The Fed Fund futures market is pricing in a target rate of 425-450 at the end of 2022.
— - My view is that the October 13 low is at least a tradable (near-term) low, which could develop into more. A close below 3500 in (SPX) could negate this view.
- There are quite a few factors that could increase the chances of the final lows being in.
- I have been increasing equity exposure over the last week, but I plan to be more tactical for now, as I will explain below.
- This doesn’t mean that I am predicting that the recent lows won’t be or can’t be the final lows – they could be. I just haven’t seen enough to go “all-in” as of yet.
5 Best Ideas to Invest and Trade in Today’s Market Environment.
1. Focus on your own time frame and reduce the amount of financial media advice and opinions.
- The financial media (CNBC) and social media offer an abundance of opinion and predictions.
- My experience has been that it is best to pay less attention to outside predictions and opinions and focus more on the charts, what price is doing and the current trend.
- Also, third party time frames won’t always align with yours. Someone with a 2-3 day or 2-3 week holding period will often view charts and markets differently than someone with a 2-3 month or 2-3 year holding period.
2. Hold much higher cash levels.
- The best true hedge is always cash. Almost all other hedging strategies will come with a degree of volatility.
- Cash doesn’t fluctuate in value in your portfolio and most importantly it offers peace of mind in high volatility markets.
- Short positions, whether in stocks or inverse ETFs and put options all have volatility and at times a very high amount of it.
- We do use downside hedges, but the first priority is to get cash levels correct for risk tolerance.
- Always expect pullbacks.
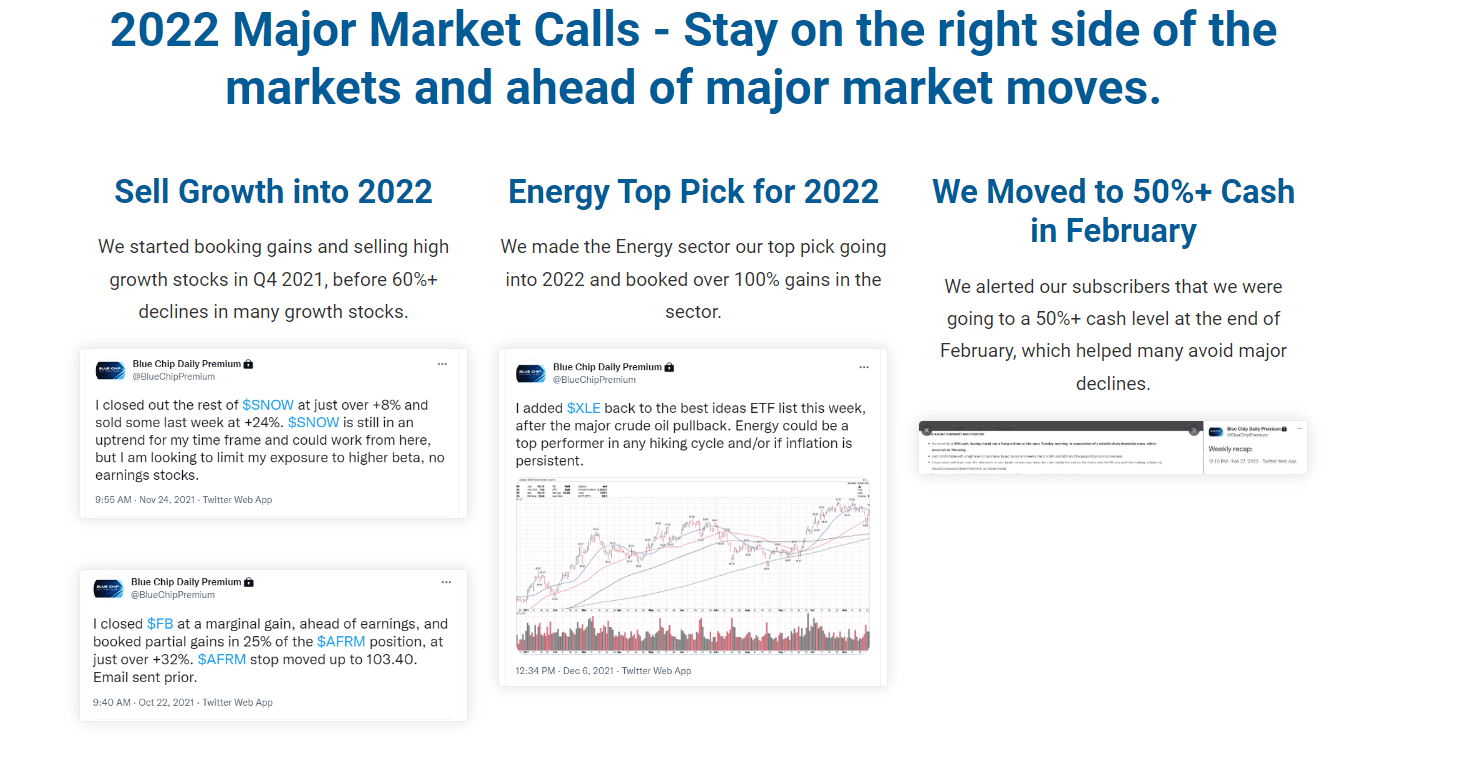
- We rotated to over 50% cash in February 2022.
3. Use smaller position sizing and reduced trading and investing activity
- Don’t try to actively trade both sides of the market at the same time.
- It’s OK to hold both sides, but focus on one at a time.
- Another way to reduce overall volatility, but to still participate and be engaged is to reduce position sizing, maybe in half, from traditional markets.
- 5%-10% for ETFs vs 10-20%
- 2-3% for stocks vs 5%.
- Expect sharp pullbacks or sector rotation at any time.
- With VIX near 30, expect 2% daily ranges.
- Expect negative news headlines and volatility at any time.
4. Scale in and scale out.
- Take advantage of market volatility by building positions in multiple smaller buys and on pullbacks.
- Less volatility, reduces cost basis.
- Building a position with a planned multiple buy, scale in strategy is not the same as adding to a losing position.
- Profit from pullbacks and volatility.
- Build gradual exposure.
- Take frequent gains
- Before adding more risk, reduce risk elsewhere.
- Highly volatile markets can turn quickly, book smaller and more frequent gains on the way up.
5. Use downside hedges
- Cash & basic index put options on (SPY) longer dated 6-12 weeks out.
- Consider as insurance and peace of mind.
What to watch for right now. 5 potential catalysts that could improve the chances of the final lows being in.
- Key levels – (SPX) needs to hold over 3500 on a closing basis. A close over 3800 to confirm a range breakout.
- Bond yields (TNX) – a sharp drop below 4.00 could be a benefit to (SPX).
- Volatility Index (VIX) – a sharp close below 28 would be a benefit.
- CPI and inflation data – any sharp drop would be a benefit.
- Fed (FOMC) commentary – any softer stance or hint of a slowdown in the hiking cycle, not necessarily a pivot, would be a positive.
- Any major resolution with Russia/Ukraine.
Start a 30-day free trial to Blue Chip Daily here: Blue Chip Daily Trend Report