


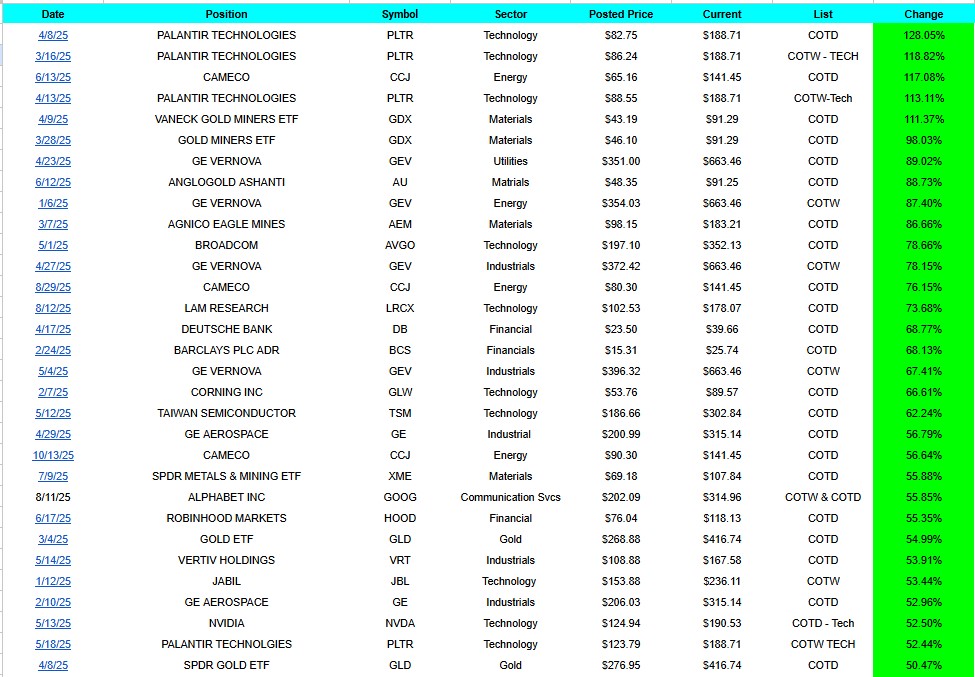
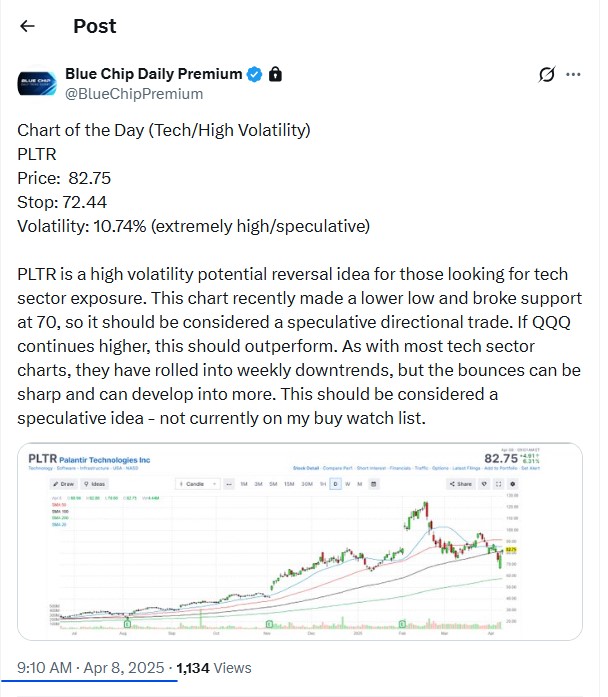
 In 2025, we have 30 posted Chart of the Day or Chart of the Week ideas that are currently up from 50% to 128%. Data as of 12/28/25. Each Chart of the Day idea is tracked 24/7 on our members website, above.
The bottom 10 performers were all stopped out at an average of – 16.1%.
January 2026
– Select Open Position
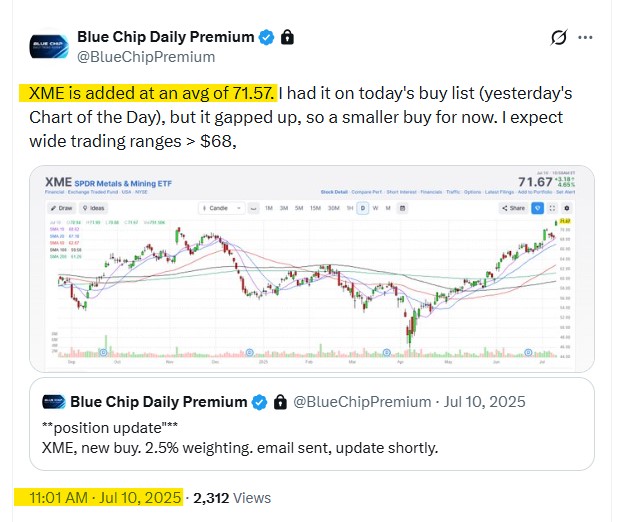
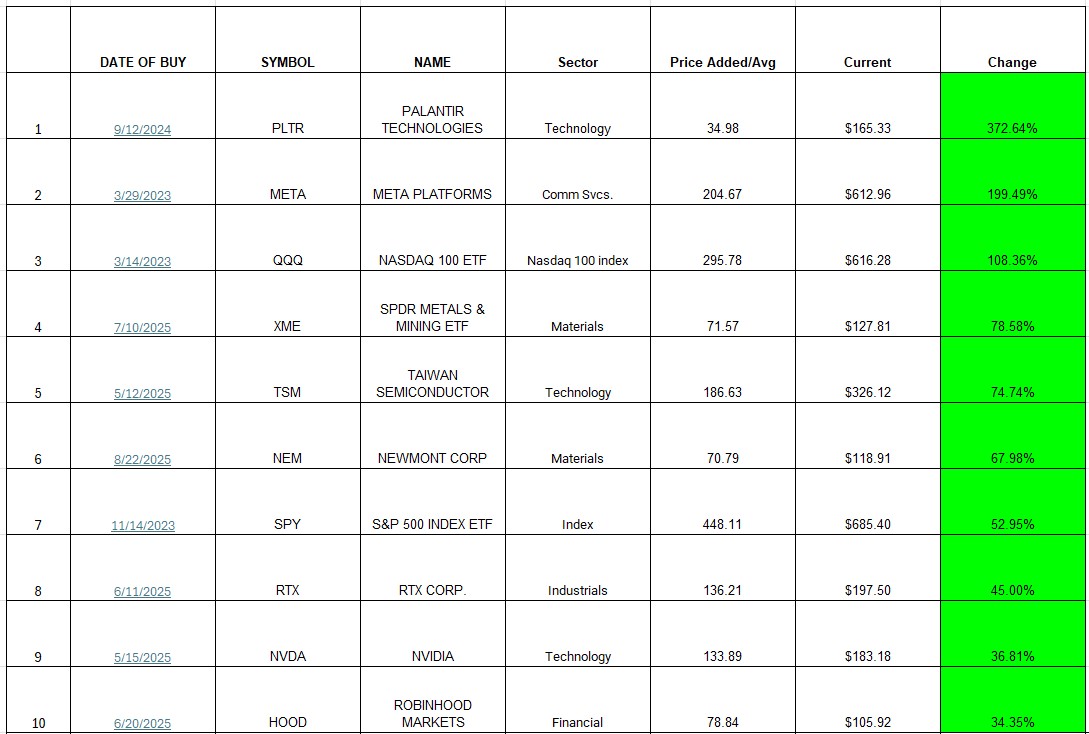
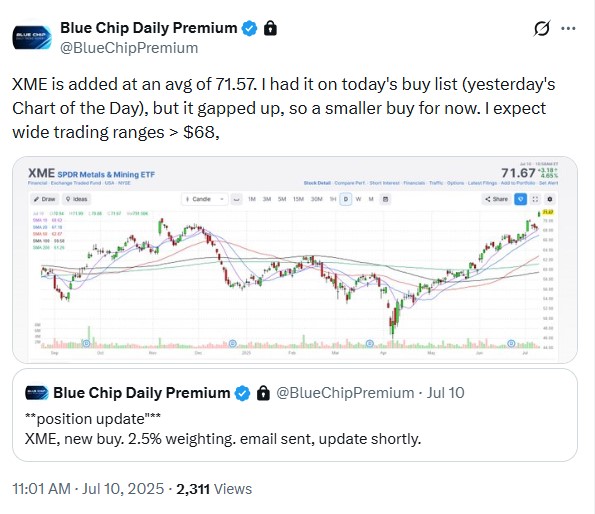
– SPDR Metals & Mining ETF (XME) +55% from our 7/10/25 buy.