4/19/20
Blue Chip Daily Chart of the Week:
Nvidia, $NVDA
Close: 292.32
Stop level: 244.47
(commentary below chart)
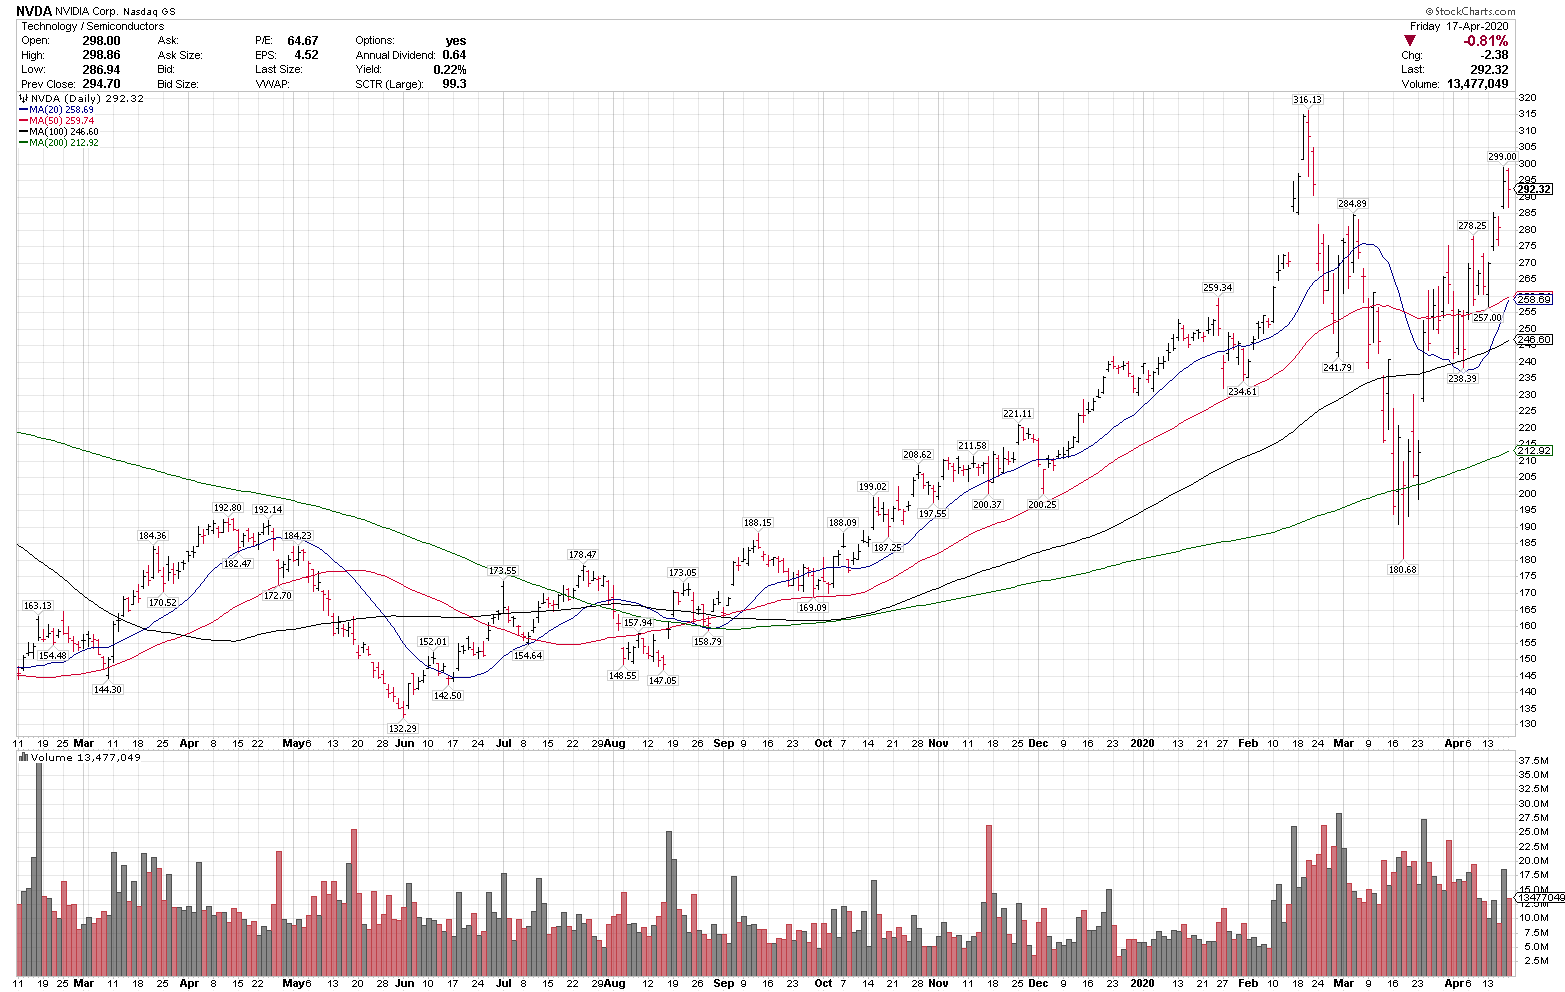
$NVDA continues to be one of our top technical ideas here, in a longer-term uptrend above all key rising MAs. $NVDA recently held the rising 50-day moving average, and over $280 could be setting up for another leg higher.
We alerted our Members in real-time on April 13, by making $NVDA our ‘Chart of the Day’ best daily idea, then trading at 261.82. $NVDA is +11% since then and is still a top longer-term idea here.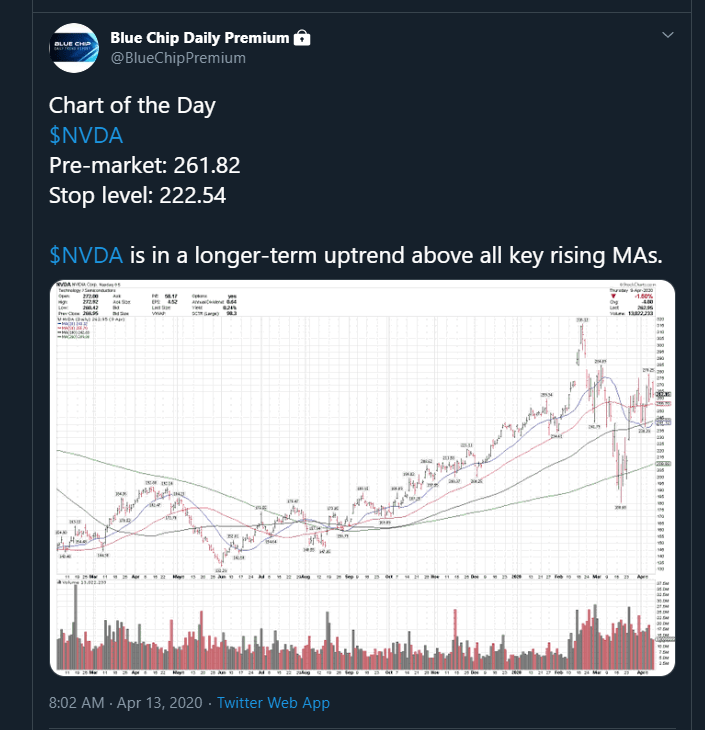
Here is our new blog, outlining our recent best ideas for our subscribers in $AMZN, $AMD, $MSFT, $NFLX and $SHOP. https://bluechipdaily.com/top-trade-ideas/
Join today to get our daily best technical idea, Chart of the Day, to your inbox every morning, plus our real-time best ideas, technical commentary and risk management on our premium Twitter feed.
Have a great week,
Larry Tentarelli
Publisher
https://bluechipdaily.com/disclaimer/