08/30/20
Blue Chip Daily Chart of the Week:
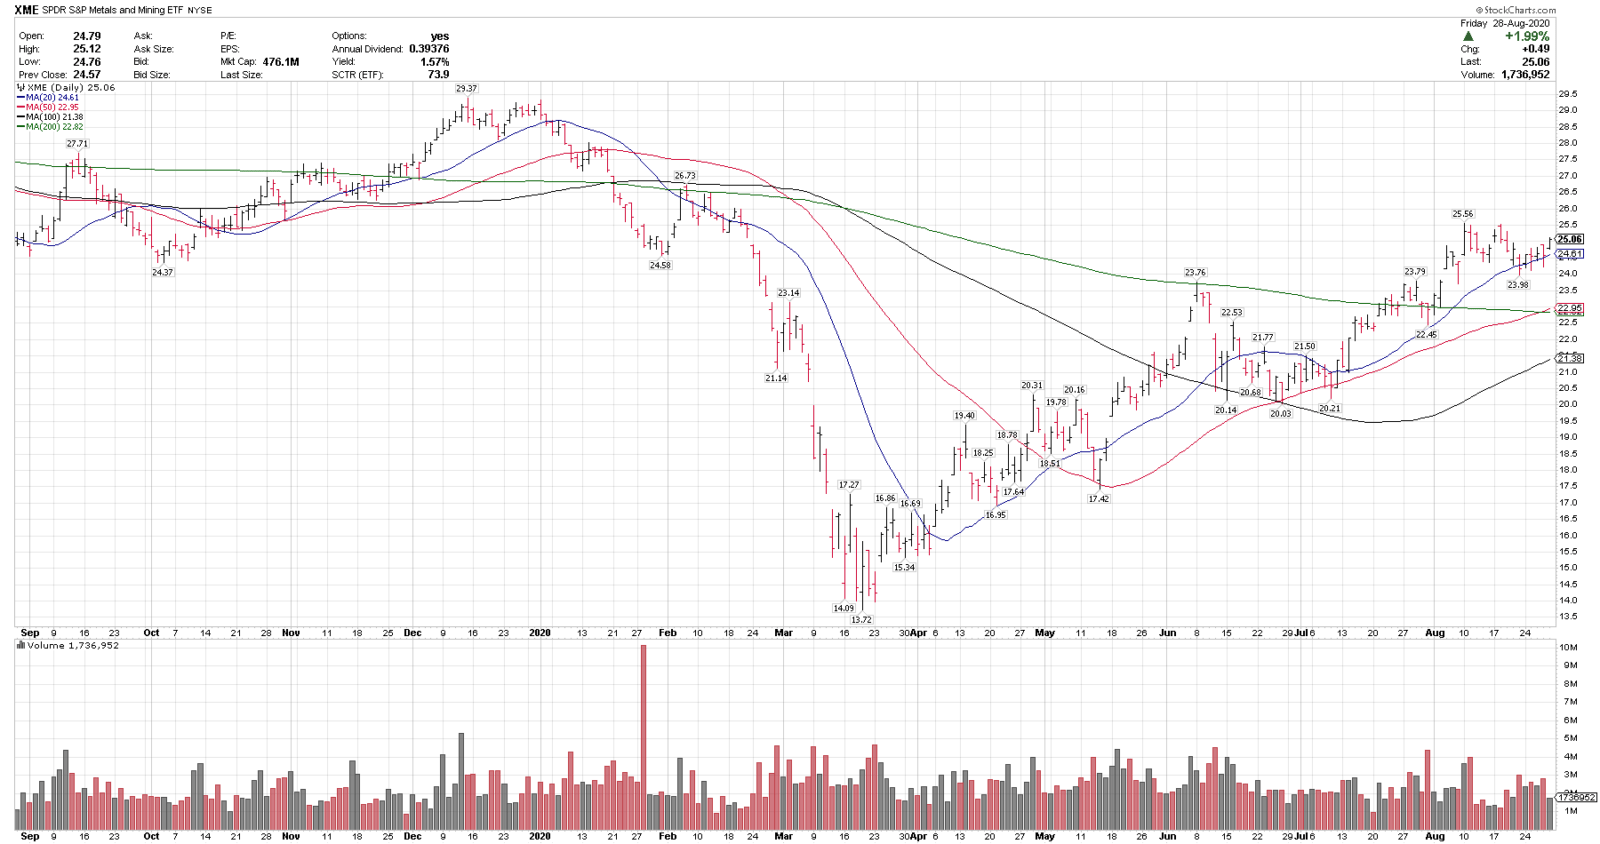
XME, SPDR S&P Metals and Mining ETF
Close: $25.06
Stop level for position traders and investors: $22.36
please see chart analysis below
- XME is one of our top technical ideas here and on this week’s Blue Chip Daily Buy List for subscribers, and has been on the Buy list for most of the last few months.
- XME is in a technical uptrend above the rising 20, 50 and 100-day moving averages and is trading above the 200-sma, a signal of a strong uptrend on multiple time-frames.
- It recently broke out above $24, then tested and held that range before moving higher, a positive signal.
- XME recently completed a 50/200-sma cross, another bullish technical signal, indicating that intermediate-term momentum is improving as well.
- XME has held the rising 50-sma since late April, and that can be used as a key trend gauge here as well.
- On a non-technical note, the Fed announced last week that they are targeting higher inflation. If they are successful with this, industrial metals should benefit.
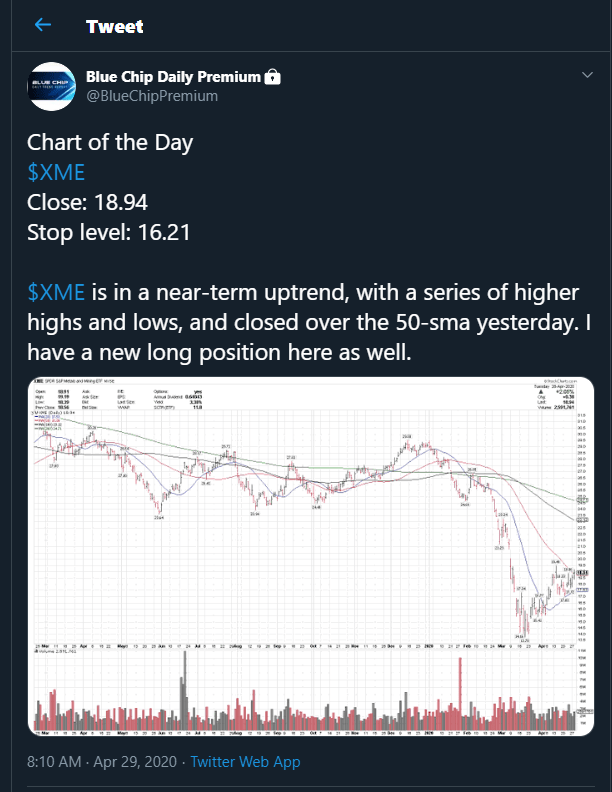
- XME first went onto our Members Best Ideas buy list on 4/29 at $18.94 and is +32% since then. It is still a top technical idea here as well.
- There are single stock components of XME that I believe are positioned to outperform from here, and I currently have open positions in these names.
- Join us today to get immediate access to my top single stock ideas in this space. https://bluechipdaily.com/join-blue-chip-daily/
See my top 5 open positions, our best technical alerts and 2020 major Market Trend calls here: https://bluechipdaily.com/performance/
Have a great week,
Larry Tentarelli
Publisher