05/2/21
Blue Chip Daily Chart of the Week:
Walgreens, WBA
Close: 53.10
Stop level for position traders and investors: 44.93
please see chart analysis below
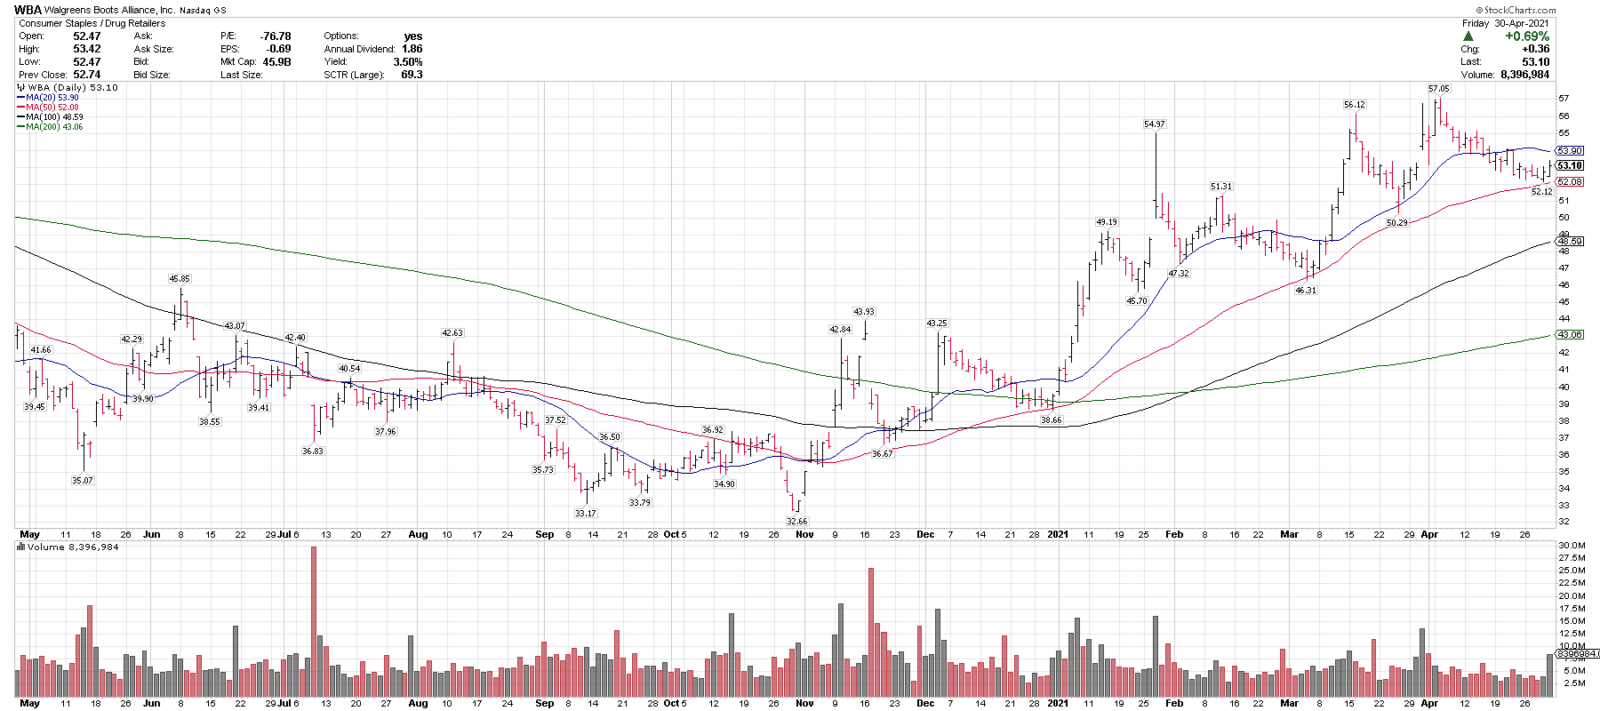
- Walgreens (WBA) is one of our top technical ideas coming into the week, was our Chart of the Day last Friday, and is on this week’s Members Top 25 Stocks List.
- WBA is currently trading over rising 50, 100 & 200-day moving averages.
- WBA recently pulled back 8.6% from 15 month highs and held at the rising 50-sma.
- WBA has put in a series of higher highs and higher lows, indicating a strong uptrend.
- 50-52 is key support on any pullbacks, and over 57 could signal a new breakout.
See updated top performing technical ideas here: https://bluechipdaily.com/bcd-top-25-buy-list/
Have a great week,
Larry Tentarelli
Publisher
Disclaimer – Blue Chip Daily Trend Report