04/18/21
Blue Chip Daily Chart of the Week:
Sea Ltd., (SE)
Close: 252.42
Stop level for position traders and investors: 208.24
please see chart analysis below
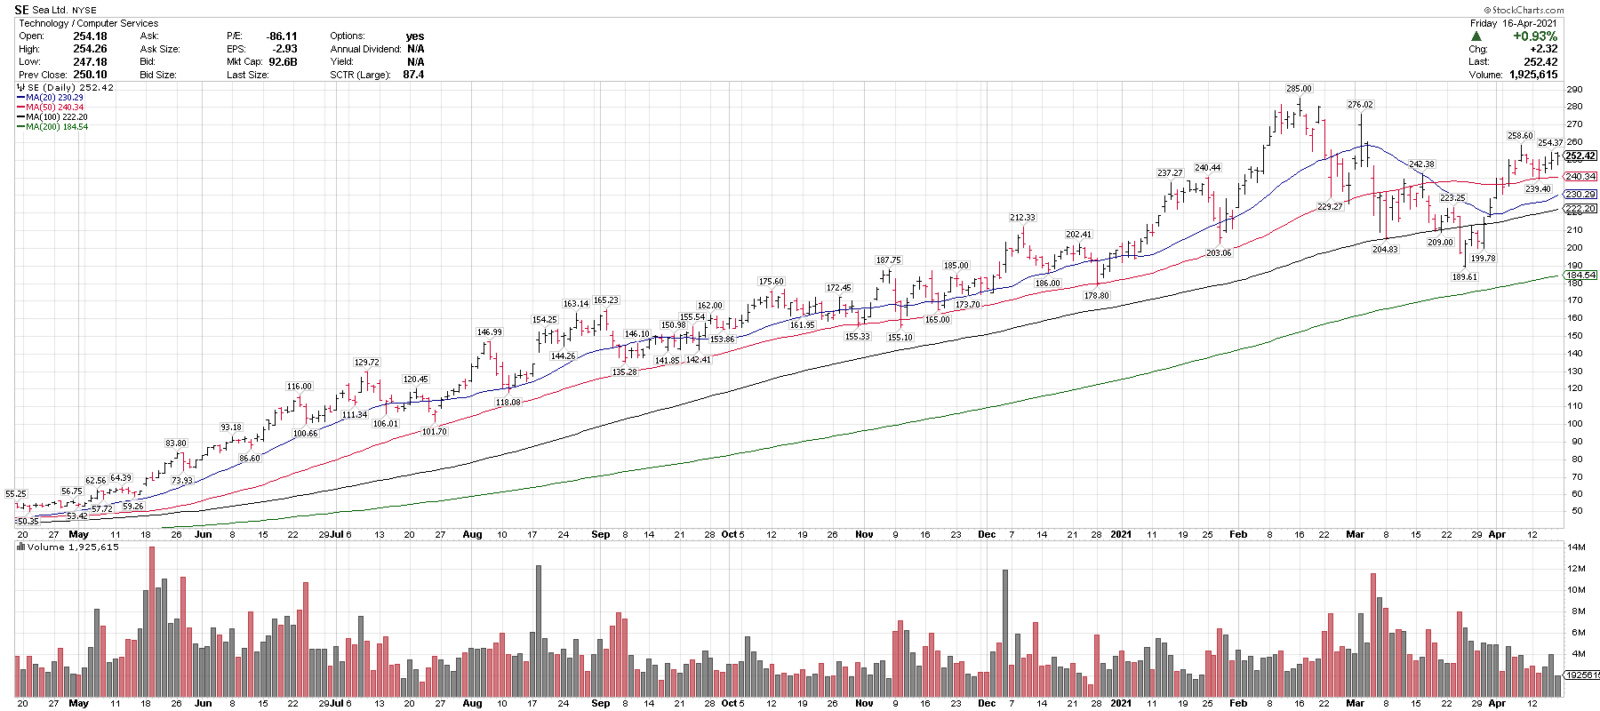
- Sea Ltd. (SE) is one of our top technical ideas coming into the week, was our Member’s Chart of the Day last Wednesday (4/14) and is on this week’s Members Top 25 Stocks List.
- SE is currently trading over the 20, 50, 100 & 200-day moving averages.
- SE recently had a 33.4% correction off of all time highs, and is showing signs of recovery, back over all key MAs.
- SE also recently put in a higher low and higher high, and reclaimed the 20 & 50-day moving averages. These are all constructive developments.
- 210-230 has moved up as a key support range on any pullbacks and over 290 could signal a breakout.
- SE was also our Chart of the Week on 12/20/20 and is +25.9% since then. https://bluechipdaily.com/blue-chip-daily-chart-of-the-week-se-1220/
Have a great week,
Larry Tentarelli
Publisher
Disclaimer – Blue Chip Daily Trend Report