12/06/20
Blue Chip Daily Chart of the Week:
Qualcomm, QCOM
Close: 157.62
Stop level for position traders and investors: 132.67 (below the rising 50-day moving average)
please see chart analysis below
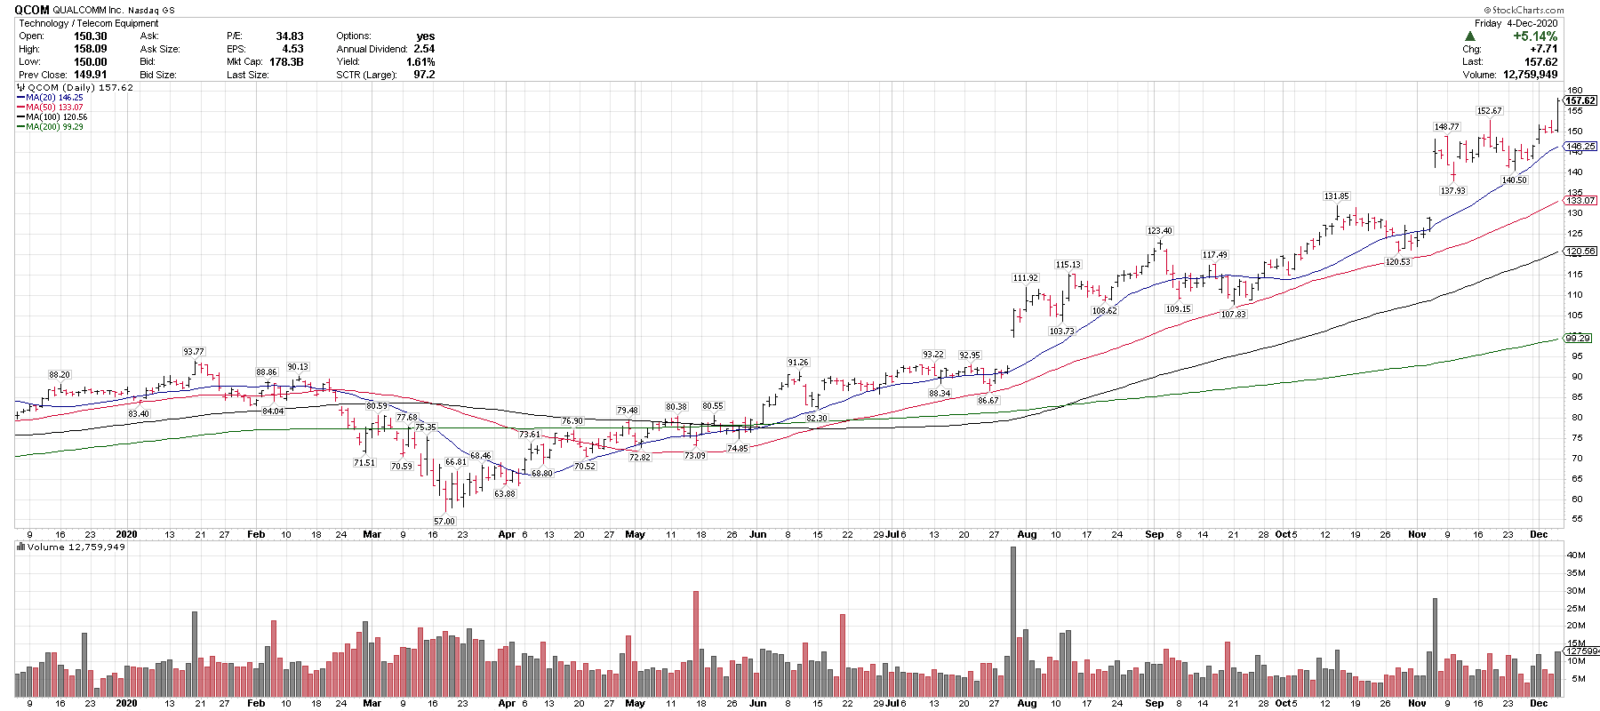
- Qualcomm (QCOM) continues to be one of our top technical ideas coming into the week.
- QCOM broke out on Friday to new all time highs, a bullish price signal.
- QCOM is trading above all key rising MAs and has had no closes below the 50-sma since April 2020.
- $135 and $150 are key levels on any pullbacks.
- The rising 50-sma is a key longer term trend gauge here.
- While markets can always pullback at any time, QCOM recent breakout is a bullish longer term technical signal.
Disclosures:
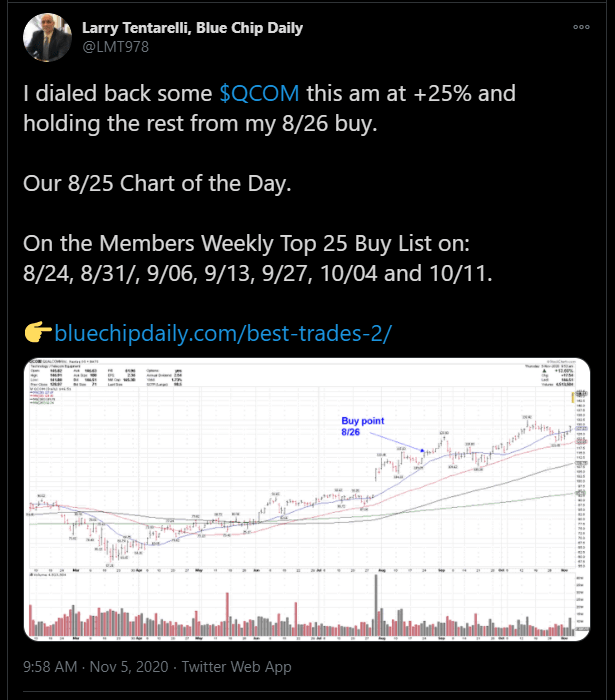
- I am long QCOM from 8/26/20 at $115.59, as shared with our Members in real-time.
- QCOM went onto our Chart of the Day Buy List as well on 8/25/20 and 12/03 20.
- QCOM has been on our Members Weekly Top 25 buy list recently, on 9/06, 9/13, 9/27, 10/04, 10/11, 11/22/ 11/29 and today as well.
Join us now to get trade signals like this daily, before they break out, and to get immediate access to my Weekly Top 25 Stocks Buy List, published today. https://bluechipdaily.com/join-blue-chip-daily/
See our best performing recent trade alerts for Members:
2020 Best Trade Alerts – Blue Chip Daily Trend Report
Updated performance tab:
Blue Chip Daily Delivers High Performance Results – Blue Chip Daily Trend Report
Have a great week,
Larry Tentarelli
Publisher