07/12/20
Blue Chip Daily Chart of the Week:
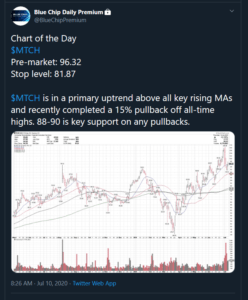
Match Group, MTCH
Close: $100.39
Stop level for position traders and investors: $86.74
please see chart analysis below
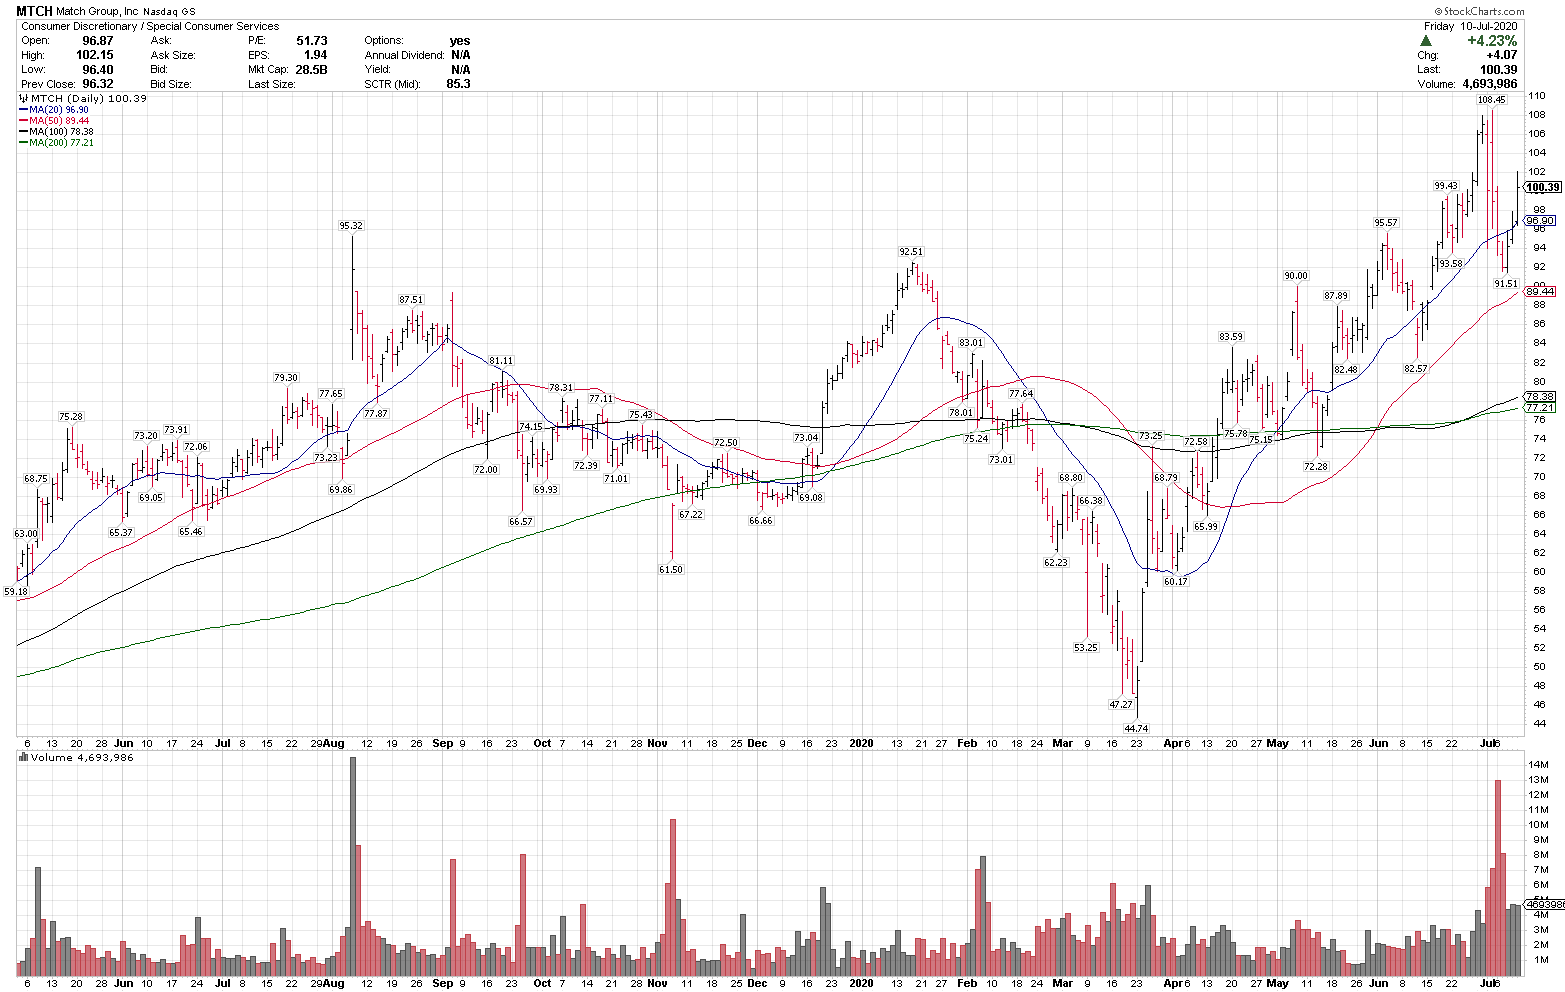 – MTCH is in a primary uptrend, above the rising 20, 50 100 and 200-day moving averages.
– The rising moving averages indicate a strong uptrend on multiple time frames.
– The stock recently consolidated 15.6% off all-time highs and held above the rising 50-sma, a sign of an intermediate term uptrend as well.
– MTCH is on our newly published Top 20 Weekly Best Stock Ideas List this week for our subscribers.
– $90-$92 is a key level on any pullbacks.
– MTCH was posted as our Members Chart of the Day on Friday morning as well. (please see below)
12 of the 16 Blue Chip Daily current open positions, shared with our Subscribers in real-time, made new all-time highs last week. Please see our latest position update blog and video here:
https://bluechipdaily.com/open-positions-update-7-06-2020/
Have a great week,
Larry Tentarelli
Publisher