02/7/21
Blue Chip Daily Chart of the Week:
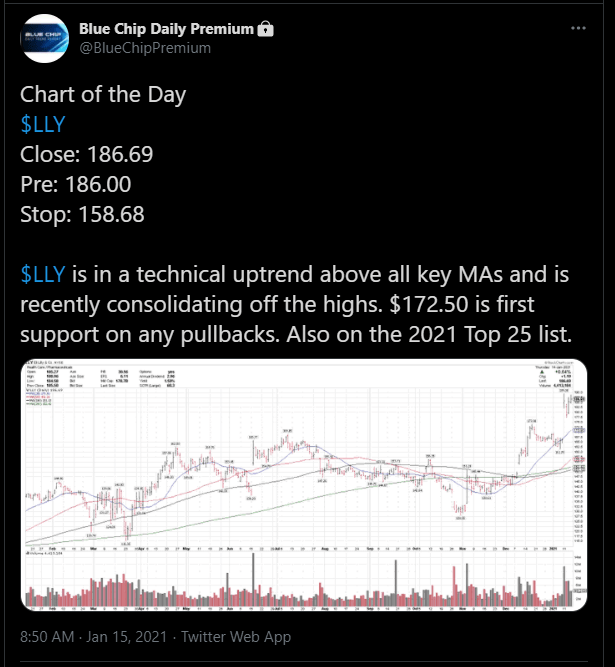
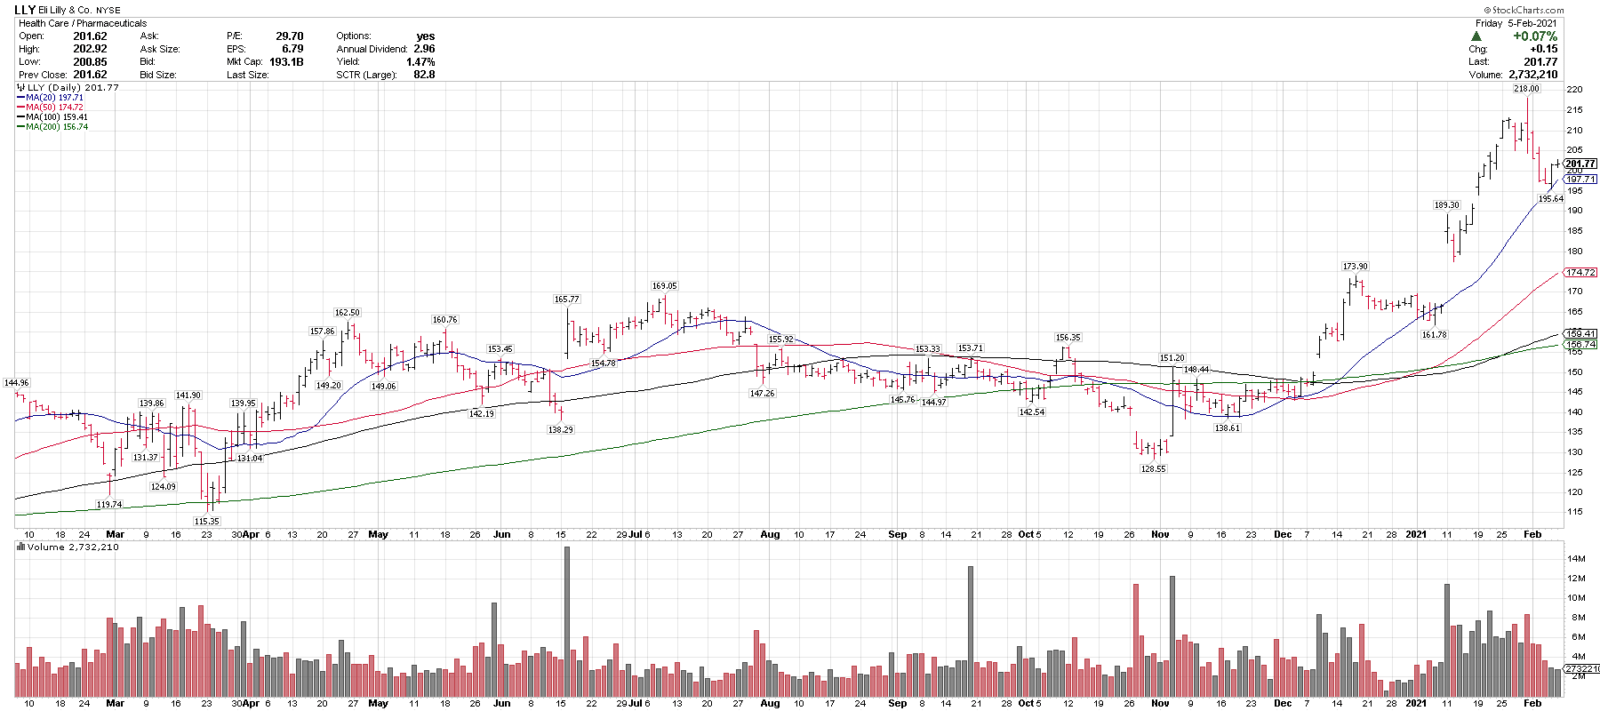
Eli Lilly, LLY
Close: 201.77
Stop level for position traders and investors: 169.48
please see chart analysis below
- Eli Lilly (LLY) is one of our top technical ideas coming into the week and is on today’s Members Top 25 List.
- LLY is in a technical uptrend above the rising 20, 50, 100 and 200-day moving averages, indicating an uptrend on multiple time frames.
- LLY recently pulled back 10.2% off of all-time highs and held at the rising 20-day moving average, a bullish technical signal.
- $190 and $175 are key support levels on any pullback.
- LLY went onto our Chart of the Day Buy List on 1/15/21, before the recent breakout and is on this week’s Top 25 list as well. (please see the screenshot below)
- LLY is our #2 ranked large cap healthcare stock coming into this week. Join us now to see our #1 ranked health care stock, which we started a new long position in last week. https://bluechipdaily.com/join-blue-chip-daily/
- Last week, all 24 stocks on our Weekly Mid Cap Best Ideas List were up on the week and 24 of 25 from our Weekly Large Cap Top 25 list. Read more here: https://bluechipdaily.com/jan-31-outperformance/
- Our Top Performers page: https://bluechipdaily.com/top-performers/
Have a great week,
Larry Tentarelli
Publisher
Disclaimer – Blue Chip Daily Trend Report