04/11/21
Blue Chip Daily Chart of the Week:
Etsy Inc., (ETSY)
Close: 218.57
Stop level for position traders and investors: 178.72 (wider than average, due to recent volatility in this stock)
please see chart analysis below
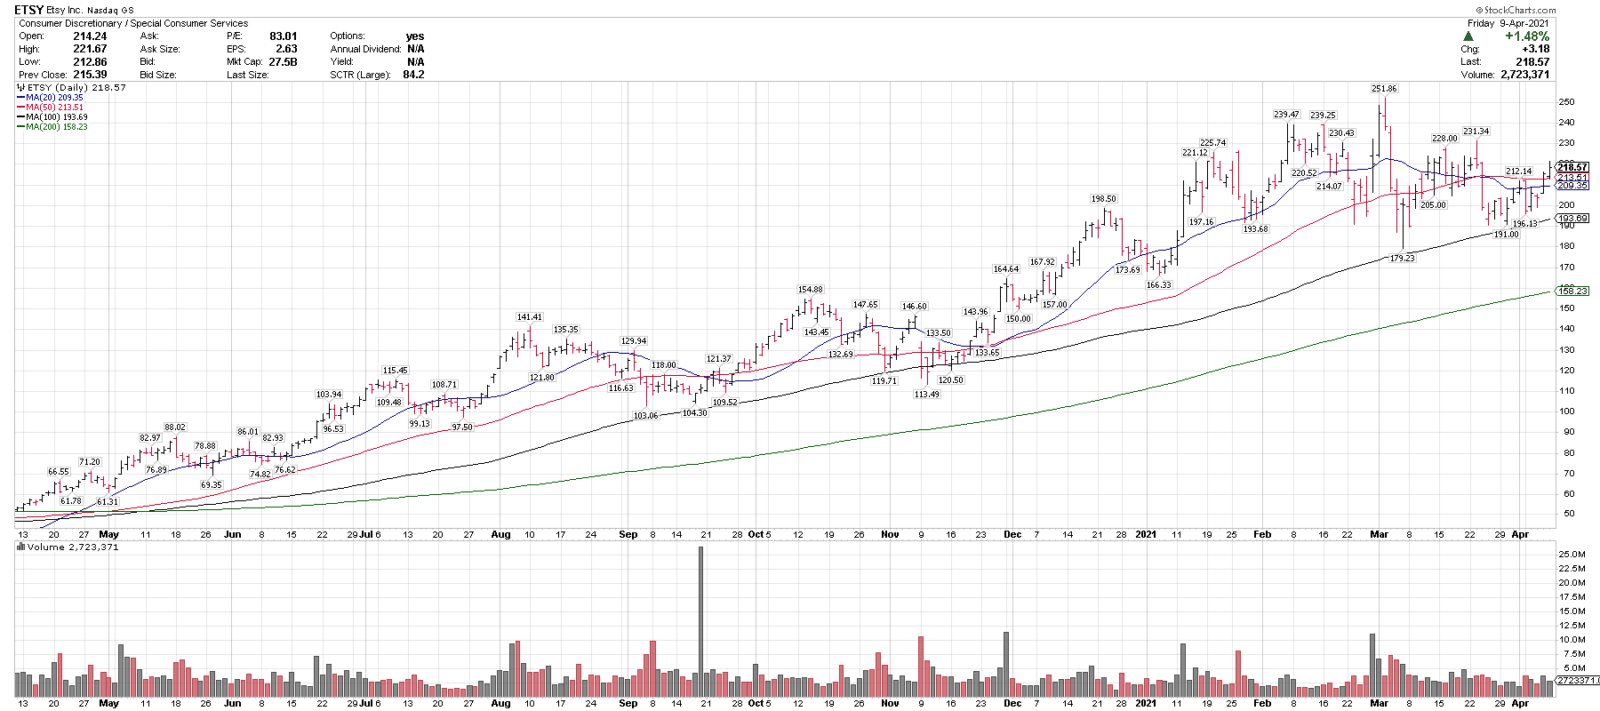
- Etsy Inc., (ETSY) is one of our top technical ideas coming into the week, was our Member’s Chart of the Day last Friday and is on this week’s Members Top 25 Stocks List.
- ETSY is currently trading over the 20, 50, 100 & 200-day moving averages.
- ETSY recently had a very sharp 28.8% correction and is showing signs of trying to build a base and recover.
- ETSY recently put in two higher lows vs the early March low, and reclaimed the 20 & 50-day moving averages. These are all constructive developments.
- 190-200 is key support and over 240 could signal a breakout.
- Key Note: ETSY is considered a high growth stock and can be more volatile.
- Disclosure: I am currently long ETSY from 12/7/20.
Have a great week,
Larry Tentarelli
Publisher
Disclaimer – Blue Chip Daily Trend Report