11/15/20
Blue Chip Daily Chart of the Week:
Ericsson, ERIC
Close: 11.88
Stop level for position traders and investors: $9.97
please see chart analysis below
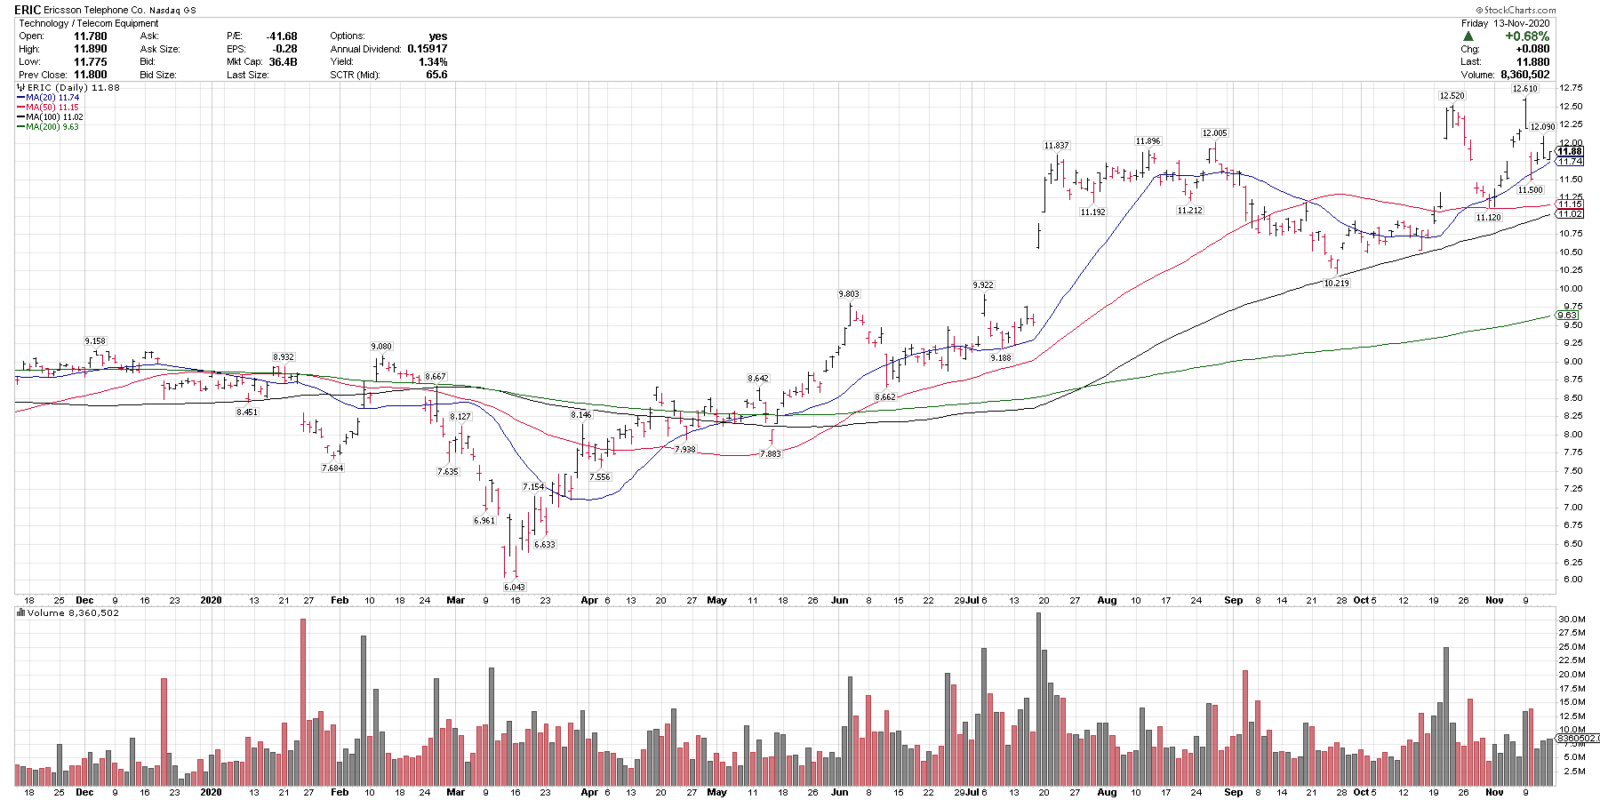
- ERIC is in a technical uptrend above all key rising MAs, indicating an uptrend on multiple time frames.
- ERIC tested a 9-year high last week, before pulling back 8.8% into the rising 20-day moving average.
- $10.50 – $11.00 is key technical support on any pullbacks.
- A close over $12.50 – $13.00 could signal a new leg higher.
- ERIC went onto our Members Chart of the Day Buy List on 11/04 and is on this week’s Top 25 Buy list as well.
Join us now to get trade signals like this daily, before they break out, and to get immediate access to my Weekly Top 25 Stocks Buy List, published today. https://bluechipdaily.com/join-blue-chip-daily/
See more top performing Buy List alerts here:
https://bluechipdaily.com/best-trades-2/
https://bluechipdaily.com/performance/
Have a great week,
Larry Tentarelli
Publisher