06/28/20
Blue Chip Daily Chart of the Week:
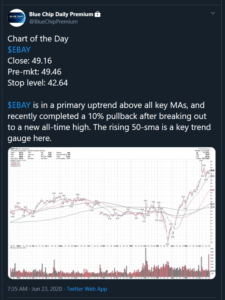
Ebay, Inc. EBAY
Close: $50.89
Stop levels:
Position traders and investors: 43.75, below the rising 50-dma.
Shorter-term traders: 46.38
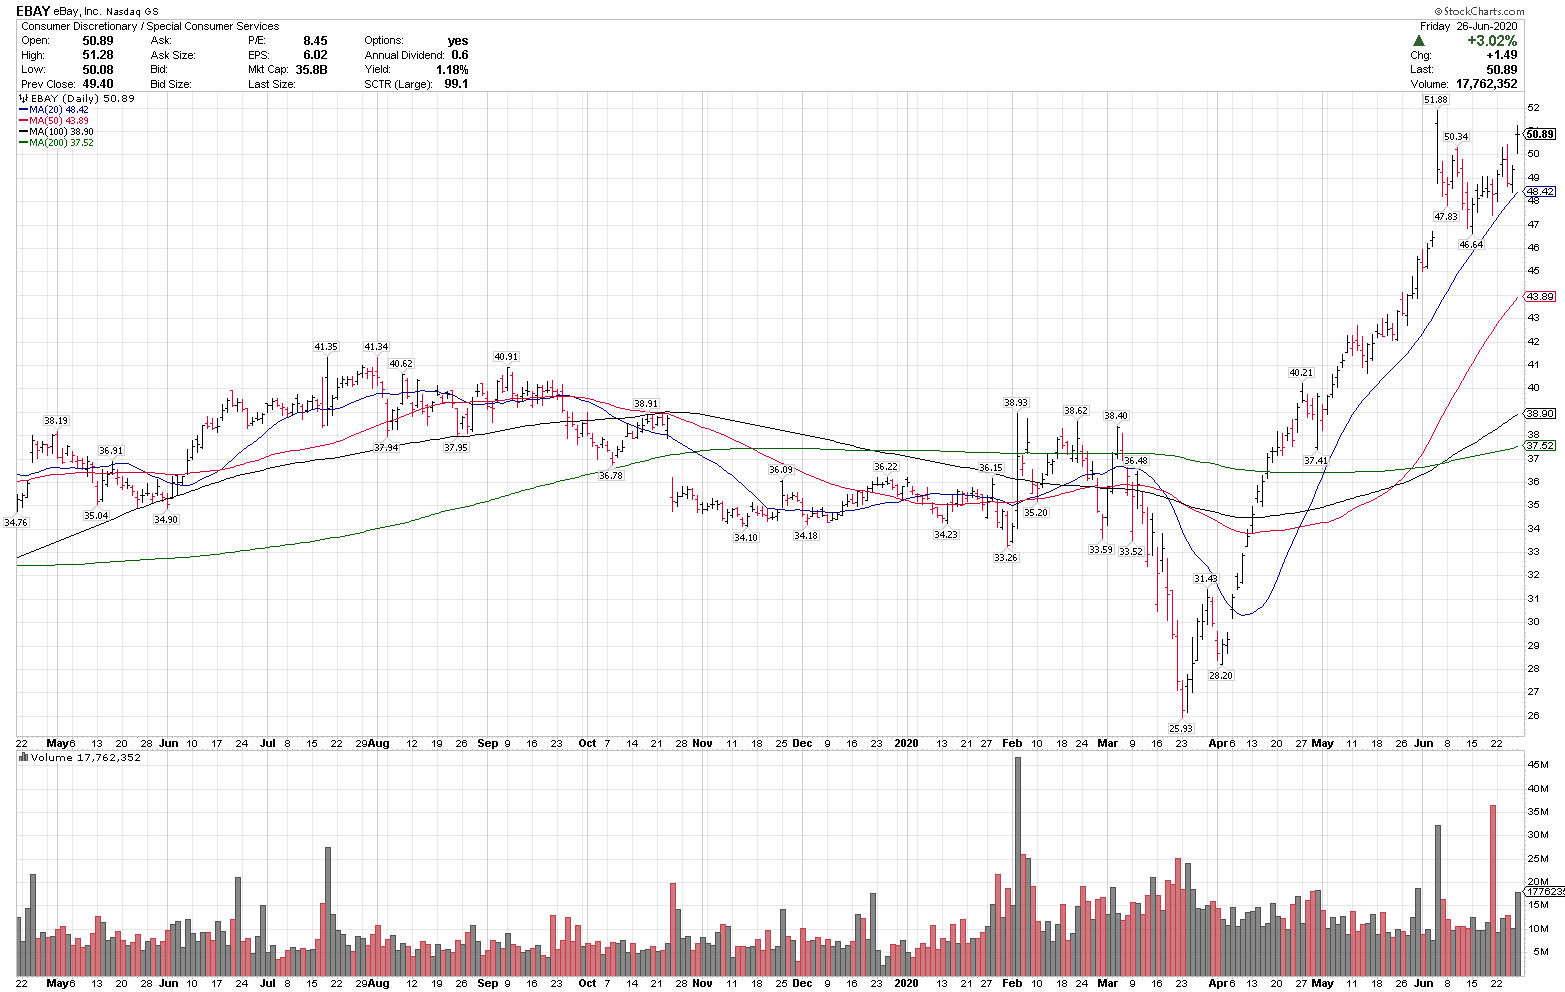
– EBAY is in a strong uptrend above all key rising moving averages, and recently corrected 10% after making a new all-time high.
– The rising moving averages indicate a strong uptrend on multiple time frames.
– The stock recently consolidated and moved higher off the rising 20-dma, a sign of a short term uptrend as well.
– EBAY has outperformed YTD and was up Friday in a weak tape, a sign of relative strength and demand.
– EBAY is on our newly published Top 20 Weekly Best Stock Ideas List this week for our subscribers and was our Chart of the Day best idea on 6/23 at 49.16.
Yesterday, I sent to our Members a Market Trend Update Blog & Video, with my detailed overview of the S&P 500, and Nasdaq 100, with key support levels as well as an updated risk management and volatility management blog.
If volatility, or selling pressure picks up this week, we already have an outlined plan in place.
Here is a video and blog of our Top Market Trend Alerts in 2020 so far: https://bluechipdaily.com/top-techincal-alerts-2020/
YouTube video: https://youtu.be/Klky0VNLT-I
Our updated Recent Best Trades Alerts and Open positions page: https://bluechipdaily.com/best-trades-2/
Have a great week,
Larry Tentarelli
Publisher
https://bluechipdaily.com/disclaimer/