9/13/20
Blue Chip Daily Chart of the Week:
DR HORTON, DHI
Close: $71.39
Stop level for position traders and investors: $62.72
please see chart analysis below
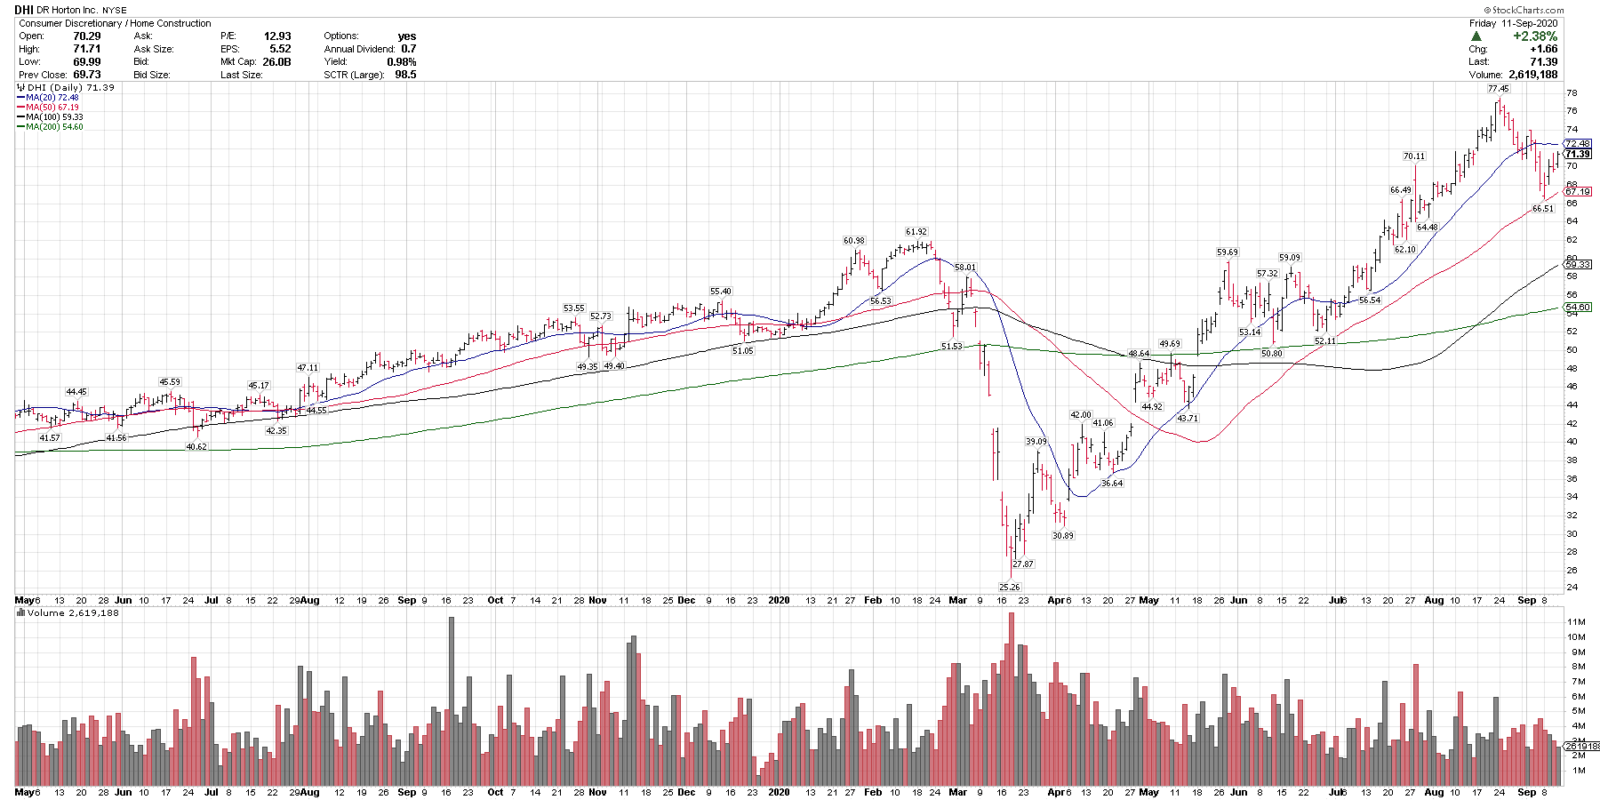
- DHI is in a technical uptrend, above the rising 50, 100 and 200-day moving averages, indicating an uptrend on multiple time frames.
- DHI recently corrected 14.1% off all time highs and held the rising 50-sma test, a bullish signal.
- The rising 50-sma below is a key trend gauge.
- DHI was +4.63% on the week, vs $SPX at -2.51% for the week, showing improving relative strength in a weaker market.
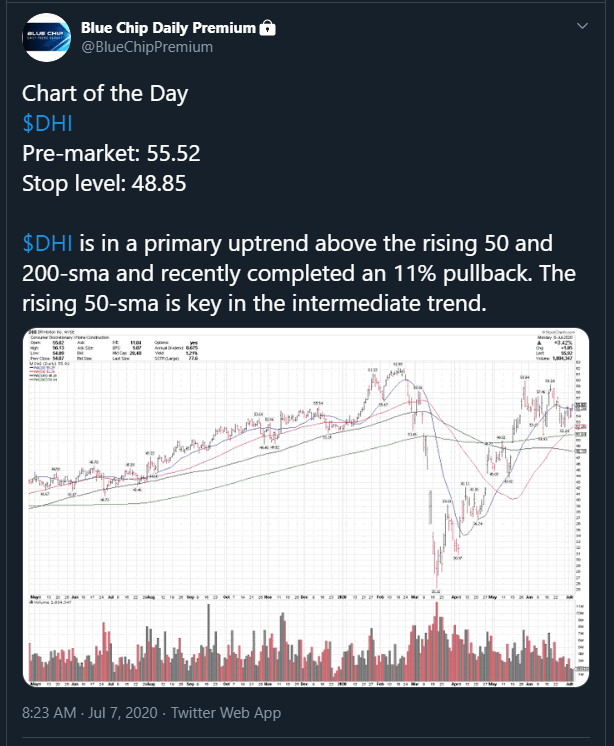
- DHI went onto our Chart of the Day Buy List on 7/07/02 at $55.72 and is +28% since then.
- DHI is also on this week’s Top 25 Buy List, just published this morning.
- Disclosure: I am currently long DHI from lower.
- Join us today to get immediate access to my top stock ideas in this space. https://bluechipdaily.com/join-blue-chip-daily/
Have a great week,
Larry Tentarelli
Publisher