11/08/20
Blue Chip Daily Chart of the Week:
Alibaba, BABA
Close: 299.95
Stop level for position traders and investors: $254.95
please see chart analysis below
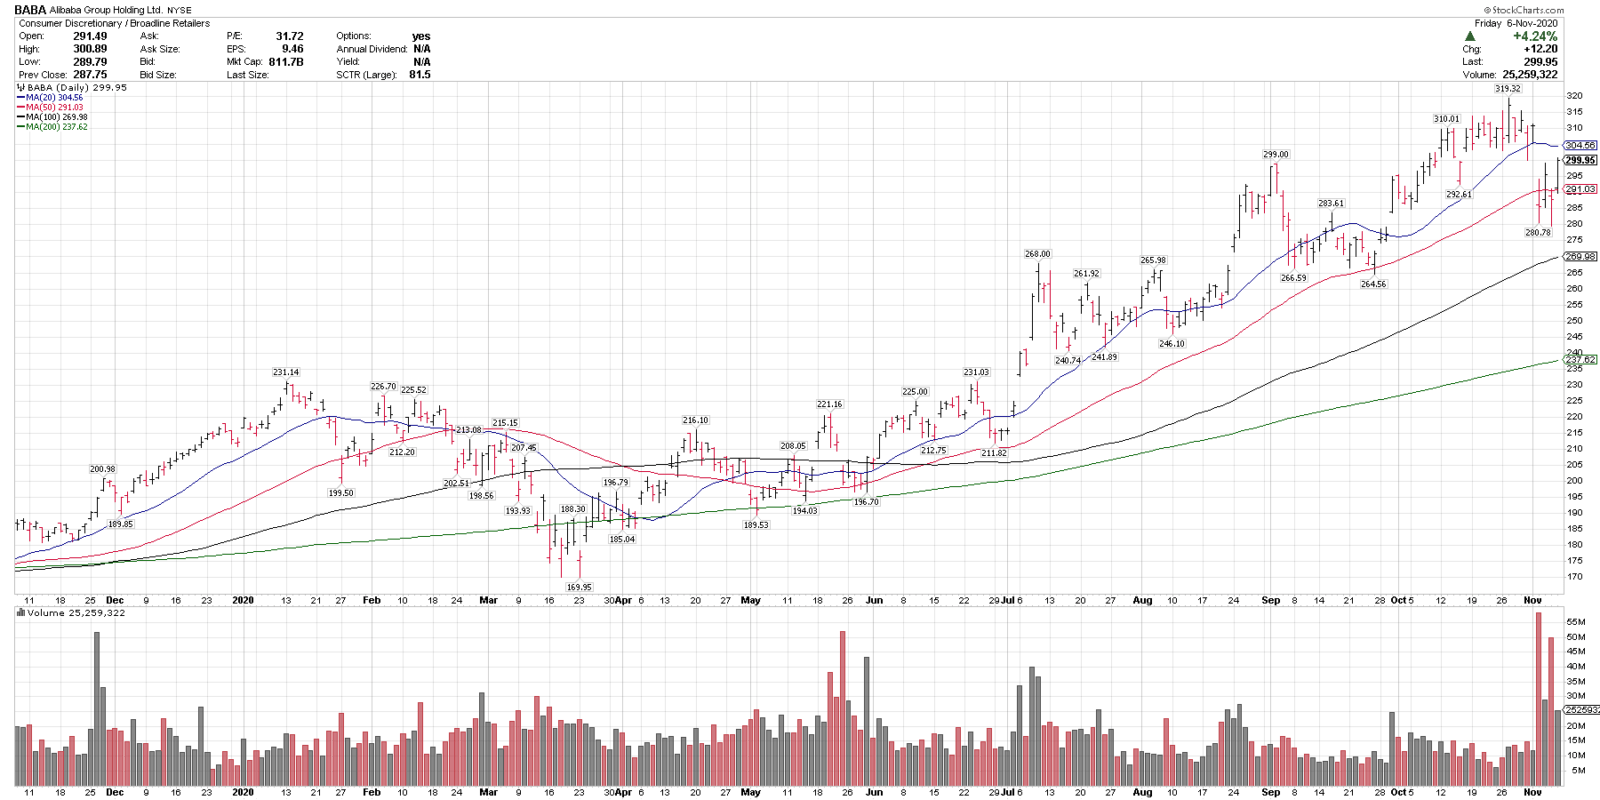
- Alibaba, BABA, is in a technical uptrend above the rising 50, 100 and 200-day moving averages, indicating an uptrend on multiple time frames.
- BABA is a dominant, market cap leader in the China internet sector, one of our top ranked industry groups.
- BABA recently corrected 12% off all-time highs and held it’s September breakout level at $280.
- $260-265 is key intermediate term support on any pullbacks.
- BABA was our Members Chart of the Day on Friday morning, from $287.75.
- BABA is on this week’s Top 25 Buy List, published today, and was on for 7 consecutive weeks, from 9/06 – 10/18/20.
- Disclosure: I am currently long BABA from 4/23/20 at $209.41.

Join us now to get trade signals like this daily, before they break out, and to get immediate access to my Weekly Top 25 Stocks Buy List, published today. https://bluechipdaily.com/join-blue-chip-daily/
See more top performing Buy List alerts here:
https://bluechipdaily.com/best-trades-2/
https://bluechipdaily.com/performance/
Have a great week,
Larry Tentarelli
Publisher