10/18/20
Blue Chip Daily Chart of the Week:
Ally Financial, ALLY
Close: $28.63
Stop level for position traders and investors: $24.34
please see chart analysis below
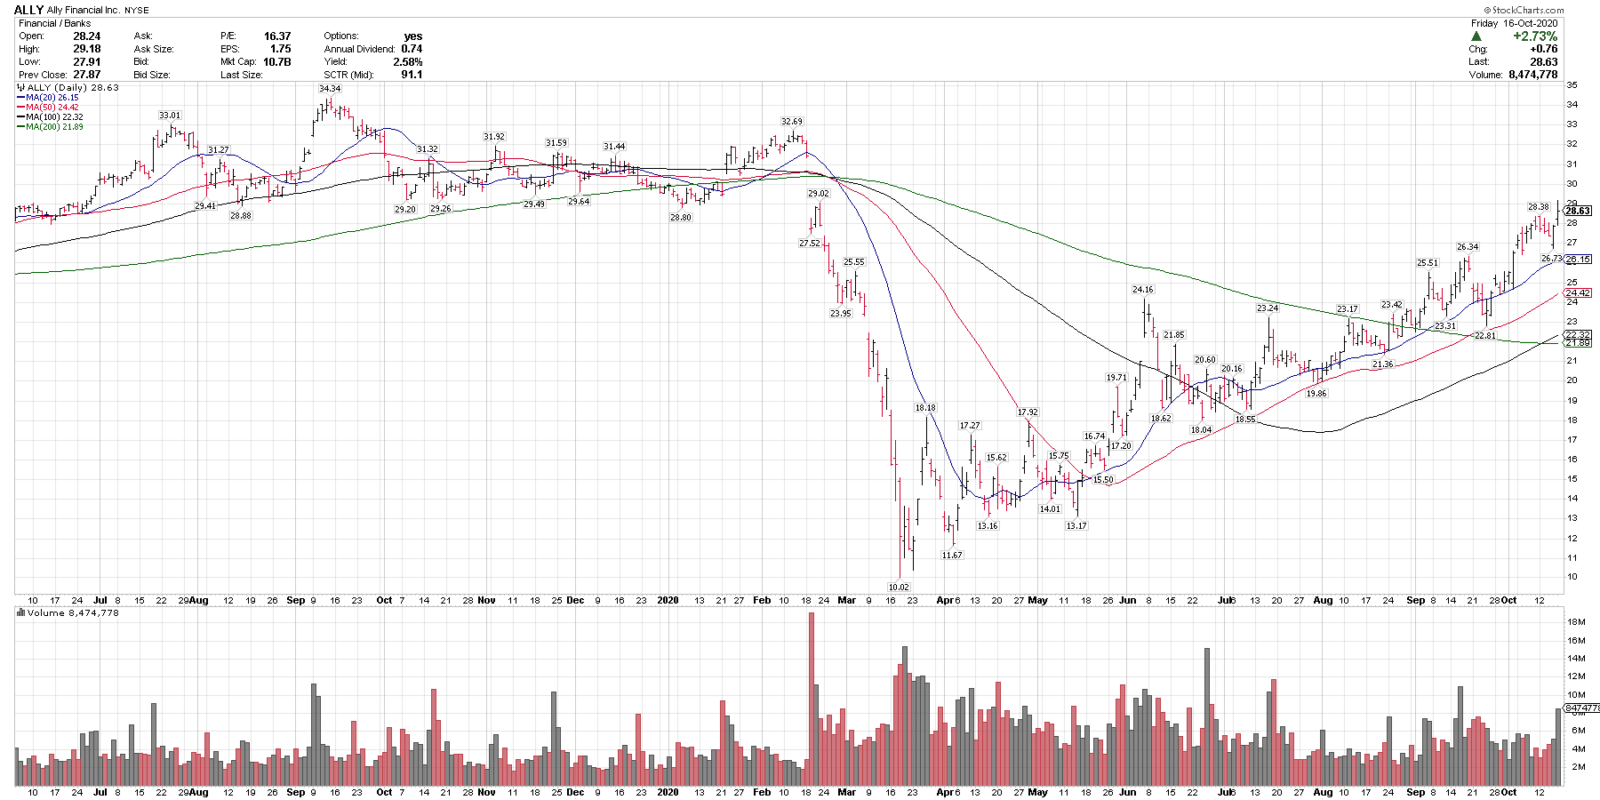
- Ally Financial, ALLY, is in a technical uptrend, with a series of higher highs and higher lows, above the rising 20, 50, & 100-day moving averages, and over the 200-dma, which is starting to flatten out, indicating an uptrend on multiple time frames.
- ALLY recently corrected 13.4% and held into the rising 50-sma, a bullish signal.
- ALLY closed near 8-month highs on Friday, after posting their earnings report.
- On any pullbacks, $26 and the rising 50-dma are key support levels.
- ALLY went onto our Chart of the Day Buy List for Members on 8/28 and is +23% since then.
- ALLY is on this week’s Top 25 Buy list and has also been on our Weekly Buy List on 8/31, 9/06, 9/13, 9/27 and 10/04.
Join us now to get trade signals like this daily, before they break out, and to get immediate access to my Weekly Top 25 Stocks Buy List, published today. https://bluechipdaily.com/join-blue-chip-daily/
See my updated Top 5 open positions here and recent best Buy list alerts for Members.
https://bluechipdaily.com/performance/
Have a great week,
Larry Tentarelli
Publisher