08/23/20
Blue Chip Daily Chart of the Week:
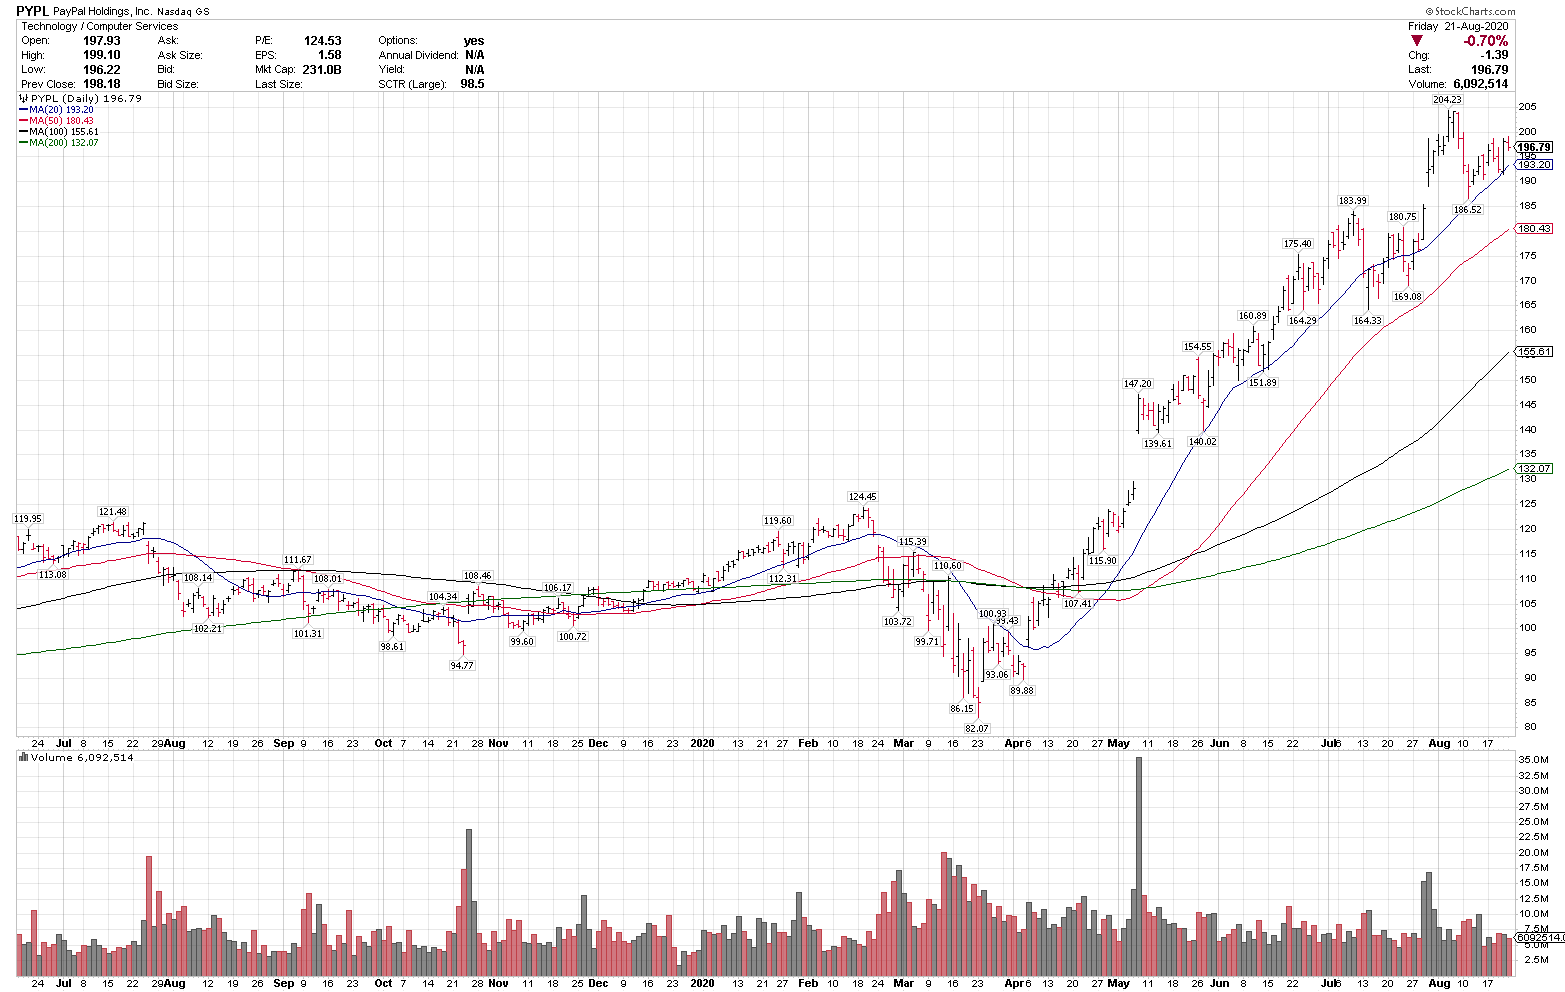
PayPal Holdings, PYPL
Close: $196.79
Stop level for position traders and investors: $168.27
please see chart analysis below
- PayPal, PYPL, is a dominant global leader in the fast growing Fin Tech industry.
- PYPL is one of the strongest stocks on our screen and one of our top intermediate to longer-term technical ideas here.
- PYPL is in a technical uptrend above the rising 20, 50, and 100 day moving averages, indicating a strong uptrend on multiple time frames.
- PYPL recently corrected 8.6% from all time highs and held the rising 20-day moving average, a strong technical signal.
- PayPal has not tested the rising 50-day moving average since reclaiming in in early April, a sign of a very strong uptrend as well.
- On any pullbacks, over $185 is a key support level.
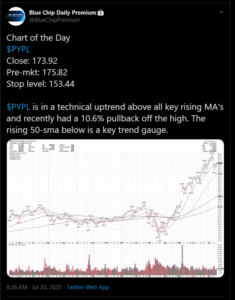
- PYPL is on this week’s Blue Chip Daily Top 25 Buy List, and was our Chart of the Day for subscribers on July 20 at $173.92, and is currently +13.15% since then.
- It is still one of our top intermediate to longer-term technical ideas here.
Blue Chip Daily Subscribers are making consistently exceptional gains in this market, in high quality names. See why you should join today: https://bluechipdaily.com/5-reasons-to-subscribe-to-blue-chip-daily-trend-report/
Have a great week,
Larry Tentarelli
Publisher