08/16/20
Blue Chip Daily Chart of the Week:
Halliburton, HAL
Close: $16.63
Stop level for position traders and investors: $14.13
please see chart analysis below
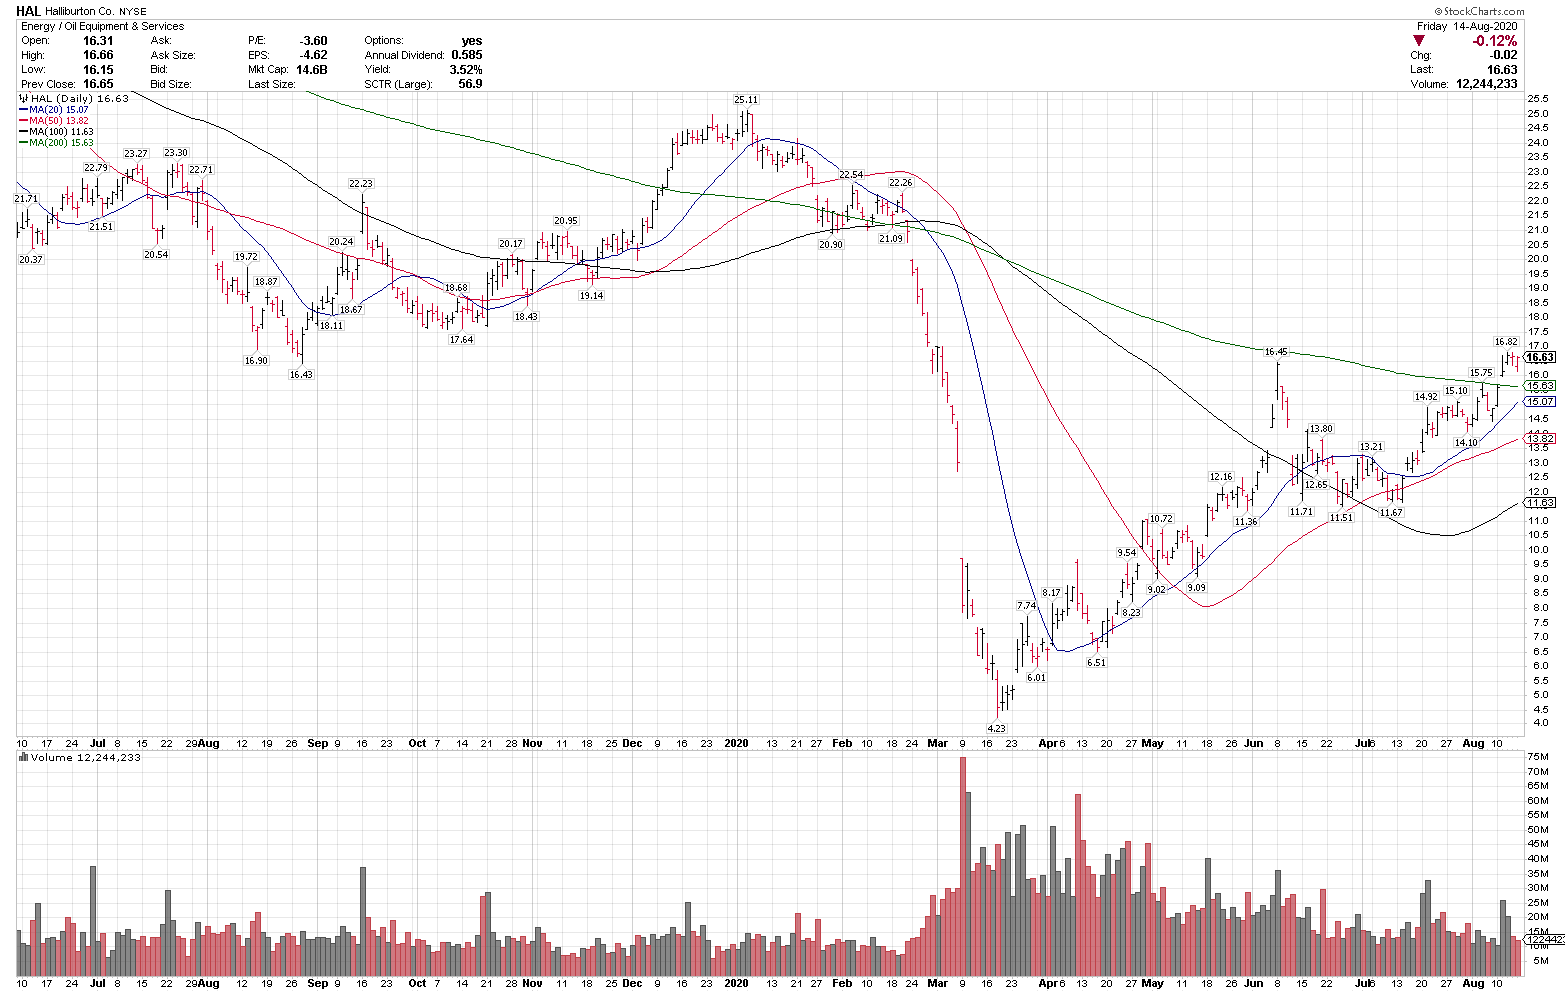
- HAL is one of our top intermediate to longer-term ideas here and is in a technical uptrend above the rising 20, 50, and 100 day moving averages, indicating a strong uptrend on multiple time frames.
- HAL reclaimed the 200-day moving average this week, a key longer-term trend signal.
- HAL had it’s highest weekly close on Friday since mid-February, indicating improving price momentum as well.
- HAL has recently broke out over $15 and $16 in the last few weeks, and is showing improving Relative Strength.
- On any pullbacks, over $15 keeps this intermediate term uptrend intact and we believe the chart offers favorable longer-term reward vs risk here.
- HAL was one of the 10 Stocks on our Members Only Top 10 200-Day Moving Average Recovery Ideas Blog and Video, published last Sunday, and was +11% on the week. https://bluechipdaily.com/august-2020-200-dma-recovery-ideas/
- HAL was our Chart of the Day best idea on 8/11/20 at $15.91, and on our Top 20 Best Ideas list on 7/05/20 at $12.57.
Have a great week,
Larry Tentarelli
Publisher