5/16/21
Blue Chip Daily Chart of the Week:
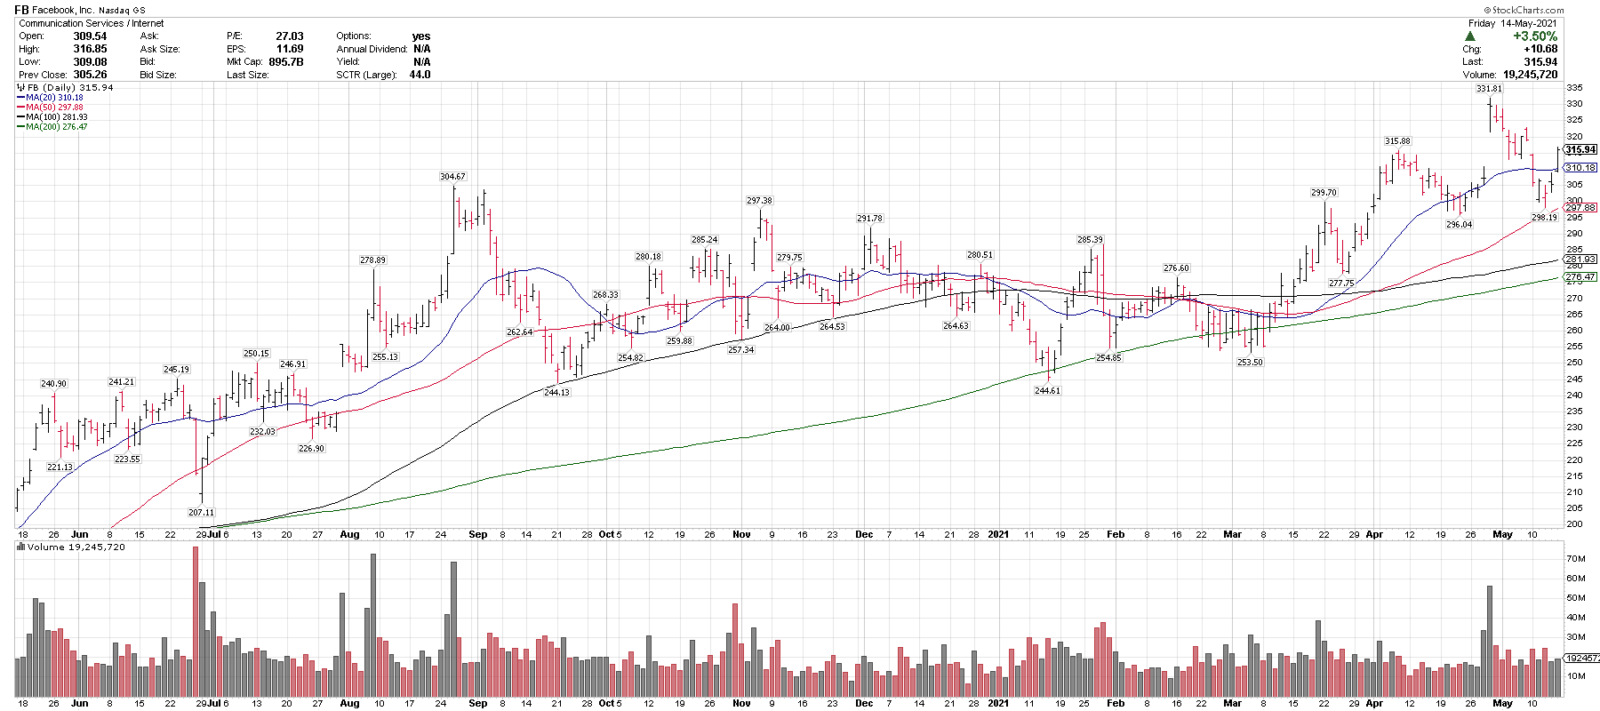
Facebook (FB)
Close: 315.94
Stop level for position traders and investors: 268.54
please see chart analysis below
*Please see the important note below regarding QQQ.
- Facebook (FB) is one of our top technical ideas coming into the week, and is on this week’s Members Top 25 Stocks List.
- FB is currently trading over rising 20, 50, 100 & 200-day moving averages, indicating an uptrend on multiple time frames.
- FB recently pulled back 10.1% from new highs highs, held above the 50-sma and reclaimed the 20-sma as well.
- FB has put in a consistent series of higher highs and higher lows, indicating a strong uptrend and recently made a new all-time high.
- 295 is a key support level and over 335 could signal a breakout higher.
- FB was our Members Chart of the Day on 4/16/21, before it broke out to new highs.
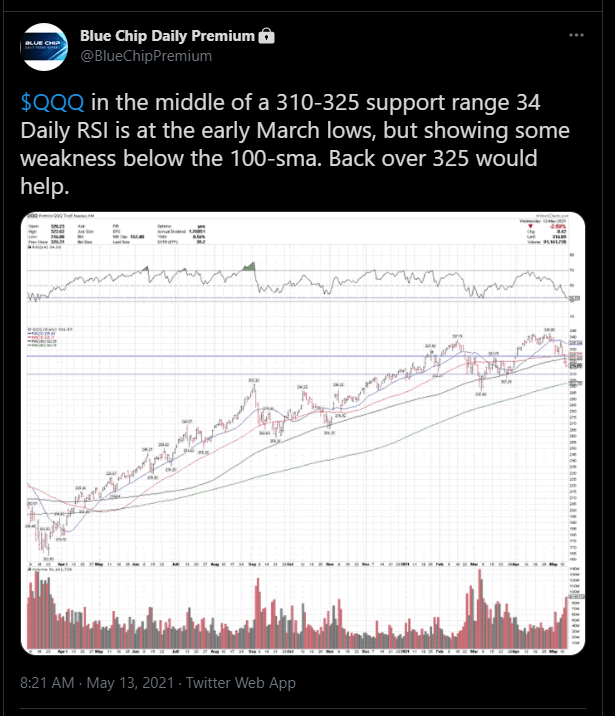
- *FB may be dependent on a rally in QQQ.
We shared with Blue Chip Daily Members the following 3 posts last week, before Friday’s recovery move, to show that a near term low ‘may’ be in for QQQ. Some upside follow through would help.
THURSDAY, 5/13/21, 8:21AM
89 cents off the low (316.89) for QQQ
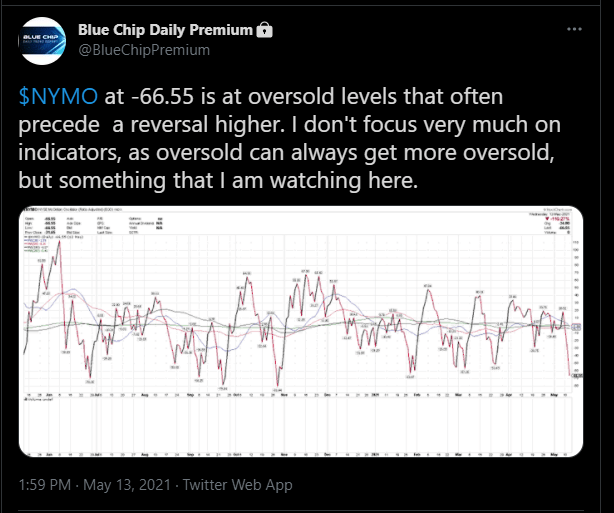
THURSDAY, 5/13/21, 1:59PM
This marked the low for NYMO, at 66.55
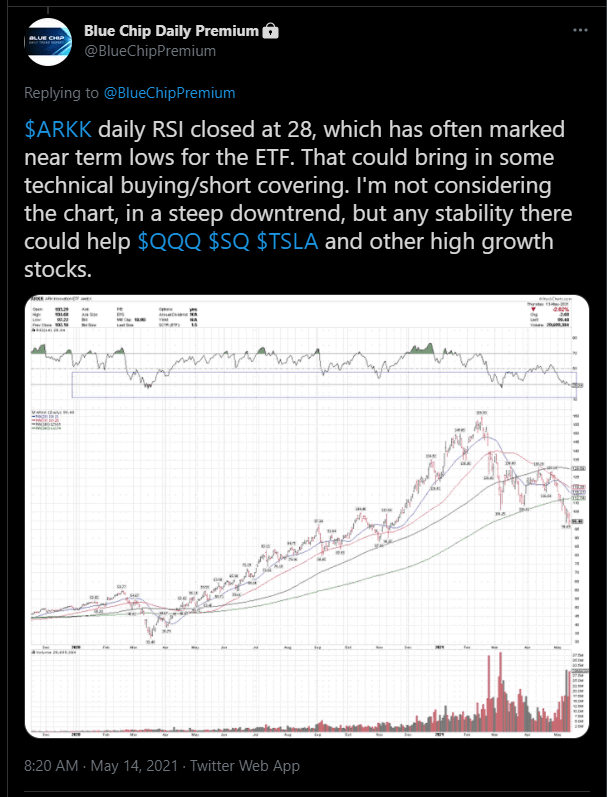
FRIDAY, 5/14/21, 8:20AM
ARKK +4.86% DAY
Have a great week,
Larry Tentarelli
Publisher
Disclaimer – Blue Chip Daily Trend Report