11/01/20
Blue Chip Daily Chart of the Week:
Arcelor Mittal, MT
Close: 13.60
Stop level for position traders and investors: $11.45
please see chart analysis below
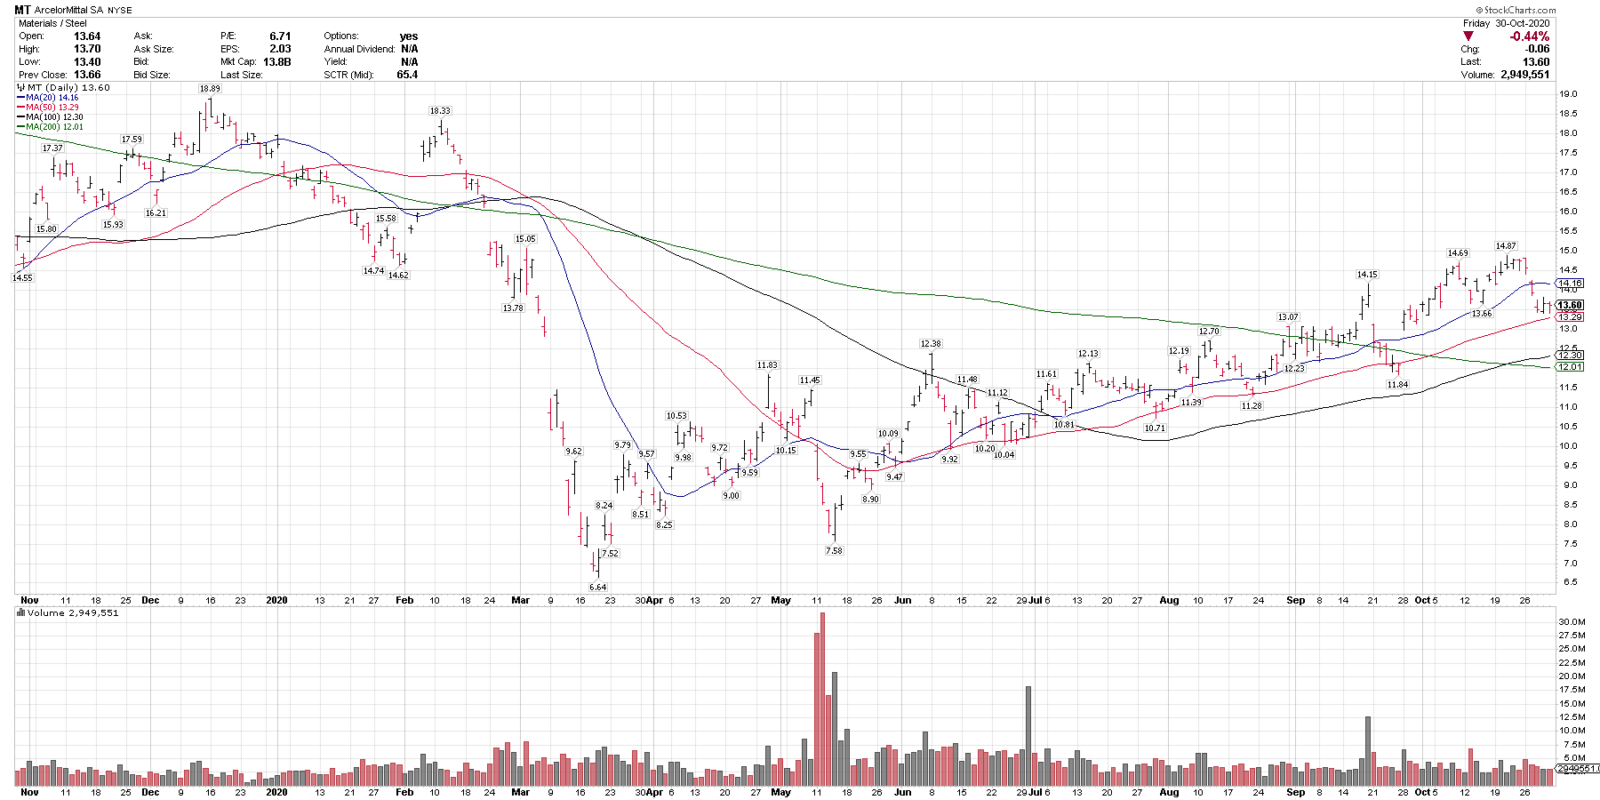
- ArcelorMittal, MT, is in a technical uptrend with a series of higher highs and higher lows, above the rising 50 and 100-day moving averages, and above the 200-sma as well, indicating an uptrend on multiple time frames.
- MT recently pulled back 9.8% off 6-month highs and is holding the rising 50-sma currently.
- On any pullbacks, $12.50 – 13.00 is a key support range, as well as the 200-sma near $12.
- We have been technically bullish on a cyclical recovery starting in April of this year and MT, one of the world’s largest steelmakers, fits into our cyclical recovery theme as well.
**Markets are pulling back here and volatility is very high. Any continued market pullback could have an effect on this chart and others.**
Join us now to get trade signals like this daily, before they break out, and to get immediate access to my Weekly Top 25 Stocks Buy List, published today. https://bluechipdaily.com/join-blue-chip-daily/
See more performance content and top technical alerts here:
https://bluechipdaily.com/performance/
Have a great week,
Larry Tentarelli
Publisher