THE LINK TO THE 15 MINUTE VIDEO IS HERE: https://zoom.us/rec/share/58Msc-n51ElJWtLizWbbQrU9Er6-X6a81SFI-acFyhkYchpJ6S45RG28YgCqAM6c?startTime=1579375271000
LINK TO THE ‘SHORT TO LONG 2018’ BLOG IS HERE: https://bluechipdaily.com/2020-still-max-long/
DISCLAIMER: https://bluechipdaily.com/disclaimer/
1/ This content of this Blog and Video has no opinions or predictions about future market moves.
2/ Pullbacks and reversals can and do happen at any time. The top could be today, in 5 days, 5 months or 5 years.
3/I use reactive technical analysis, not predictive. I know what gets me in and what gets me out, I don’t attempt to forecast when it will happen, but I have a plan for all outcomes.
HOW DO WE KNOW WHEN THE TOP IS IN OR WHAT’S COMING NEXT?
In real-time we don’t, in hindsight it looks easy, but it is not.
For me, profitable trading is comprised of a disciplined, consistent process, price-based technical signals, probabilities and risk management.
TECHNICAL SIGNALS THAT I LOOK FOR:
LOWER HIGHS AND LOWER LOWS
PRICE BREAKS BELOW KEY LEVELS AND MOVING AVERAGES
MAs ROLLING OVER
FAILED RALLIES
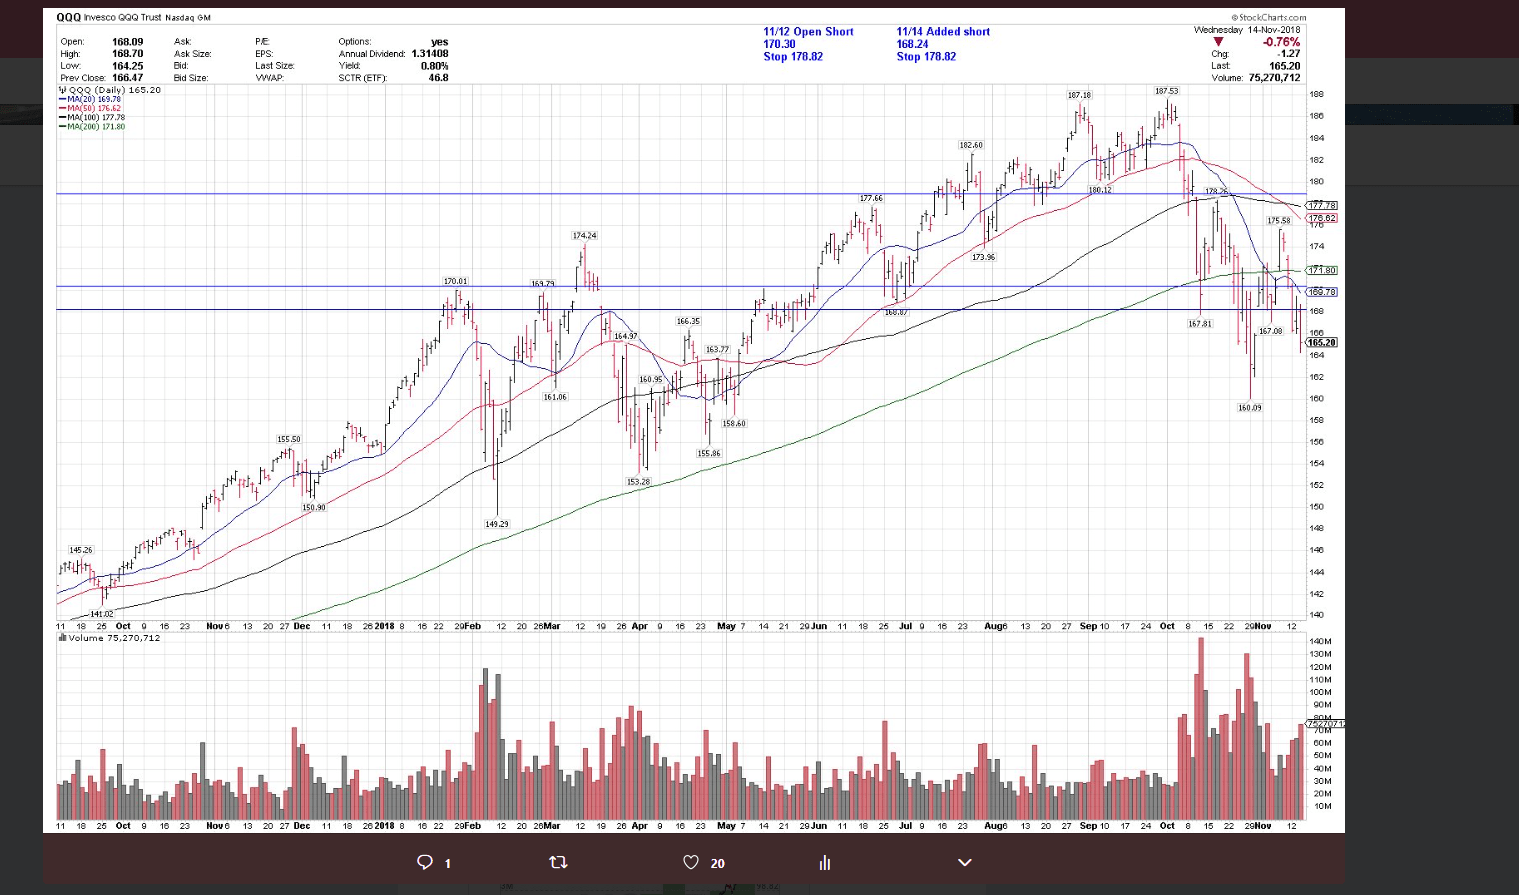
2018 $QQQ MAX SHORT
2018 $SPX
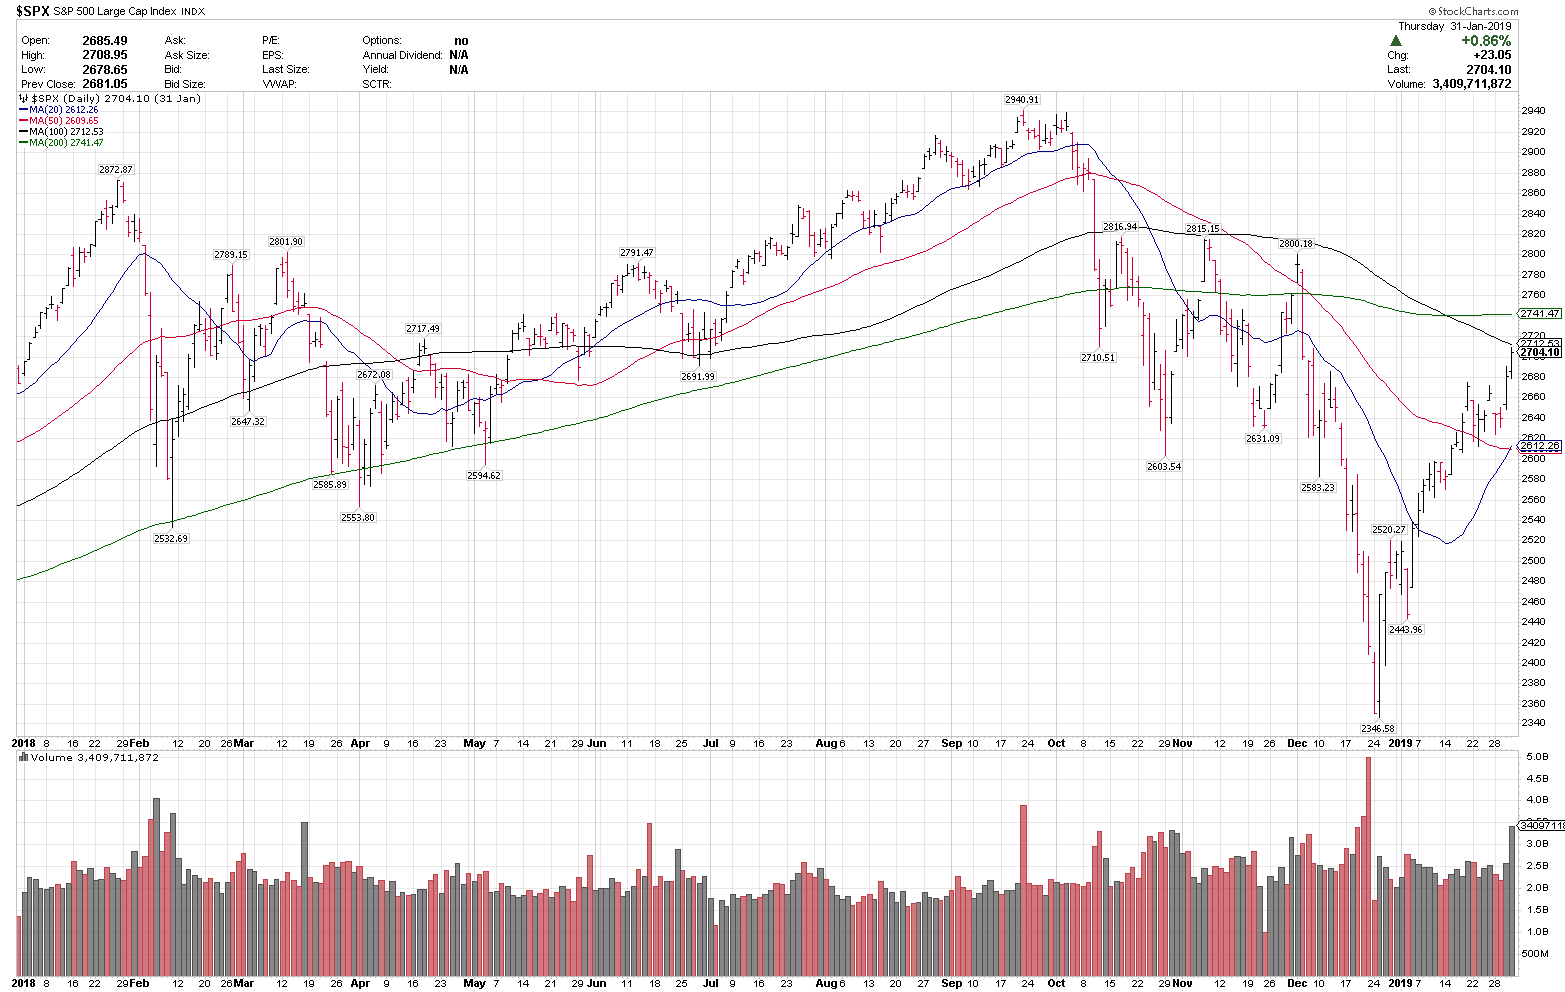
2020 $SPX

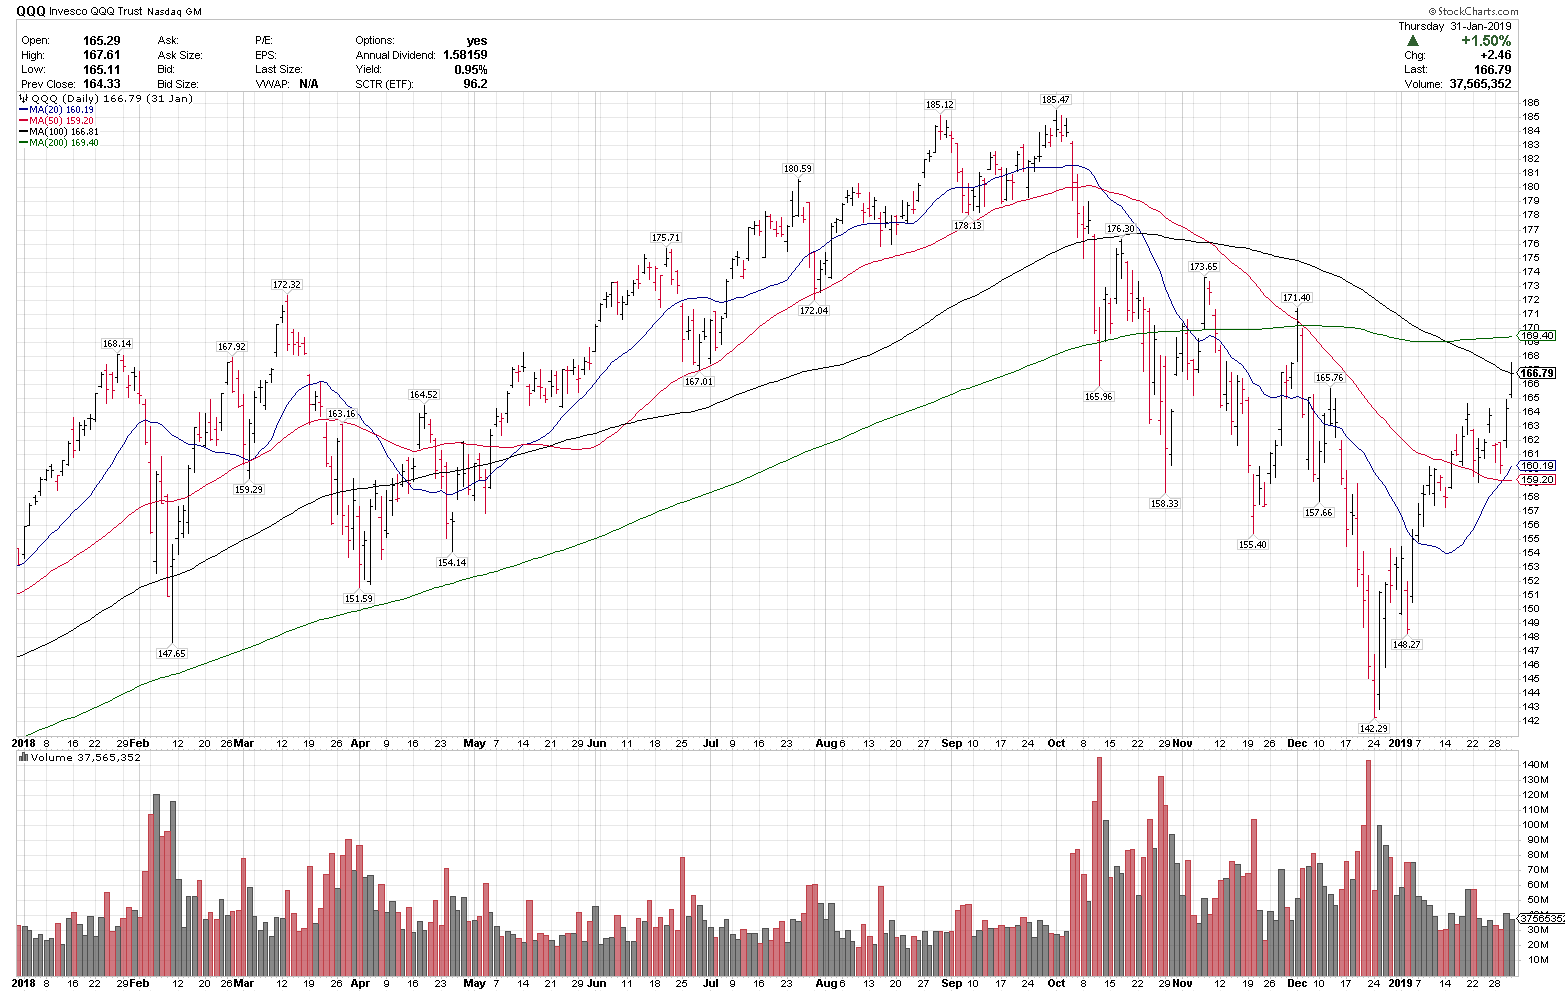
2018 $QQQ
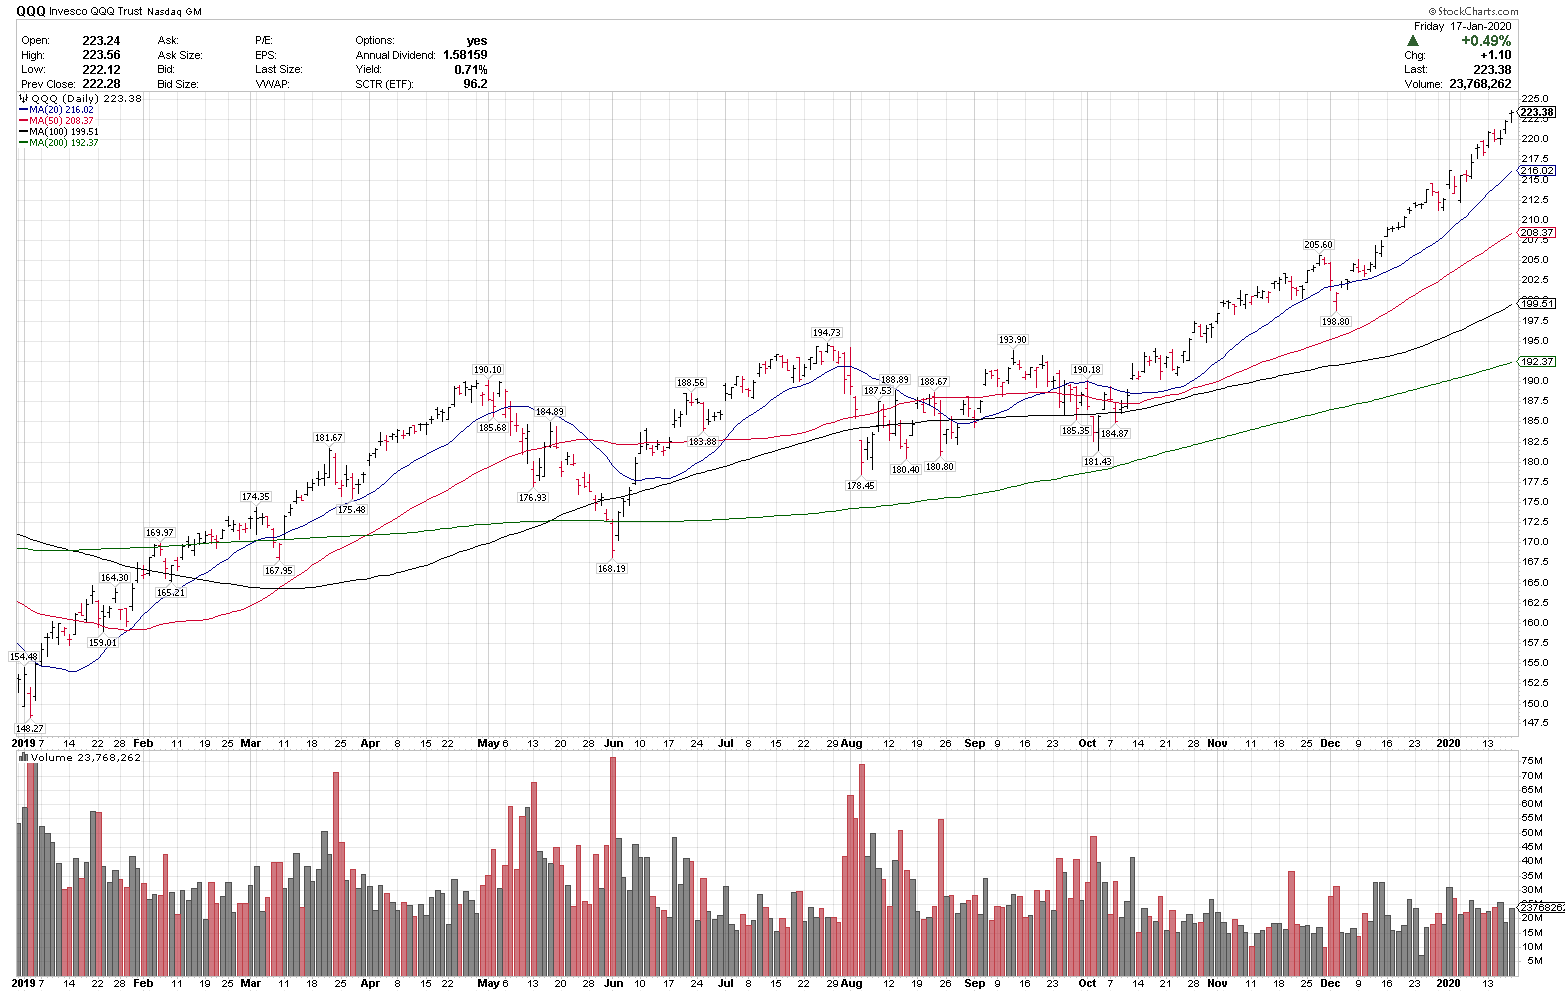
2020 $QQQ
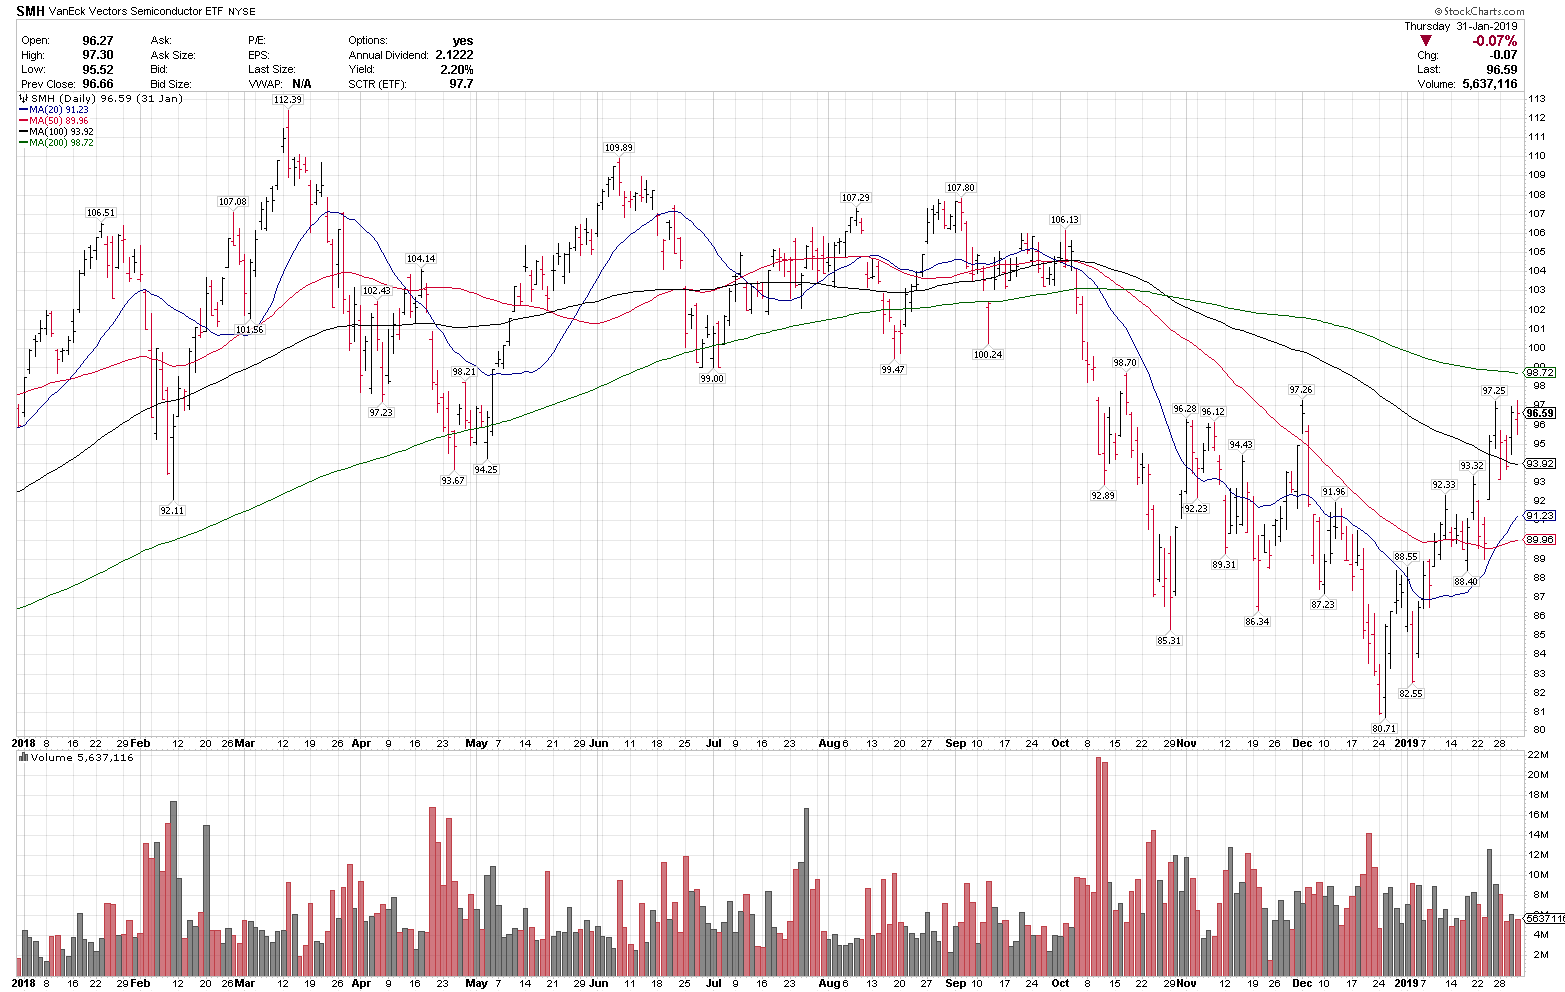
2018 $SMH
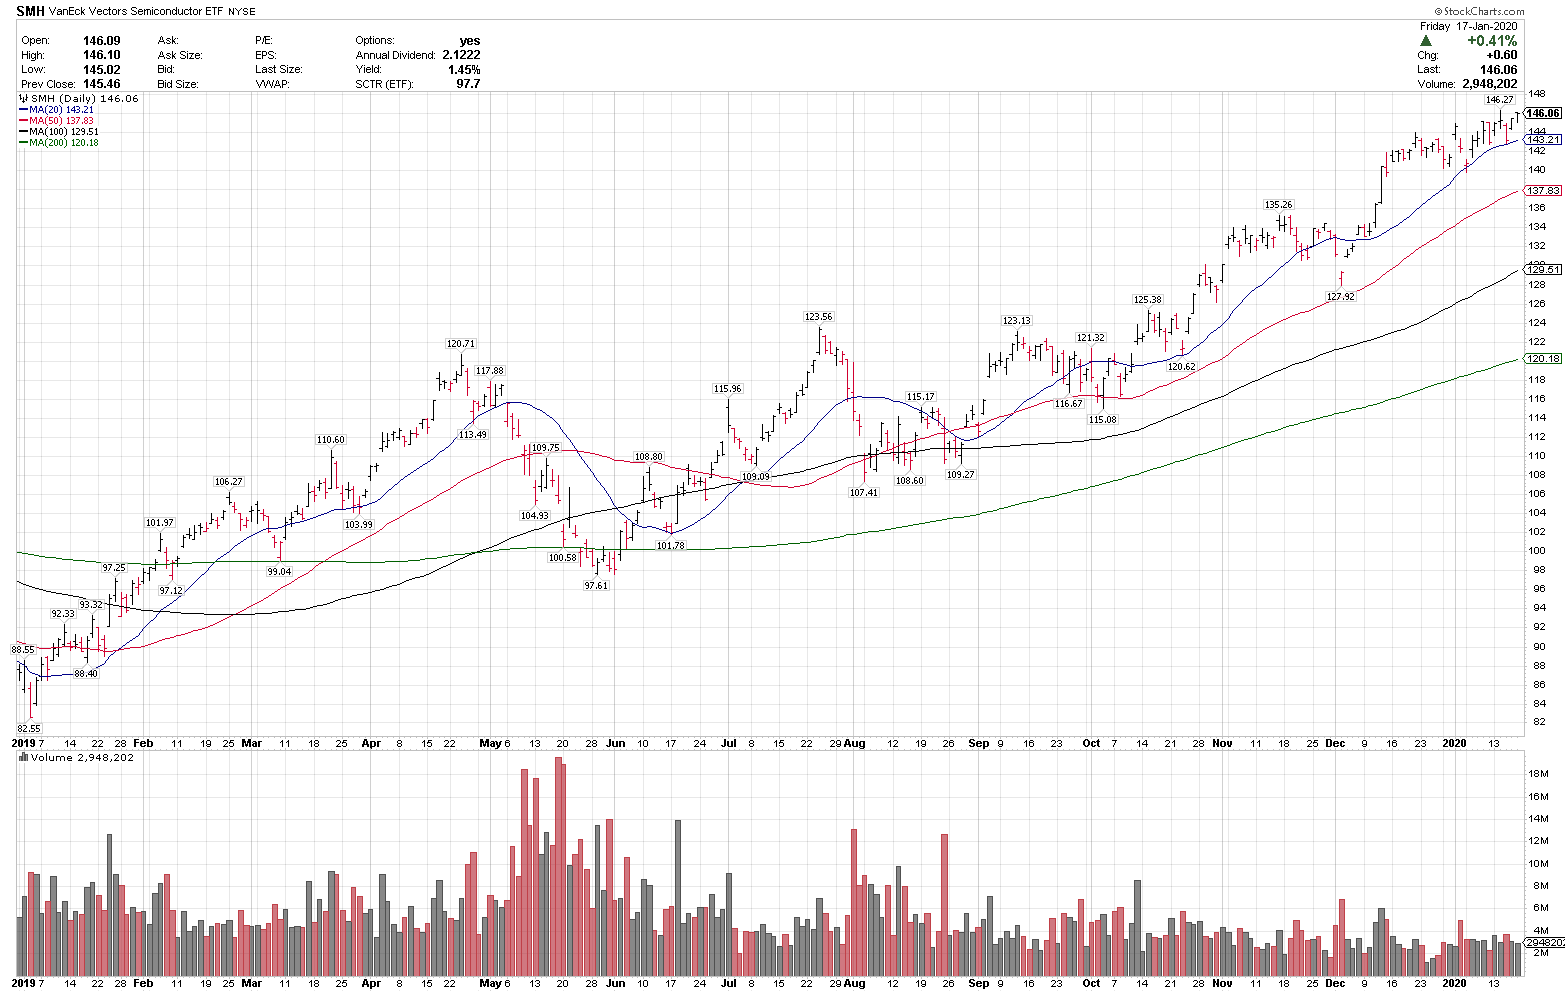
2020 $SMH
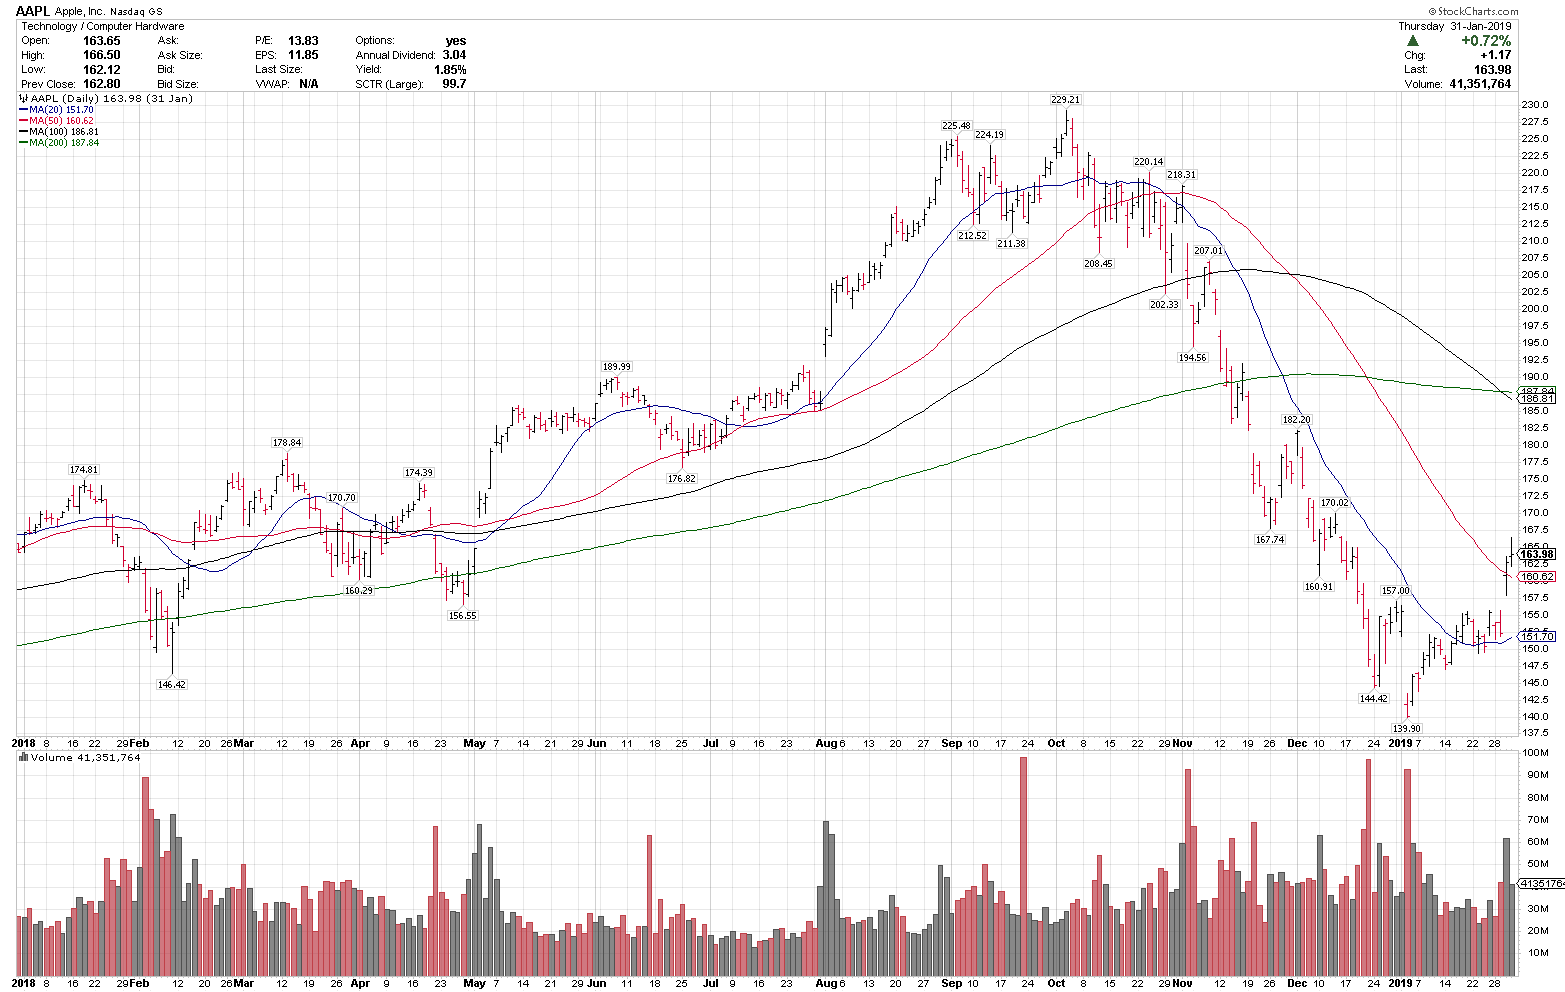
2018 $AAPL
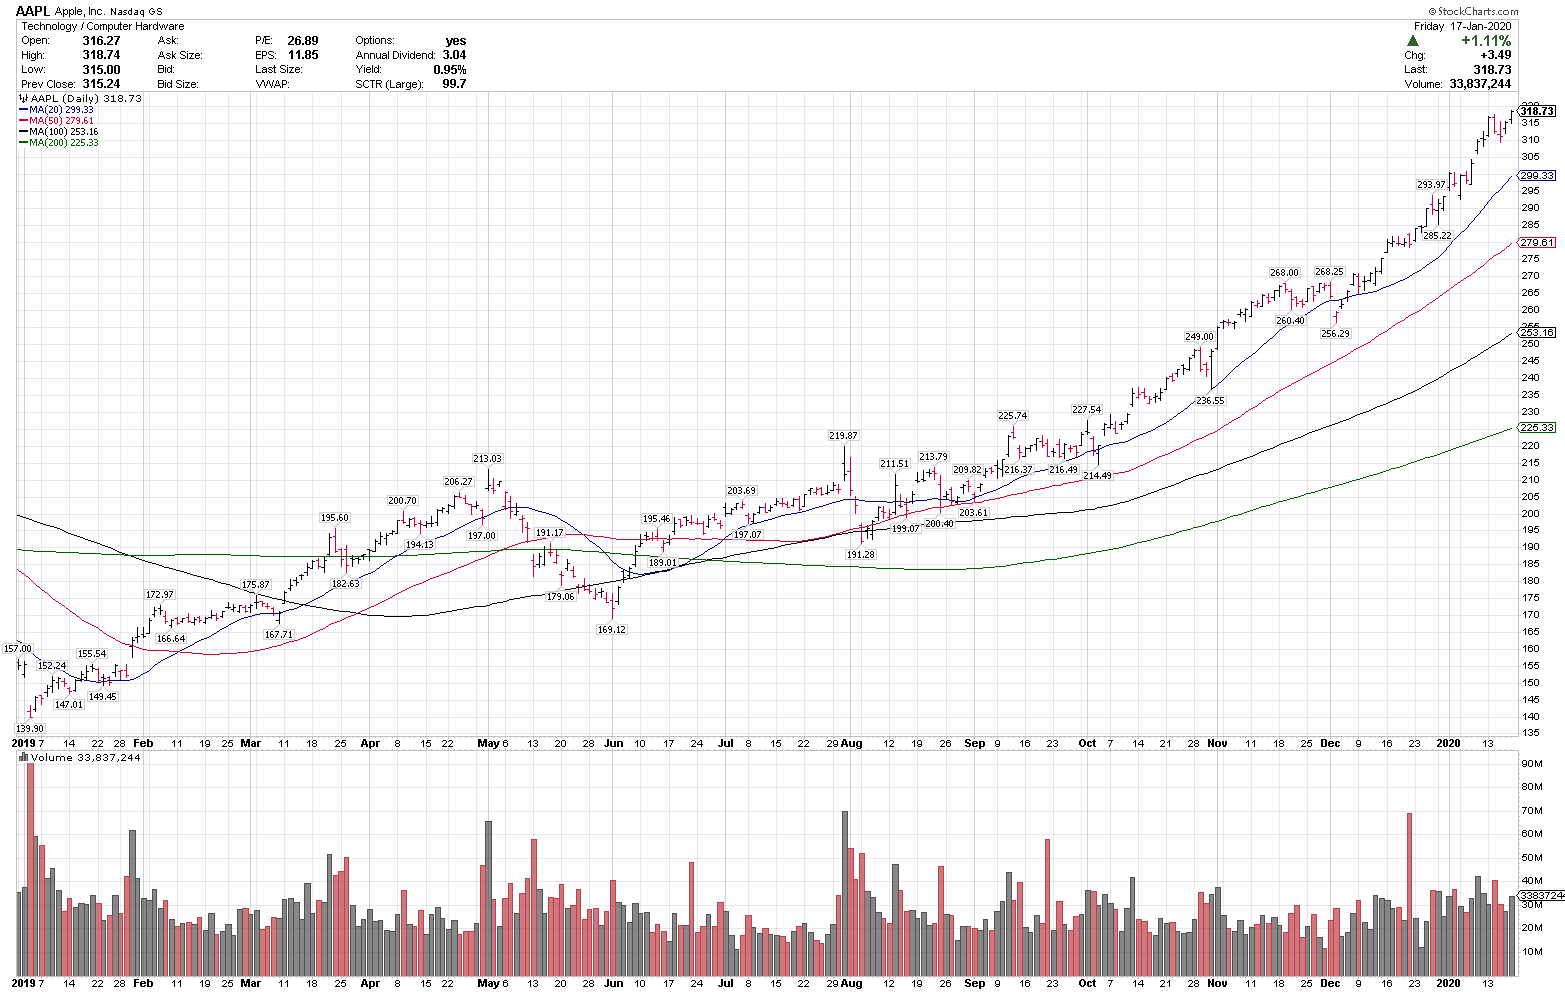
2020 $AAPL
2018 $AMZN

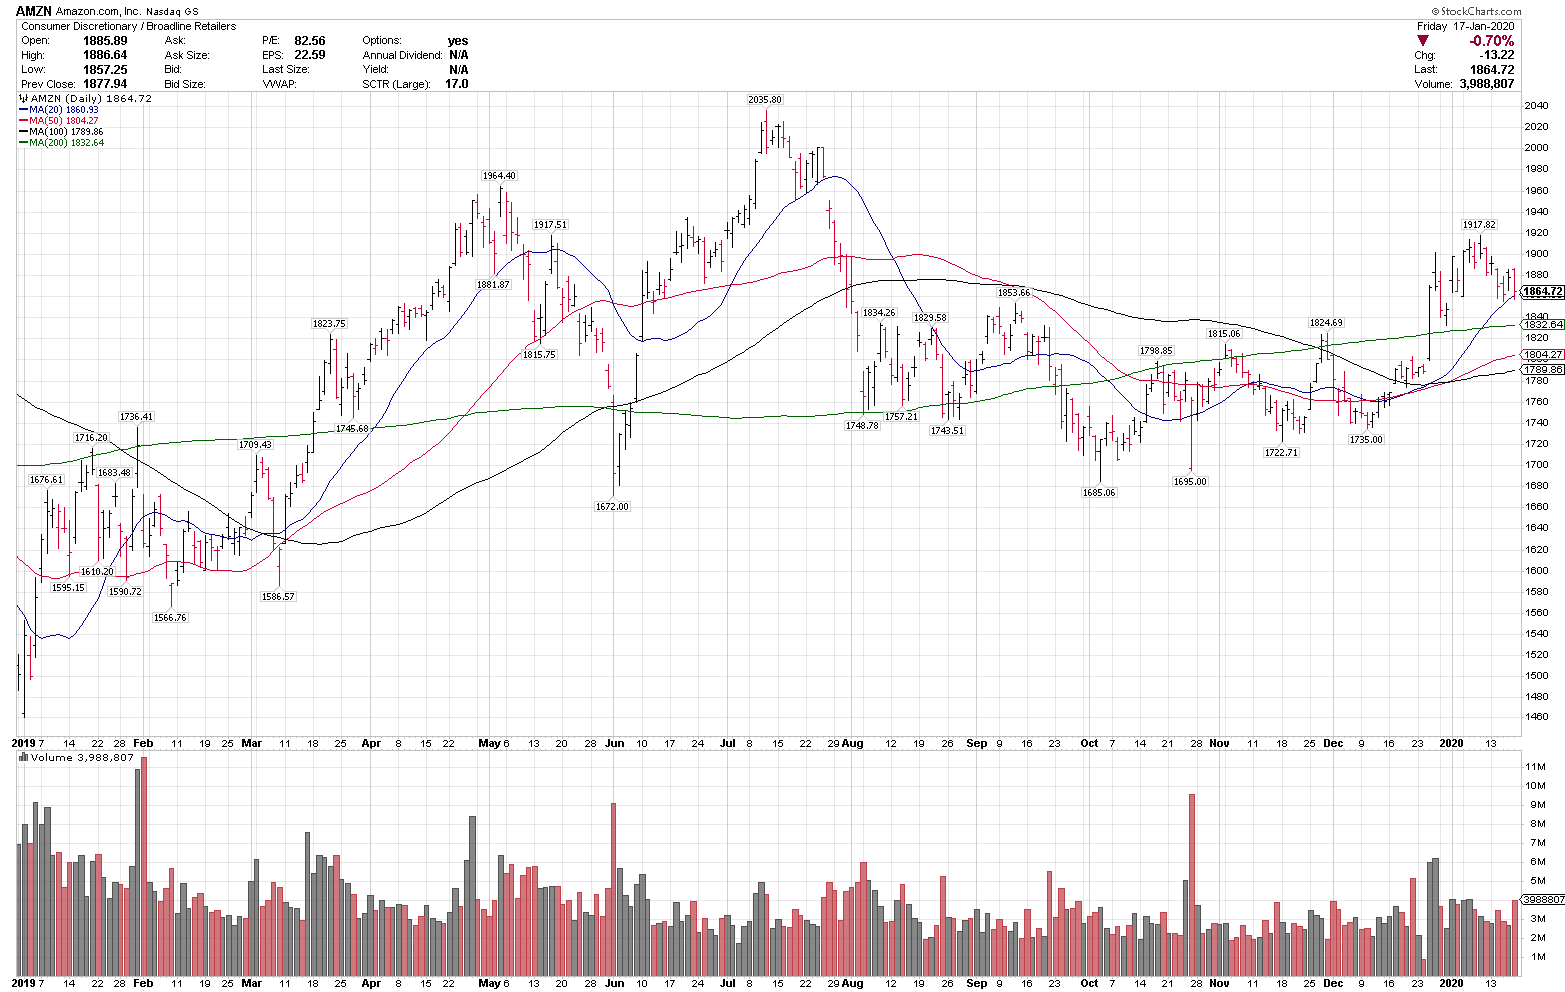
2020 $AMZN
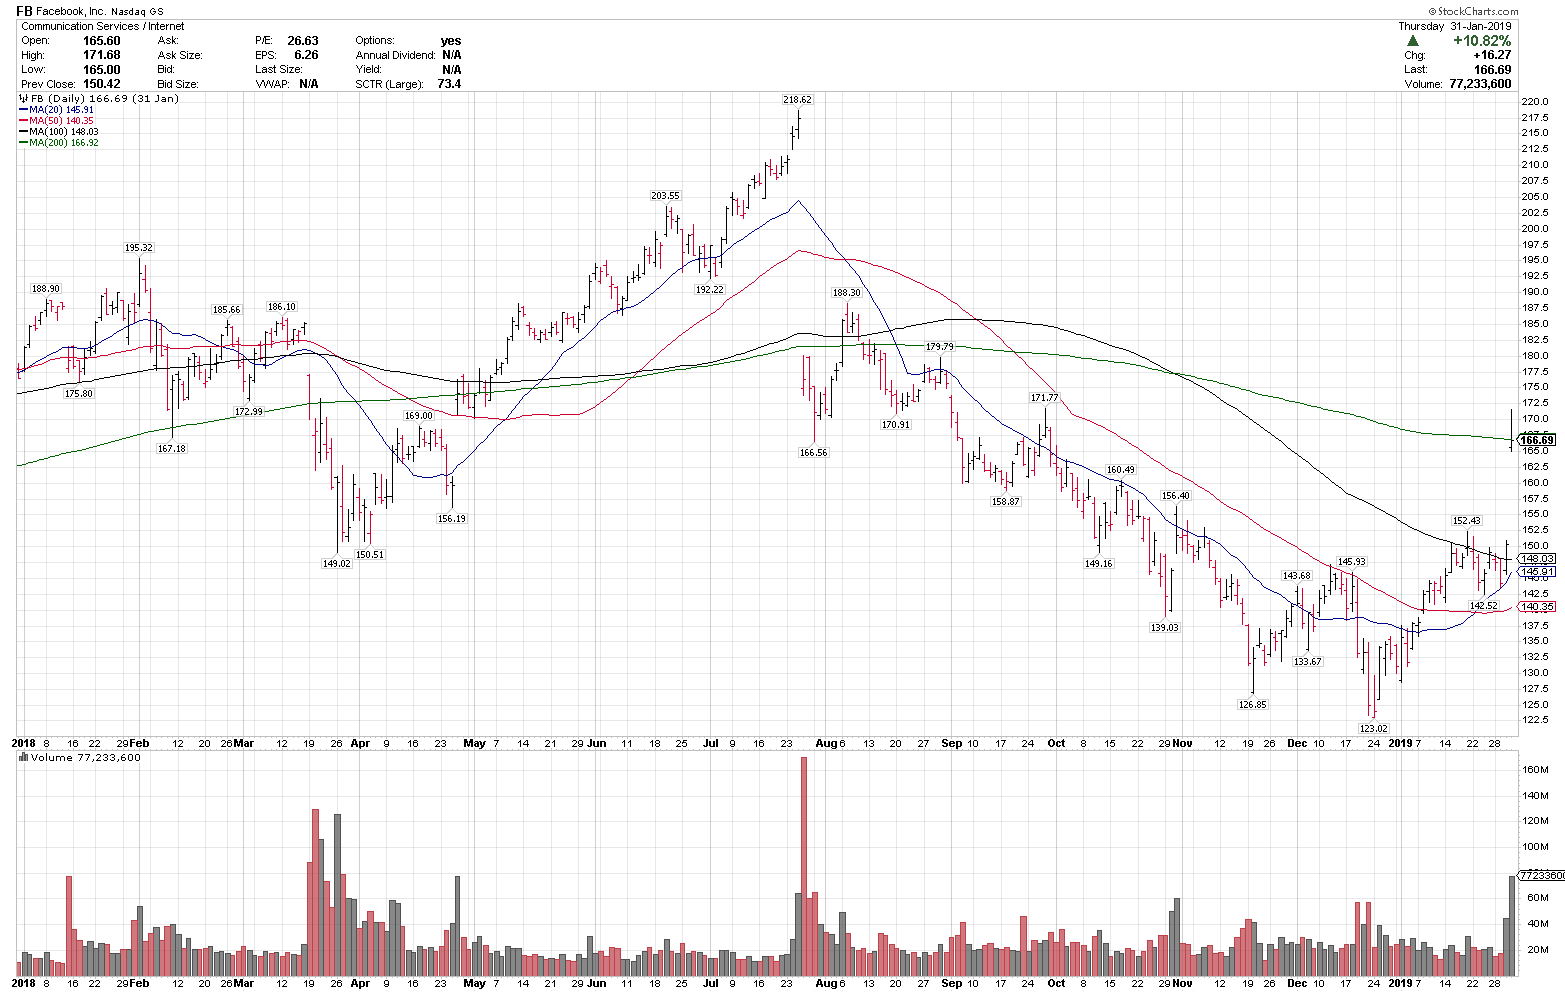
2018 $FB
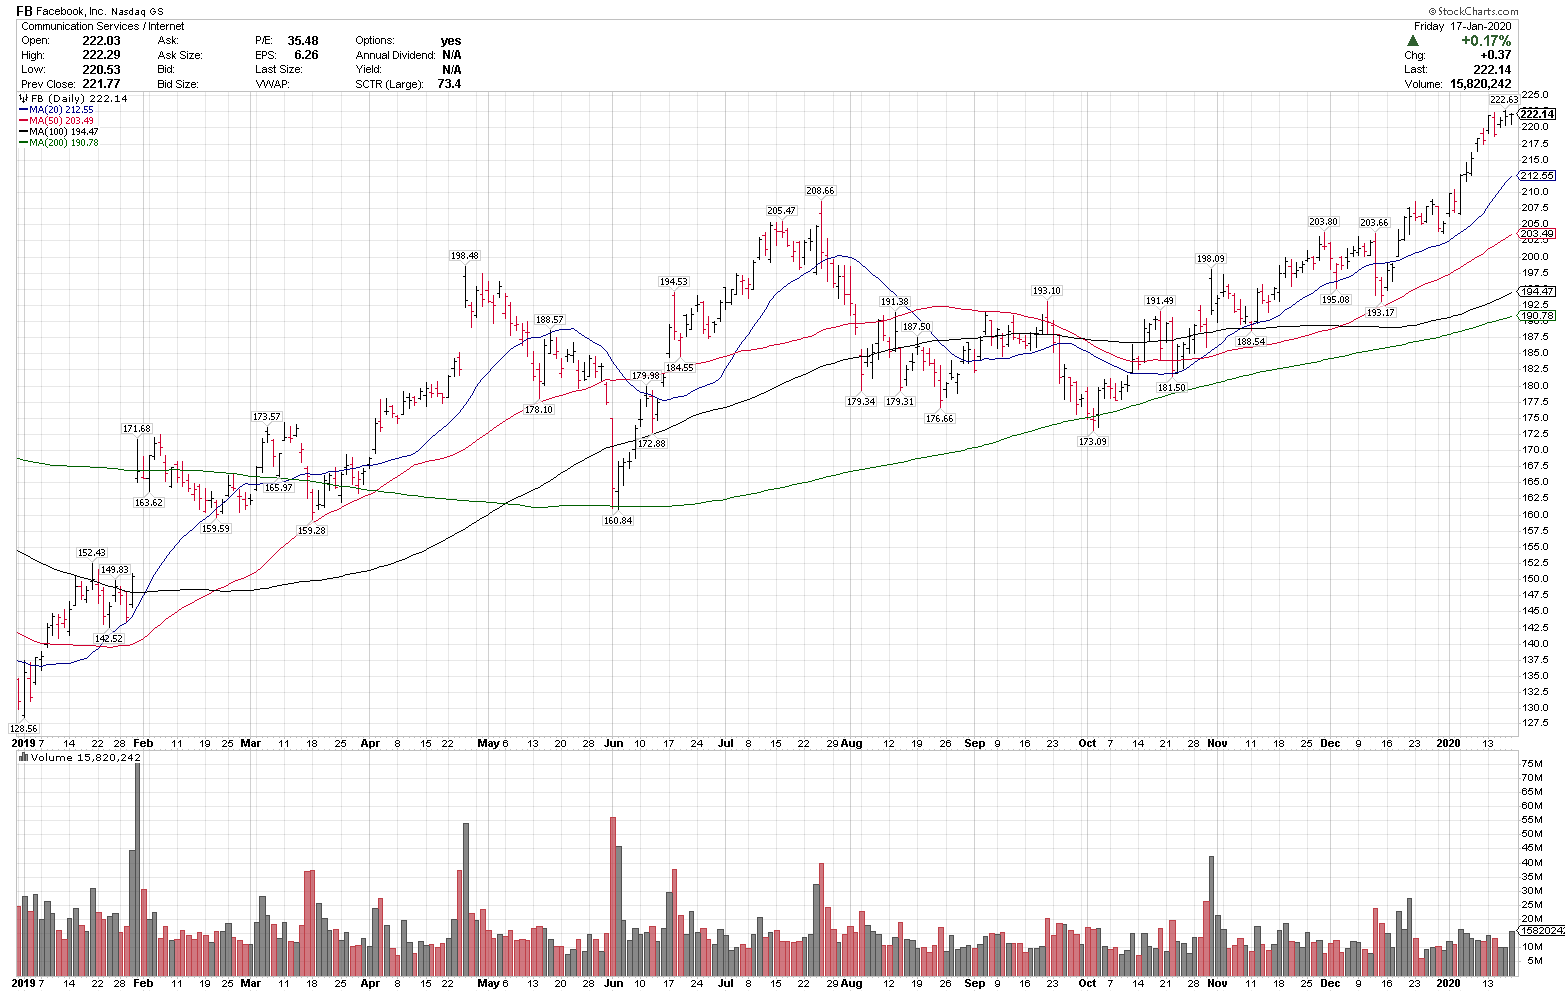
2020 $FB
2018 $GOOG

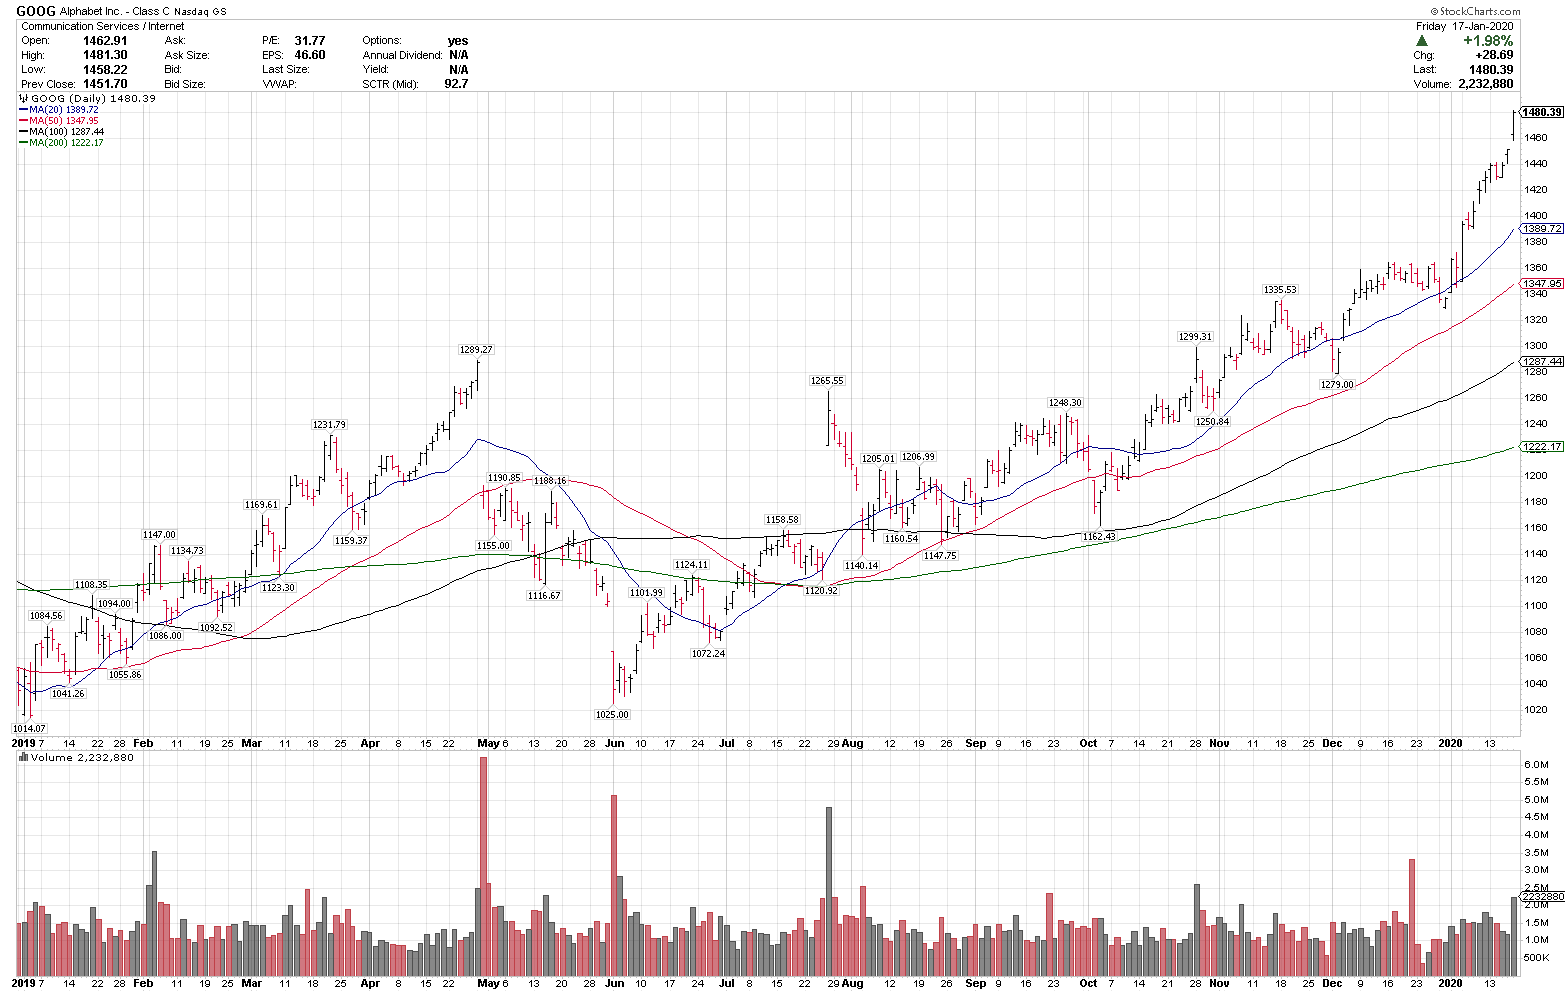
2020 $GOOG
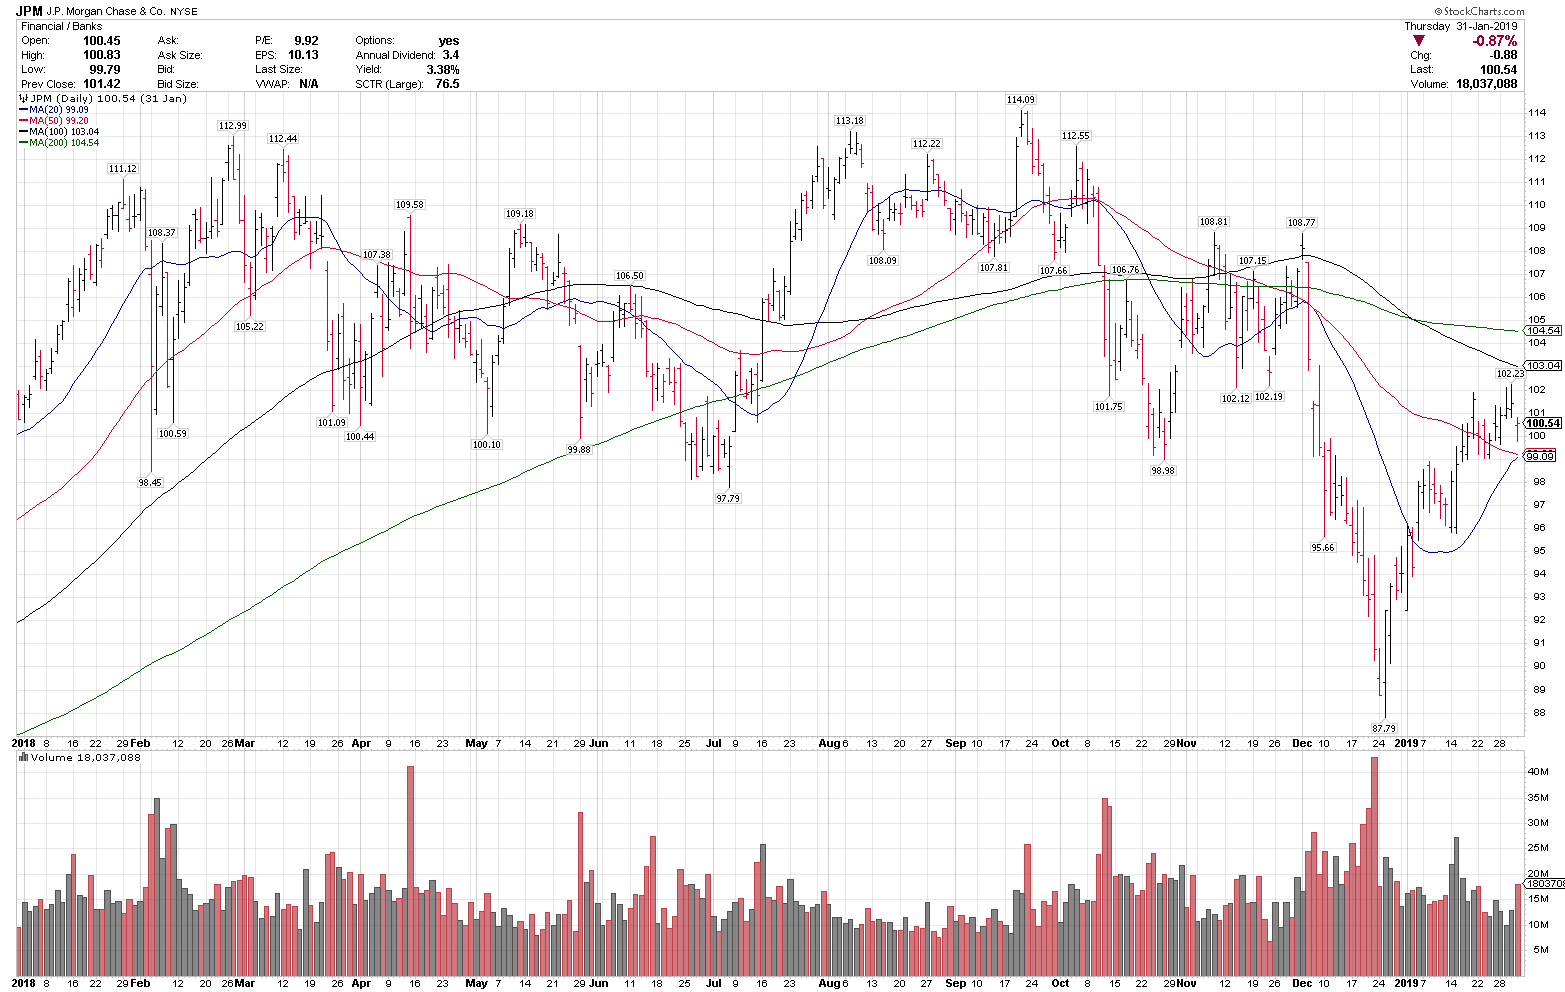
2018 $JPM
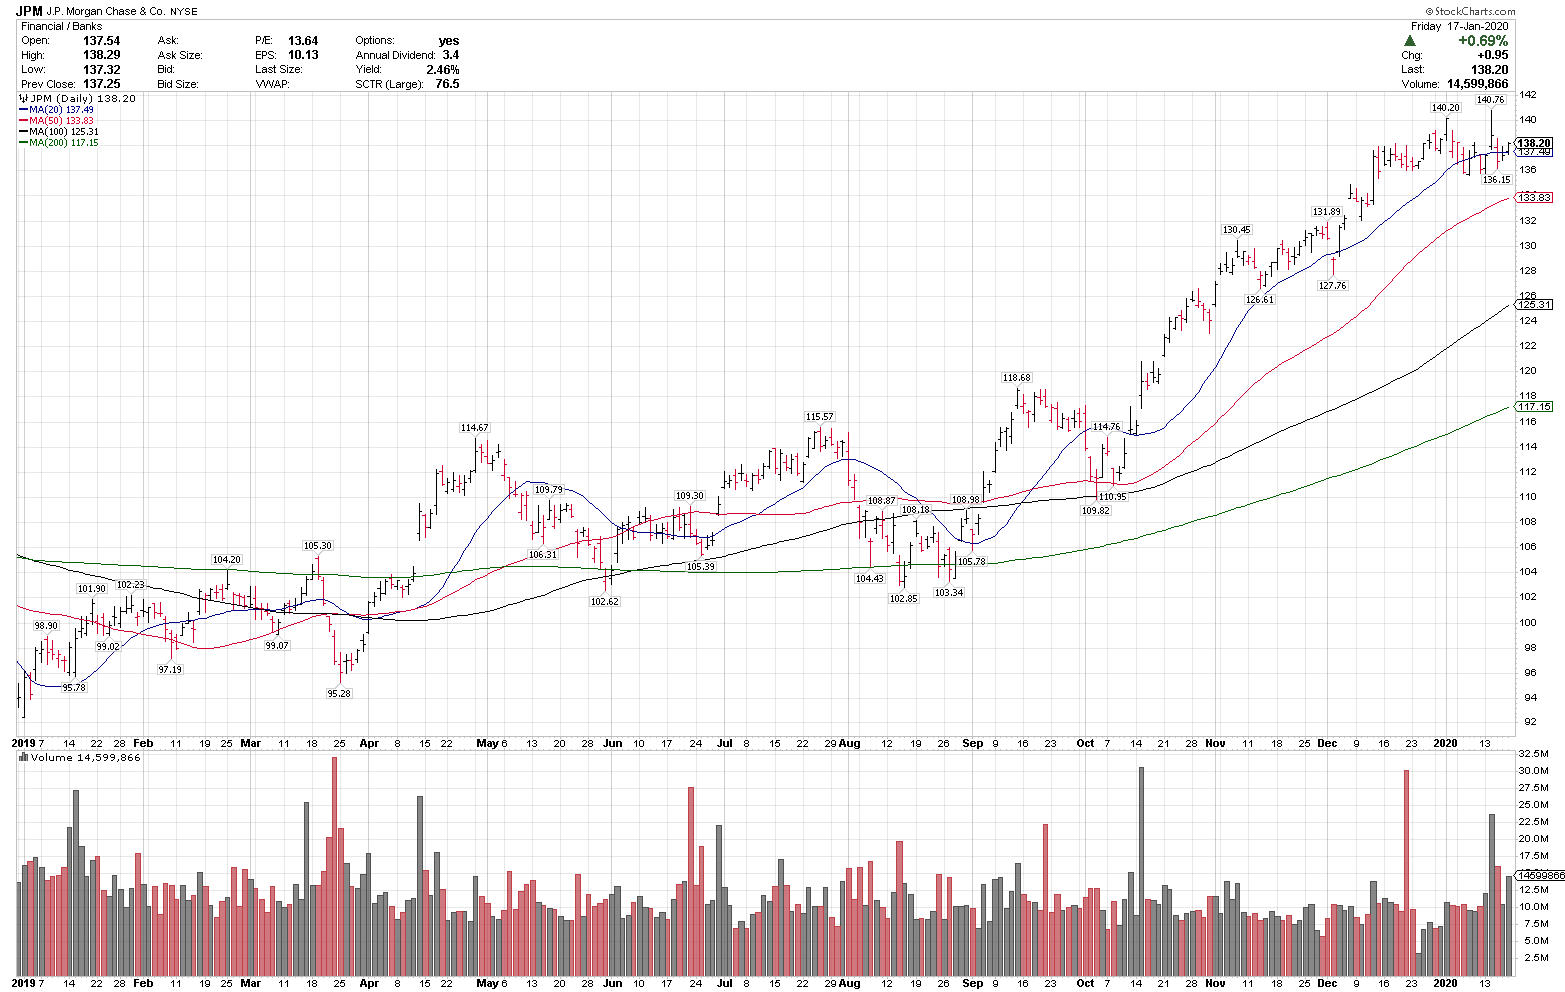
2020 $JPM
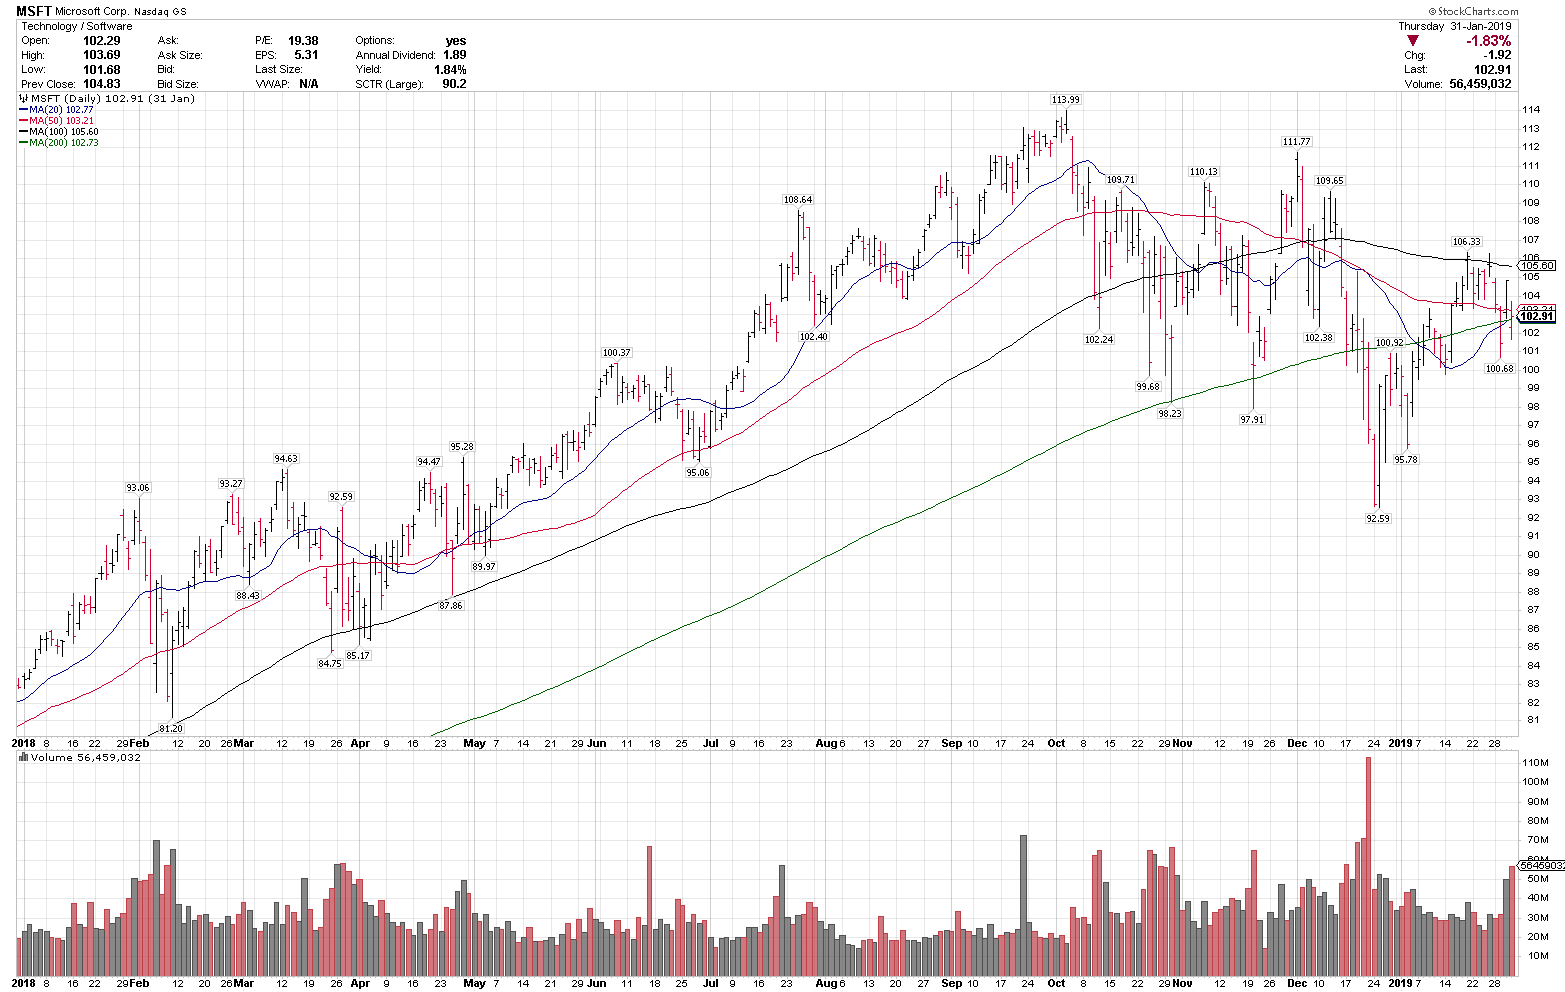
2018 $MSFT
2020 $MSFT

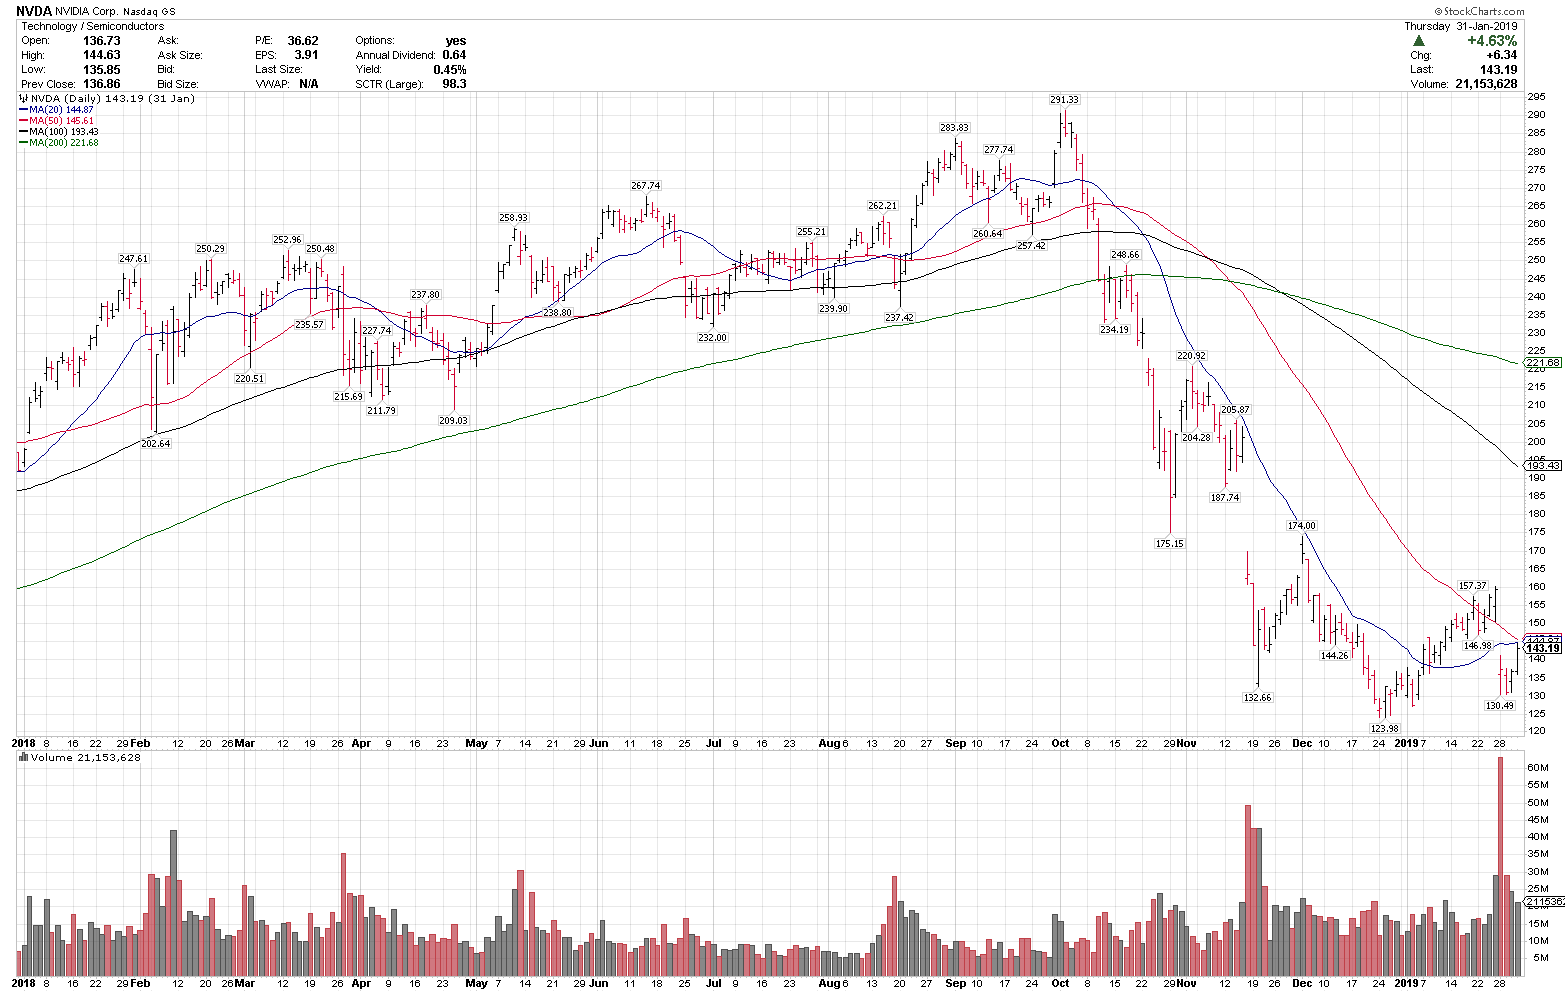
2018 $NVDA
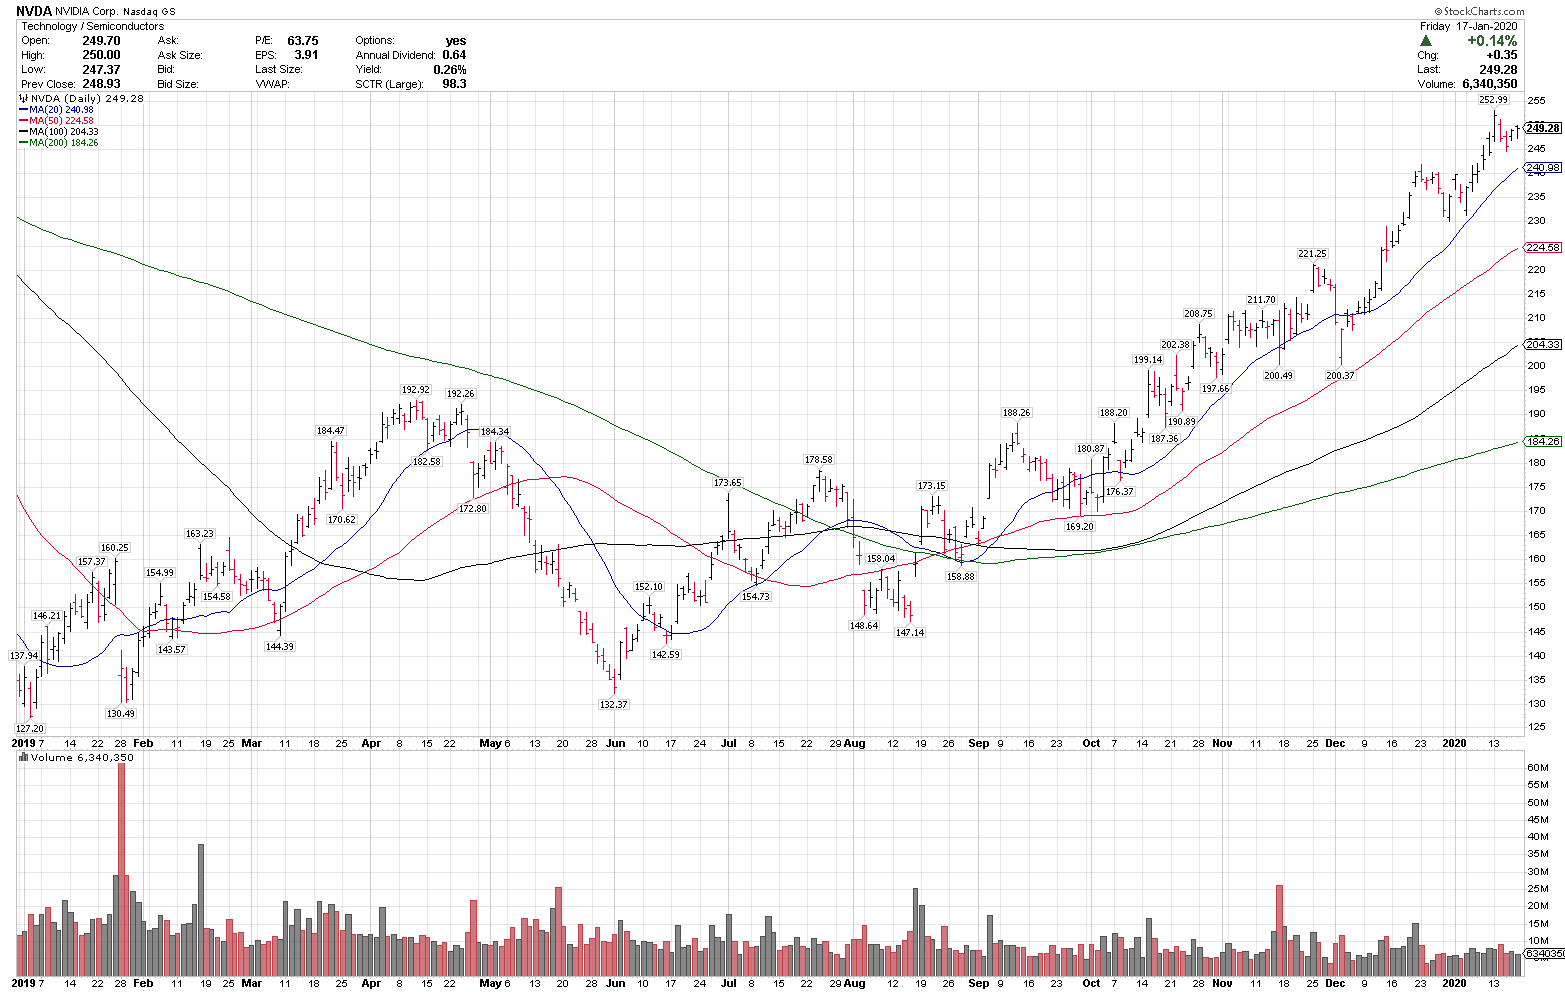
$2020 NVDA
DISCLOSURE: AT THE TIME OF THIS VIDEO WE ARE LONG $AMZN, $FB, NVDA, AND $SMH