WEEKLY TREND REPORT
SUNDAY, MAY 17, 2020
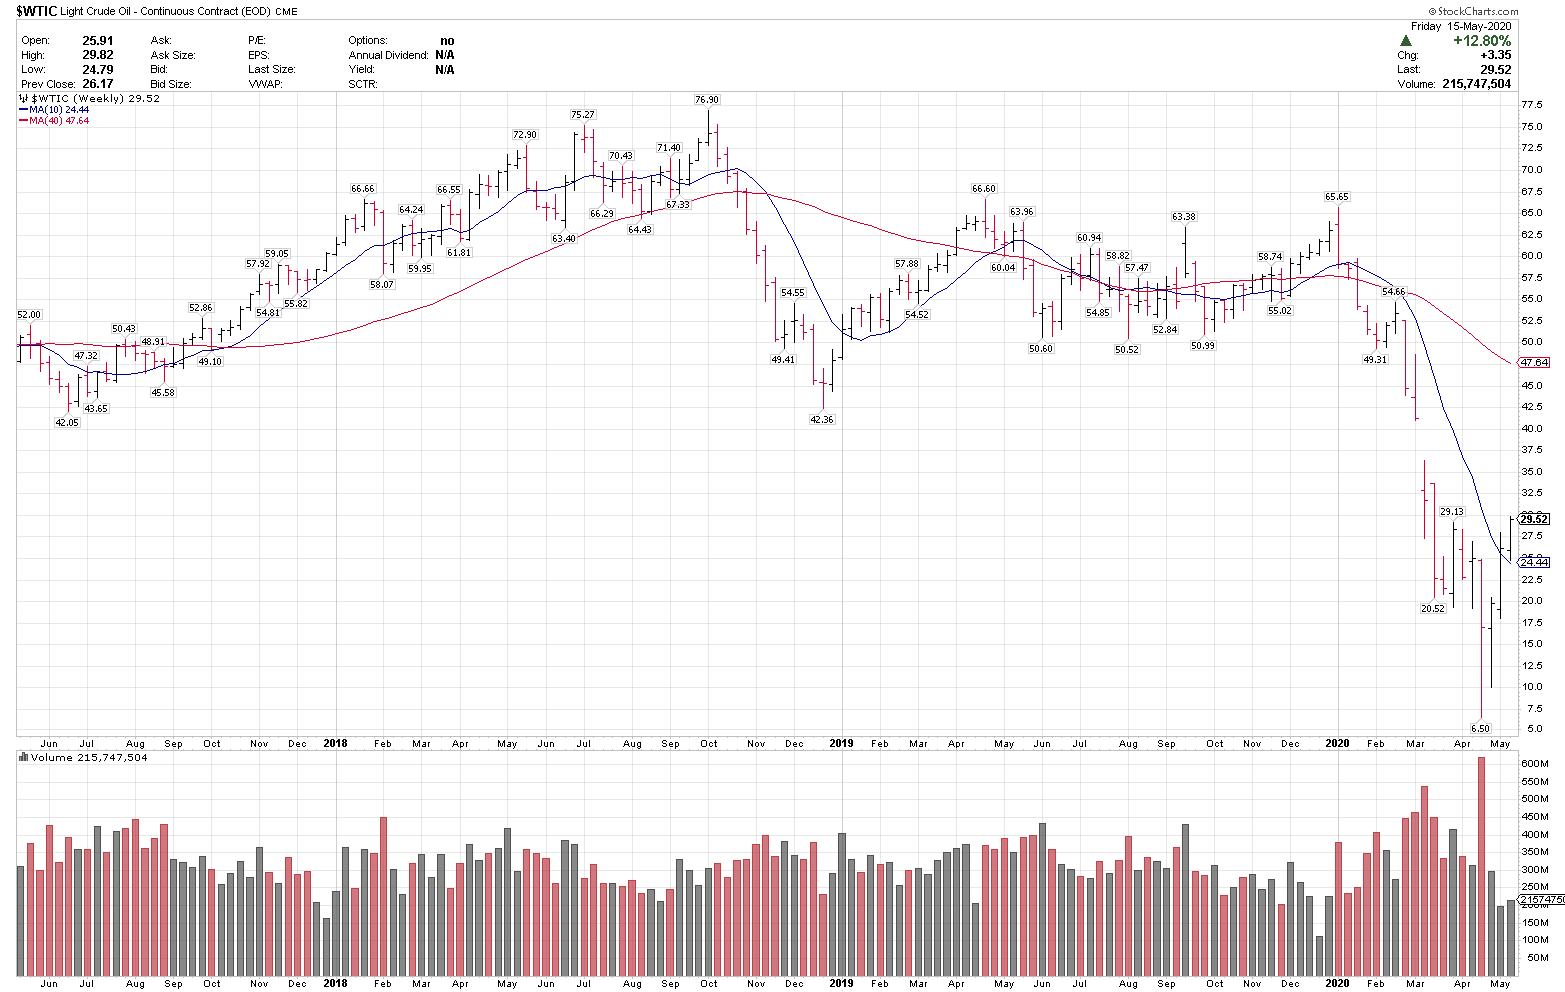
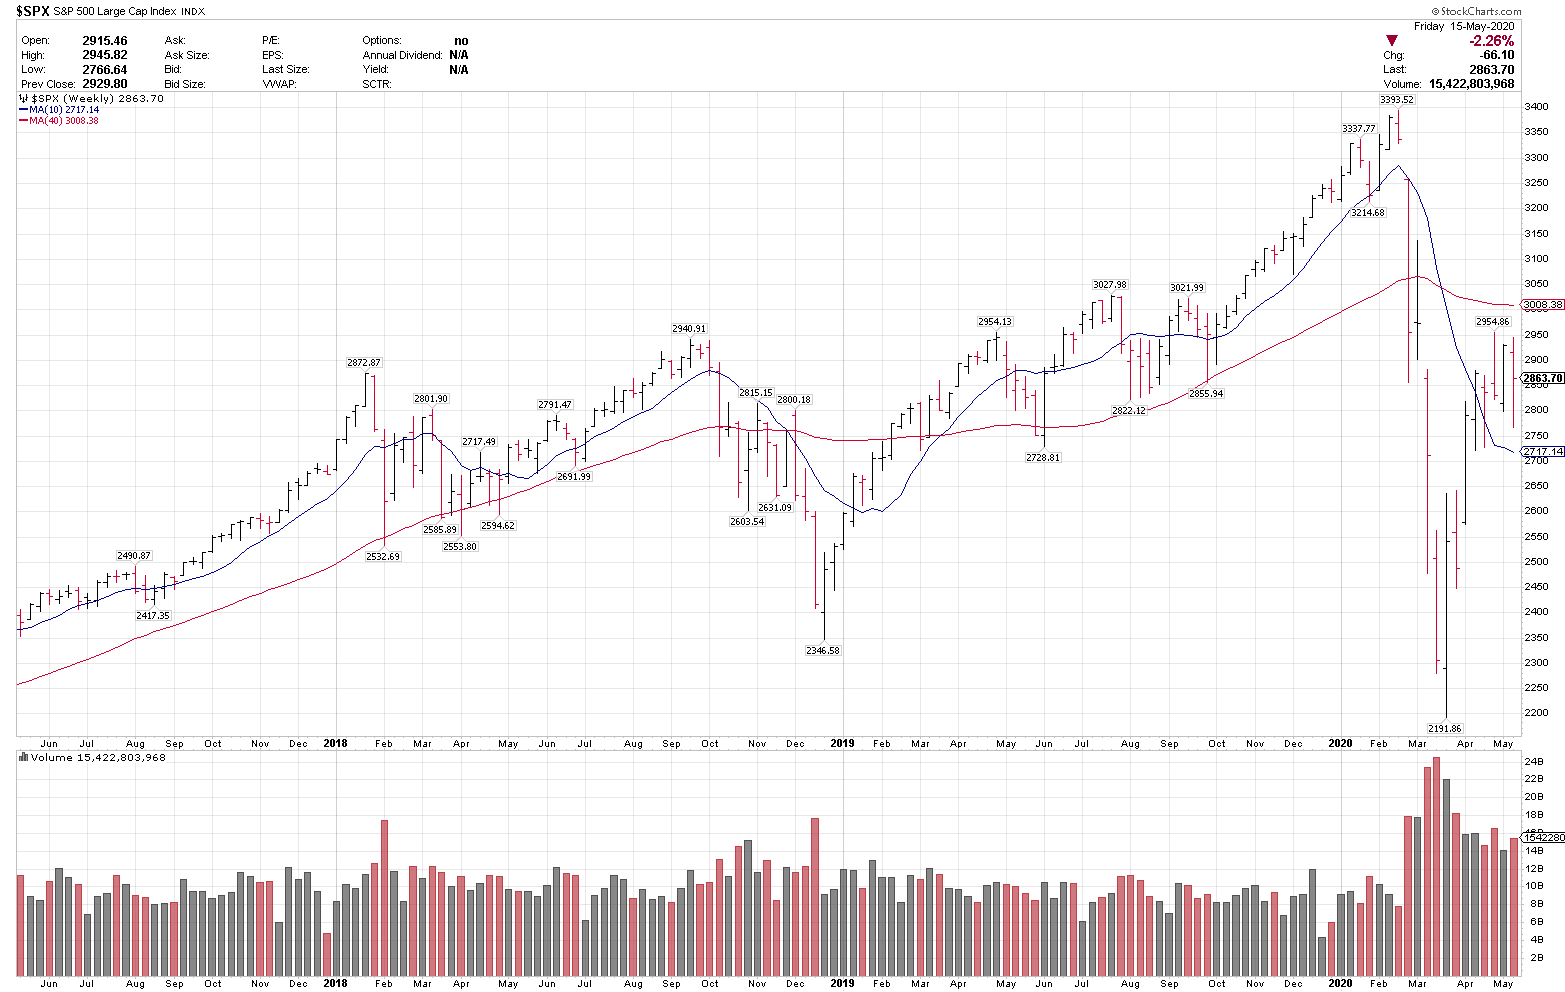
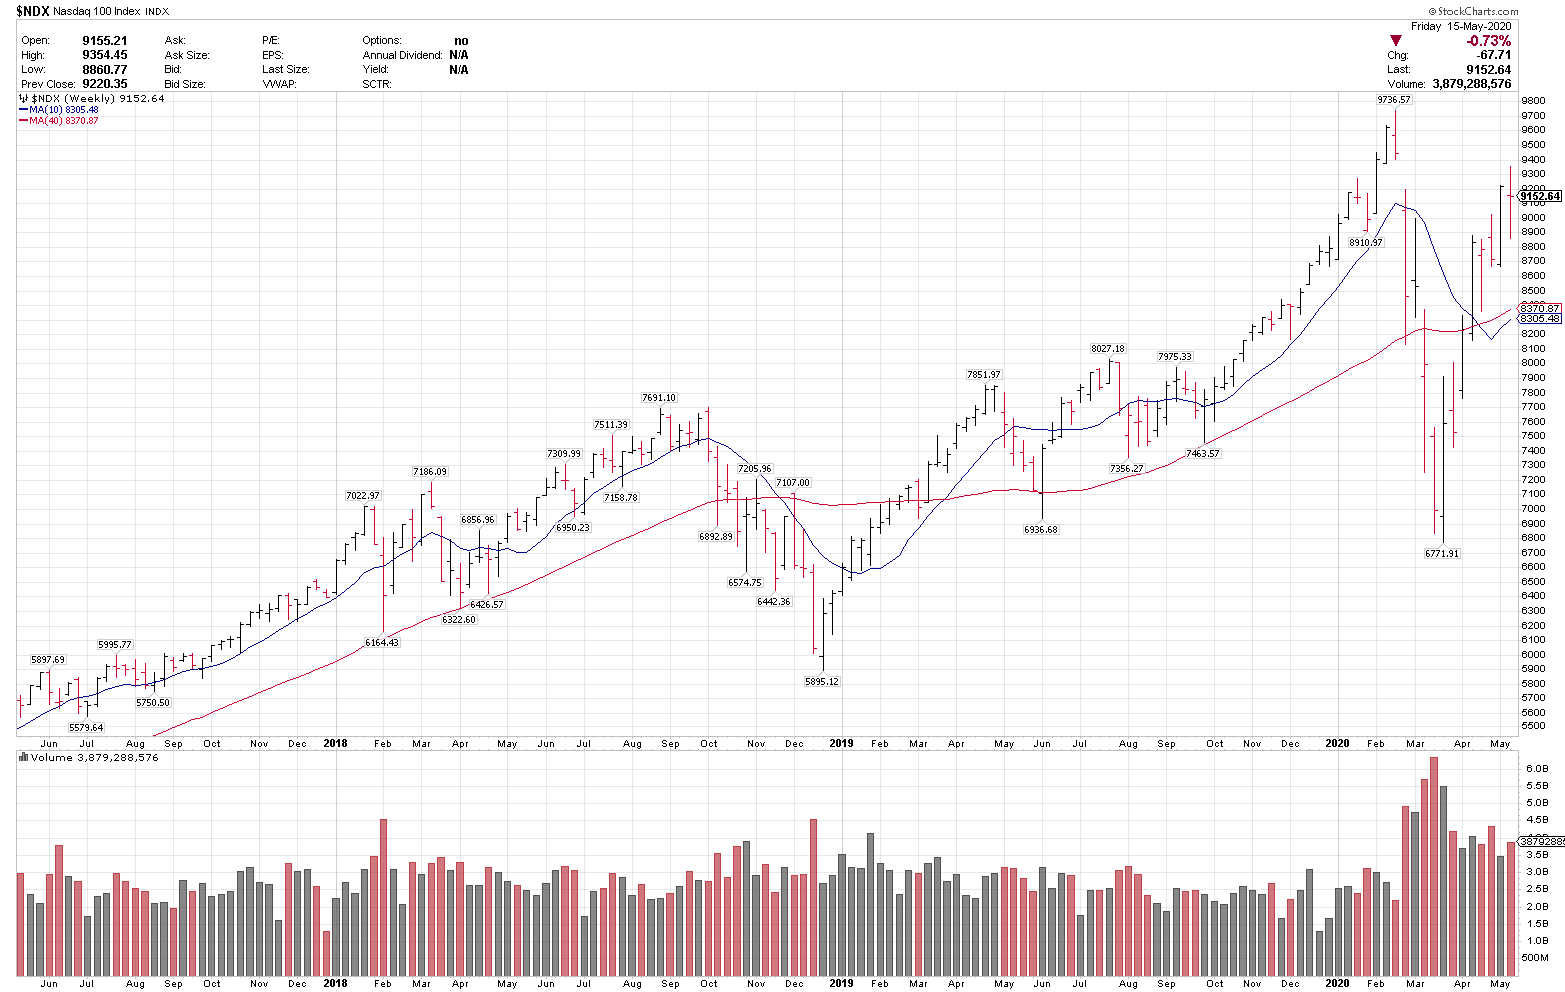
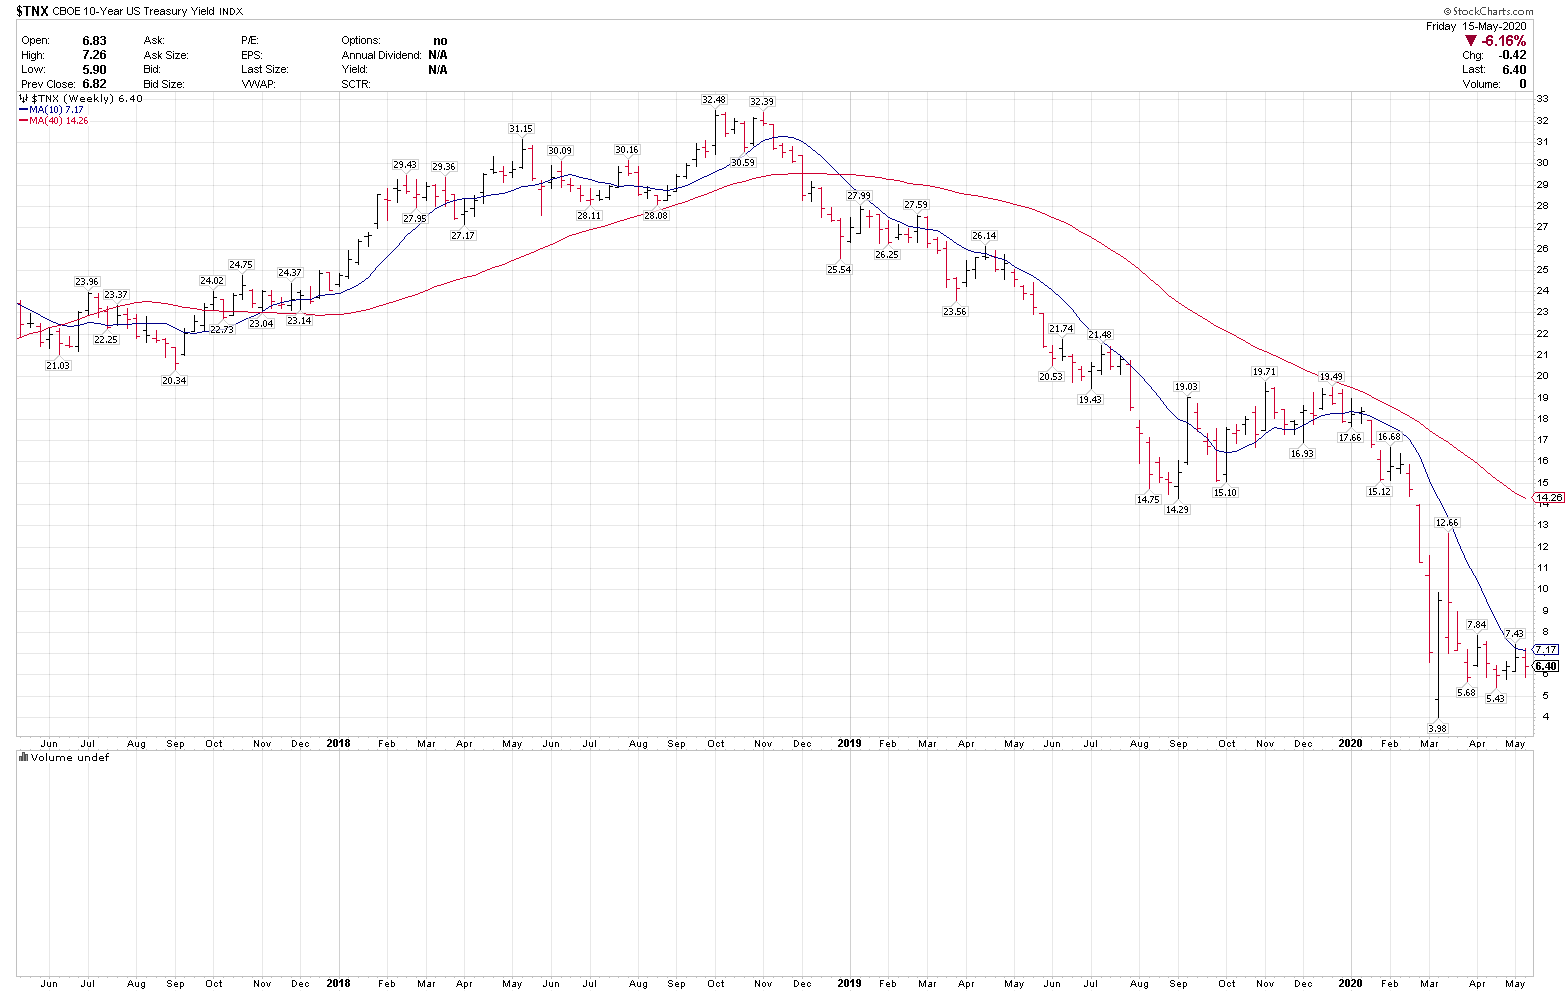
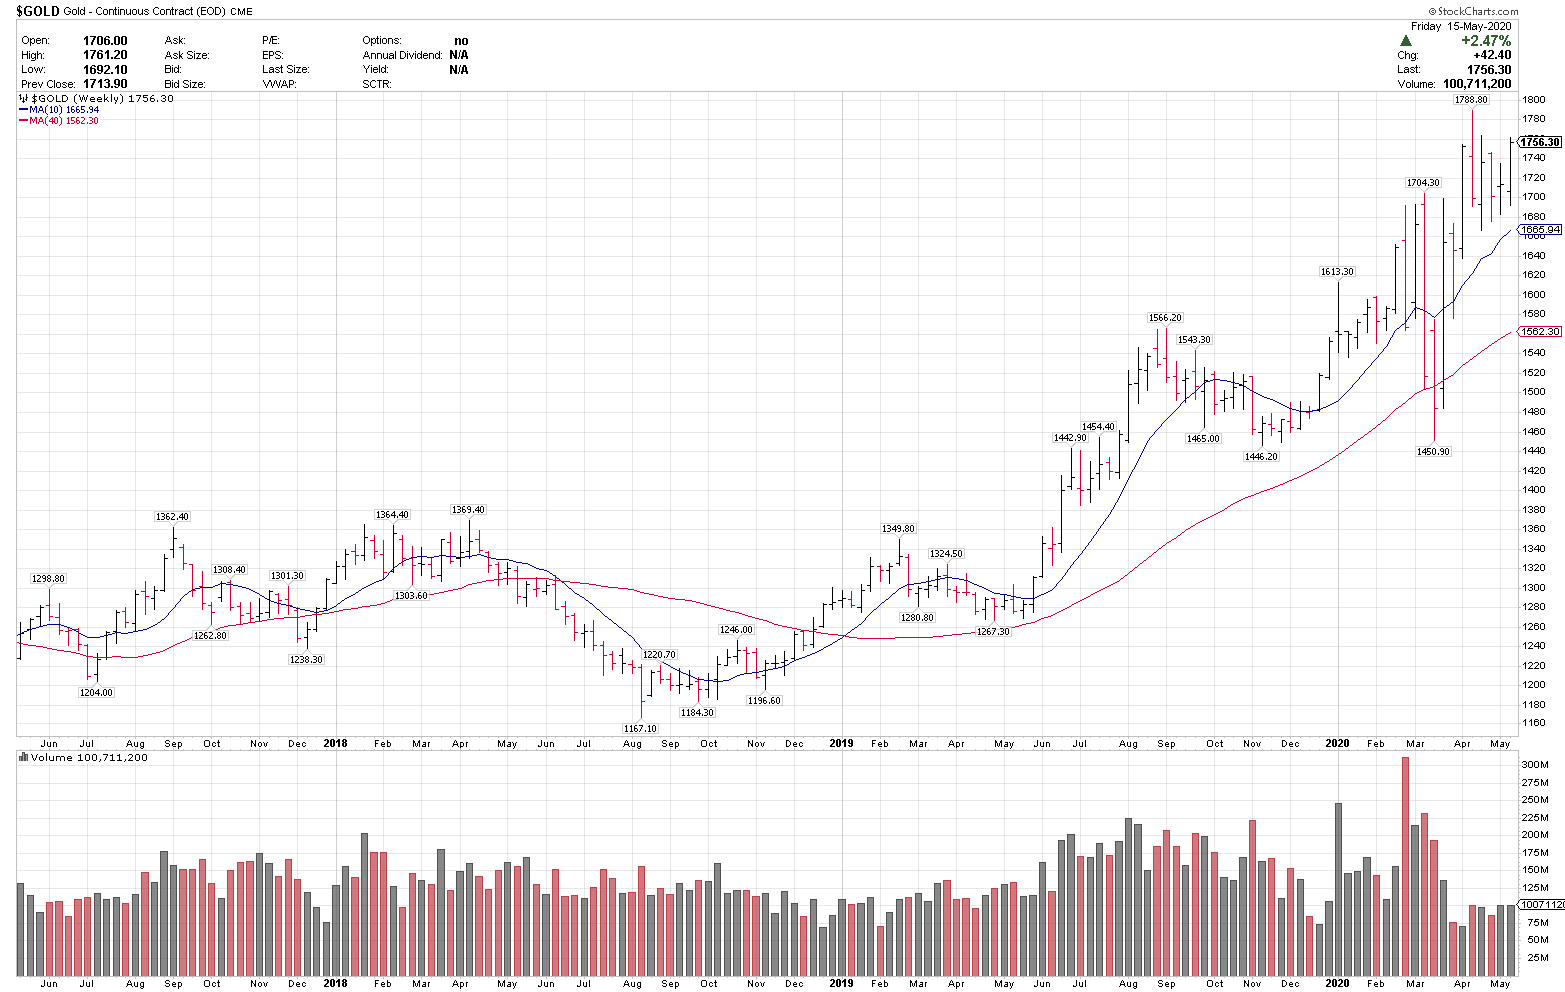
$SPX was -2.26% on the week to close at 2863.70 and $NDX was -.73% on the week to close at 9152.64. 10-year UST yields were down to .640, Gold was +2.47% to 1756.30 and crude oil was +12.80% to close at 29.52.
WEEKLY VIDEO:
$SPX was down on the week in the face of some weak economic data, as could be expected during this time period, plus comments from Jay Powell, Dr. Anthony Fauci, and a few notable hedge fund managers that markets seemed to sell into. Our focus is on the charts and market action, and 2800 is a key near term level for $SPX to hold. It lost the 20-day moving average last week briefly, and the main trend significance of this is that below the 200-sma, the only rising MA to use as a trend gauge here is the 20-day sma. If $SPX can stay above the 20-day, it would indicate a stronger trend, if not, 2800 is a key near term level. Intermediate term key levels are still 2650-2700.
Healthcare news flow and economic reports will continue to be volatile, and the bigger wild-card unknown for now, is how the planned re-openings of various parts of the economy start to progress. The consensus view is that markets have been rallying in part due to a restart of the economy. If there is any delay or new issues that arise with the reopening, that could bring new uncertainty into the picture.
We can’t manage positions based on unknown news, and the key focus is the price trend. The market has been separating the uptrends and downtrends, and that is where our focus will continue to be. As always, overall market direction can have an influence on all charts. Below is an overview of our focus groups for the week:
1. Tech – Large/mega cap tech is still the top ranked focus group. Software & IT services is still the top ranked industry, followed by online gaming, then internet services & media. Tech continues to have the strongest uptrends. Current holdings $NFLX, $NOW and $NVDA all made new all-time highs this week.
The mega-cap leaders have consolidated over the last week and $AAPL, $AMZN, $FB, $GOOGL and $MSFT are all constructive here on their charts. Software price leaders are $SHOP, $NOW, $DOCU, $OKTA, $TEAM, $VEEV and $ZM, which have had strong recent breakouts, but some have also come out of multi-month bases. While the group could consolidate at any time, the main trend is very strong here. In online gaming, the $ESPO ETF is in a steady uptrend and $ATVI and $EA are top ideas. With many Fortune 500 companies starting to announce extended ‘work from home” plans, the shift into software could see further importance, the price trend will let us know.
Semiconductors as a group are lagging, and other than $NVDA, the group has been lagging here, with $AMAT, $MU and $TSM trading below their 200-day moving averages recently. Semis are one of the more cyclical industries, while the work from home/virtual business model plays well into the software space.
The strongest names here are in strong uptrends with higher highs and lows and above their rising 20-sma. While overall market direction can be a factor, this is still the best sector on the screen right now.
2. Healthcare – Biotech is the stronger industry, $IBB is set up well here, $REGN, $VRTX and $SGEN are top breakout names, $AMGN is setting up well, and $GILD is weakening for now. In pharma, we have been expecting a move higher for the past week, and the group picked up on Friday. $ABBV, $LLY, $JNJ and $BMY are top charts and $XLV as an ETF.
3. Gold & Gold Miners – Gold and miners made new 7-year highs again last week, and this group continues to be in a very strong uptrend with new breakouts last week. It is a volatile group, but the trend is up and $GDX, $NEM, $GOLD, $FNV and $AU are key ideas here.
4. China internet – Another focus group, and the ETF is a good choice for those who do not want single stock exposure here. In stocks, $JD, $NTES, $SE and $TCEHY are leading charts and $BABA has been lagging for now. $BABA reports earnings this week.
5. Energy – Energy stocks were volatile last week, but as crude oil improves, this group has been trending higher. $CVX, $COP and $EOG are the top current charts in the group along with $XLE.
6. Consumer goods has some lower beta names such as $CLX, $DG, $KR, and $WMT which have been trending higher and still top longer term ideas, as price dictates.
Cyclicals as a whole had a down week last week, as challenging economic forecasts and news continue to come out. Financials and industrials led lower, with travel and tourism, and as long as the cyclical groups stay under pressure, they could continue to weigh on $SPX.
US Treasury Bonds – for those looking at this group, the test of the 50-day moving average in 10-year yields and $TLT and $TMF could offer a lower risk vs reward entry point if the trend in lower yields continues.
In summary, as long as $SPX continues to trade in a sideways or upward trend, than the leading focus groups may continue to outperform. News flow is still volatile and any major unexpected news could become a factor. For now, our continued focus is on the stronger names in uptrends, avoiding the weaker names in downtrends and risk management.
Have a great week,
Larry Tentarelli
Publisher
FOCUS GROUPS ETFs
*Our top 10 Ranked ETFs here
TOP UPTRENDS FOCUS LIST
*Our top 20 ranked stocks going into the week
OPEN POSITIONS
CORE MARKETS WEEKLY
| MARKETS WEEKLY | CLOSING PRICE | WEEKLY CHANGE | WEEKLY % CHANGE | TREND | >40 WMA |
| S&P 500 $SPX | 2863.70 | -66.10 | -2.26 | U | N |
| Nasdaq 100 $NDX | 9152.64 | -67.71 | -.73 | U | Y |
| Dow Industrials | 23685.42 | -645.90 | -2.65 | U | N |
| 10-year UST Yields | .640 | -.042 | D | N | |
| WTI Crude Oil | 29.52 | 3.35 | 12.80 | N | N |
| Gold | 1756.30 | 42.40 | 2.47 | U | Y |
| *ETFs* | |||||
| SPY | 286.28 | -6.16 | -2.11 | U | N |
| QQQ | 223.27 | -1.59 | -.71 | U | Y |
| EEM | 36.03 | -.81 | -2.20 | N | N |
| VGK | 44.47 | -1.72 | -3.72 | N | N |
| GLD | 163.93 | 3.51 | 2.19 | U | Y |
| GDX | 36.57 | 1.71 | 4.91 | U | Y |
| TLT | 166.71 | 2.73 | 1.66 | U | Y |
$SPX WEEKLY
$NDX WEEKLY
$TNX WEEKLY
$GOLD WEEKLY
WTI CRUDE OIL WEEKLY