
WEEKLY VIDEO: https://bit.ly/BCDWeeklyVideo41623
We have a new format this week, to allow for easier access to our weekly best ideas lists.
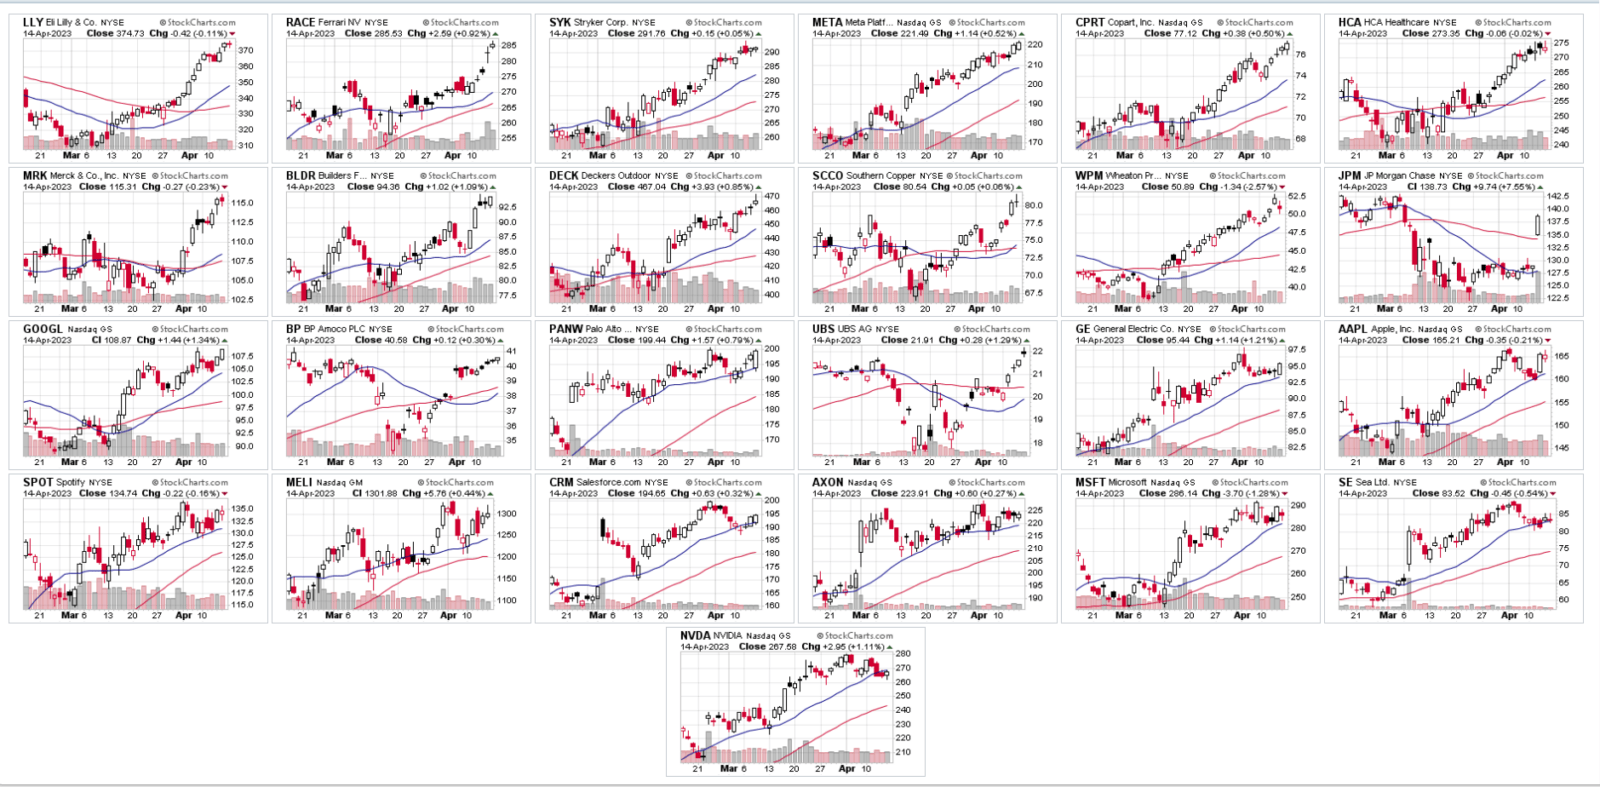
THIS WEEK’S TOP 25 LIST –
- These charts are selected based on their current trends and is not a short-term market call.
- All charts are subject to pullbacks or higher-volatility at any time.
- Each chart is ranked on a stand-alone basis. This is not a suggested model portfolio.
- The charts are listed below by daily RSI.
- Earnings dates should be verified. This list is not screened for earnings dates. We post top-ranked technical charts, but do not advocate taking positions ahead of earnings, or not. That is an individual decision. We generally do not start new positions within 14 days of earnings reporting dates.
- An asterisk (*) indicates a daily RSI over 70.
LLY*, RACE*, SYK*, META*, CPRT*, HCA*, MRK*, BLDR, DECK, SCCO, WPM, JPM, GOOGL, BP, PANW, UBS, GE, AAPL, SPOT, MELI, CRM, AXON, MSFT, SE, NVDA
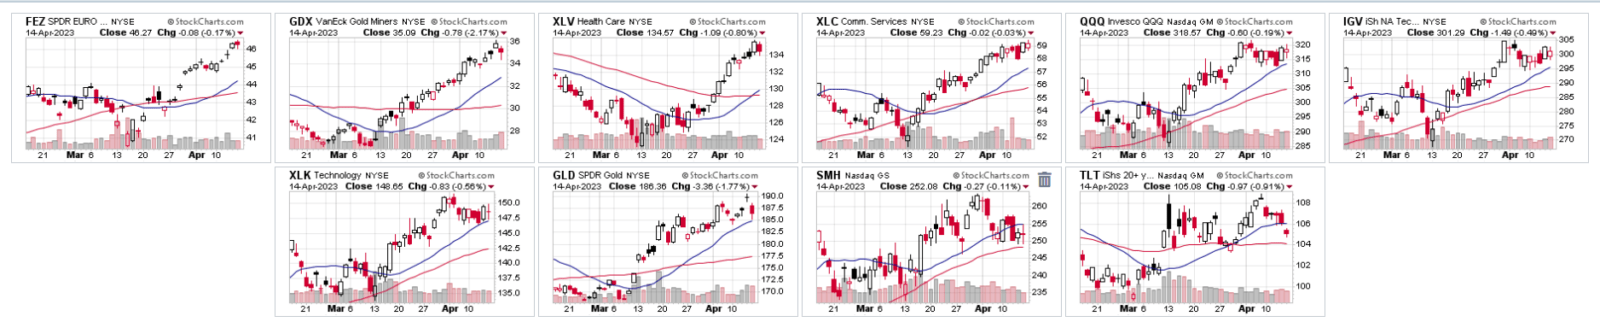
FOCUS LIST ETFs:
- These charts are selected based on their current trends and is not a short-term market call.
- All charts are subject to pullbacks or higher-volatility at any time.
- Each chart is ranked on a stand-alone basis. This is not a suggested model portfolio. There is often sector overlap.
- The charts are listed below by daily RSI.
- An asterisk (*) indicates a 70-daily RSI or higher, which is often considered overbought.
FEZ*, GDX, XLV, XLC, QQQ, IGV, XLK, GLD, SMH, TLT
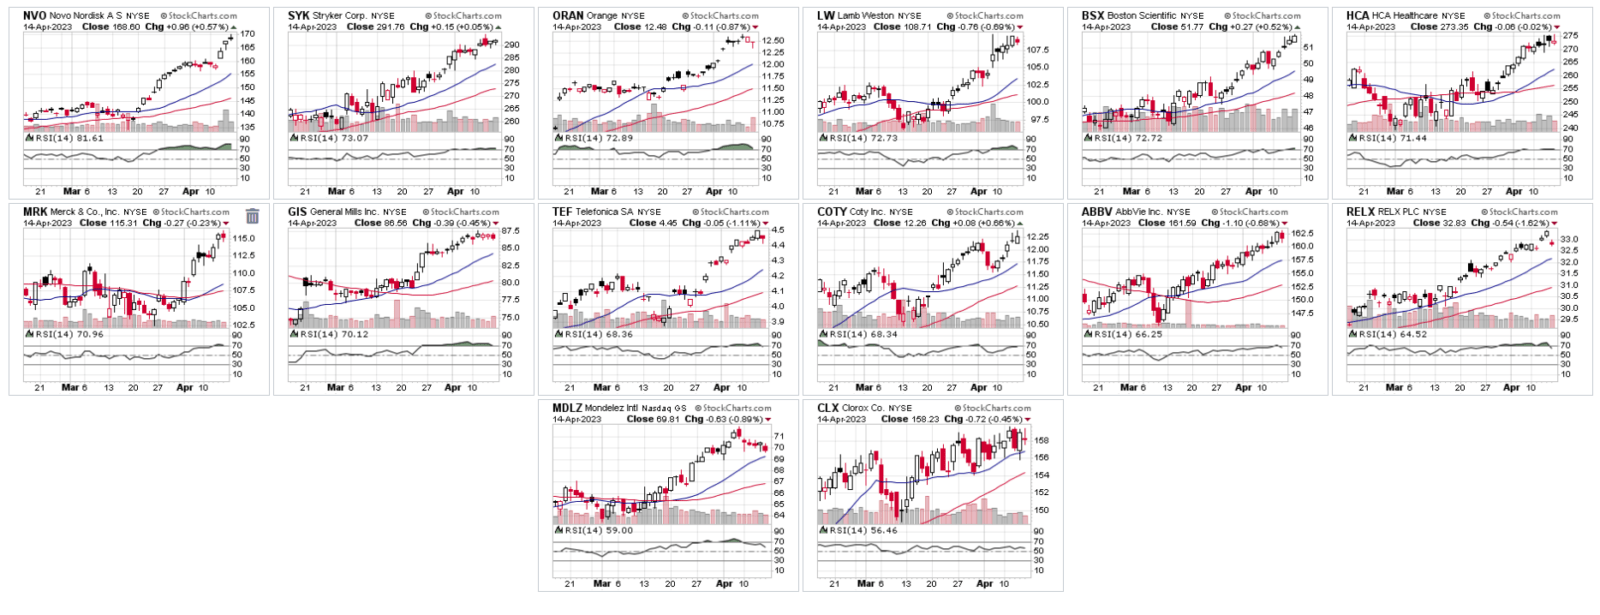
WEEKLY LOWER-VOLATILITY/DEFENSIVE STOCKS LIST:
– listed by daily RSI
– not screened for earnings dates
– based on the stand-alone charts, not as a model portfolio.
– (*) = over 70 daily RSI
NVO*, SYK*, ORAN*, LW*, BSX*, HCA*, MRK*, GIS*, TEF, COTY, ABBV, RELX, MDLZ, CLX
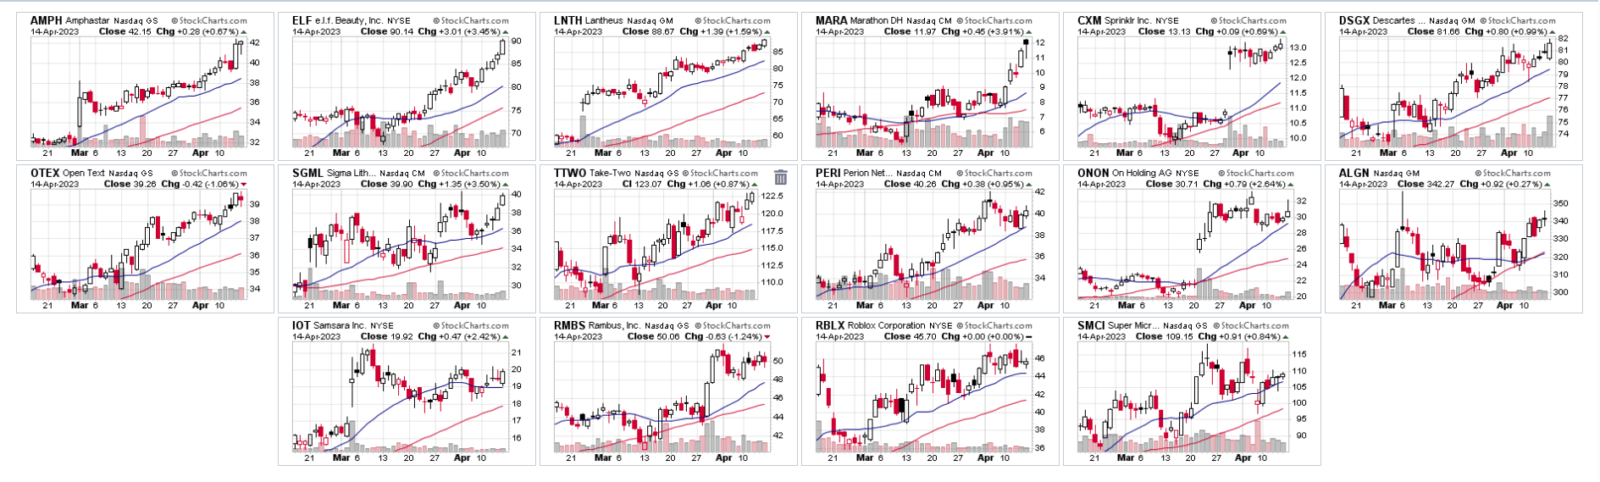
WEEKLY HIGH-BETA/ACTIVE TRADERS LIST:
– listed by daily RSI
– not screened for earnings dates
– based on the stand-alone charts, not as a model portfolio.
– Note: (IOT) was added at 8:00 pm on 4/16/23. https://twitter.com/BlueChipPremium/status/1647750265439678465
AMPH, ELF, LNTH, MARA, CXM, DSGX, OTEX, SGML, TTWO, PERI, ONON, ALGN, IOT, RMBS, RBLX, SMCI
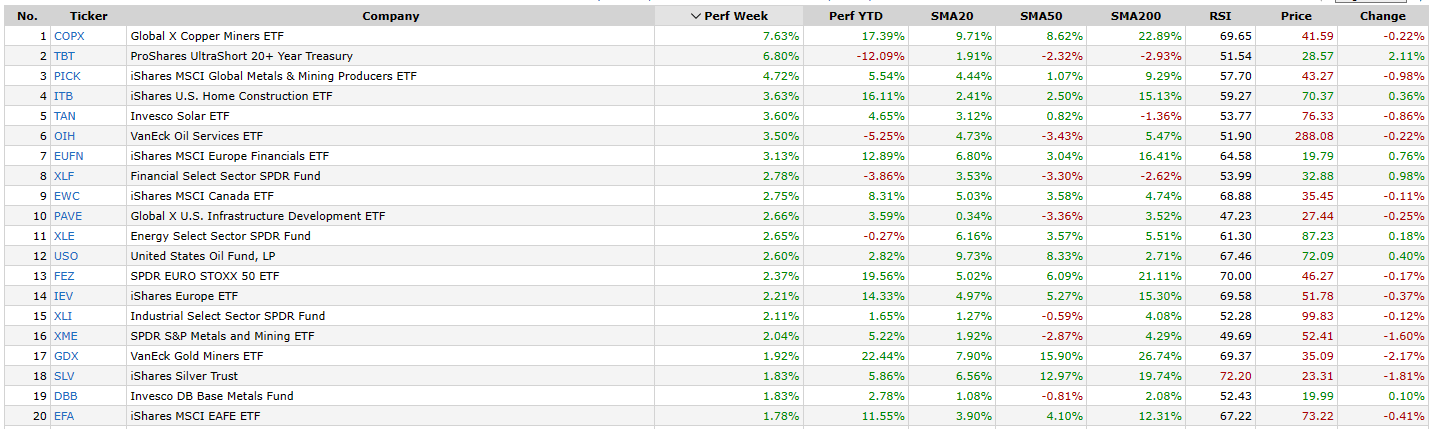
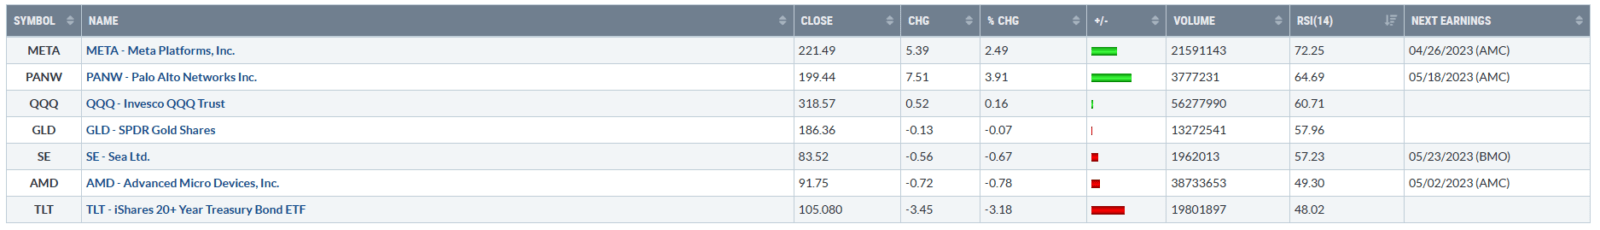
Core tracking ETFs, top 20 performers, last week:
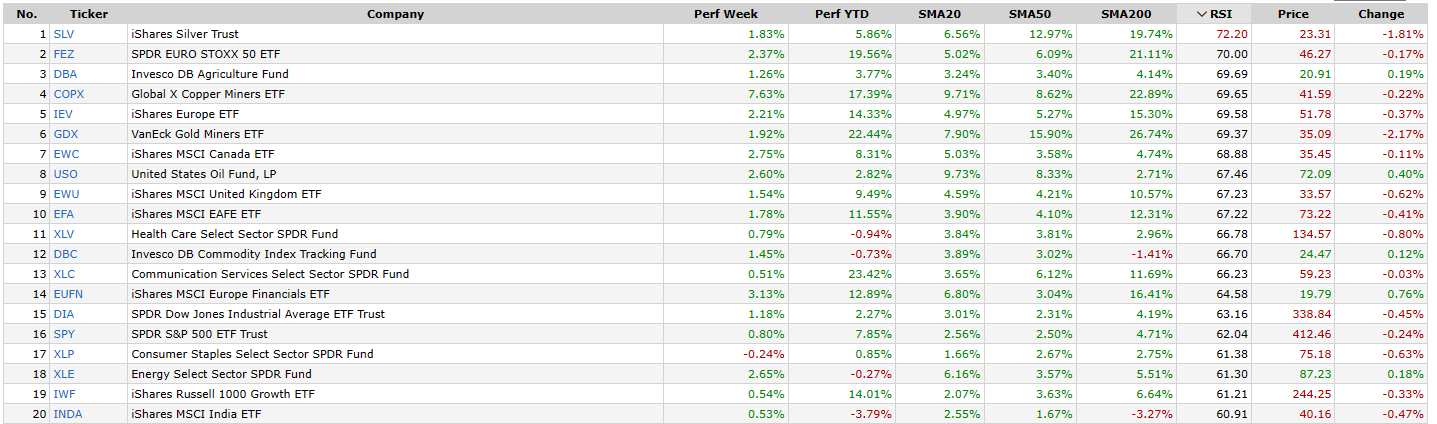
Core tracking ETFs, top 20, ranked by daily RSI:
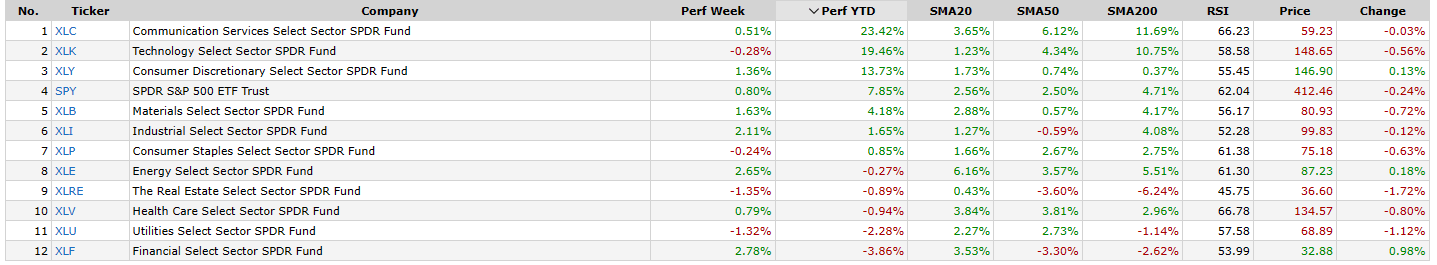
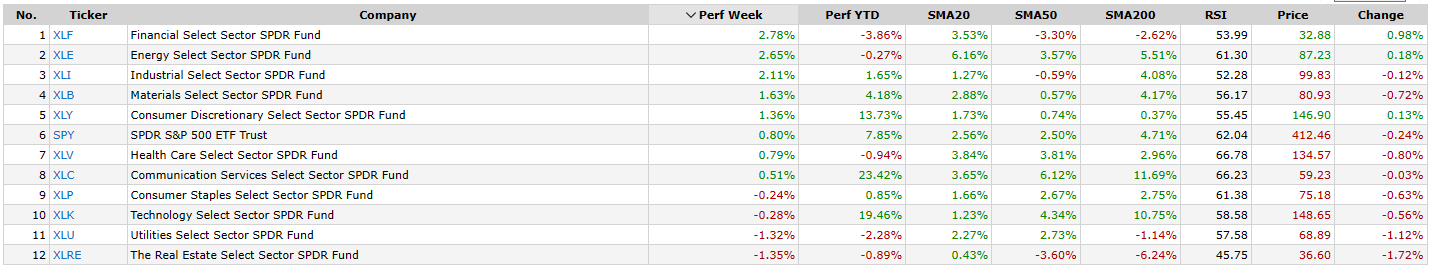
S&P 500 Sectors, sorted by year-to-date performance:
 *ETF data above is from Finviz.com and is assumed to be accurate.
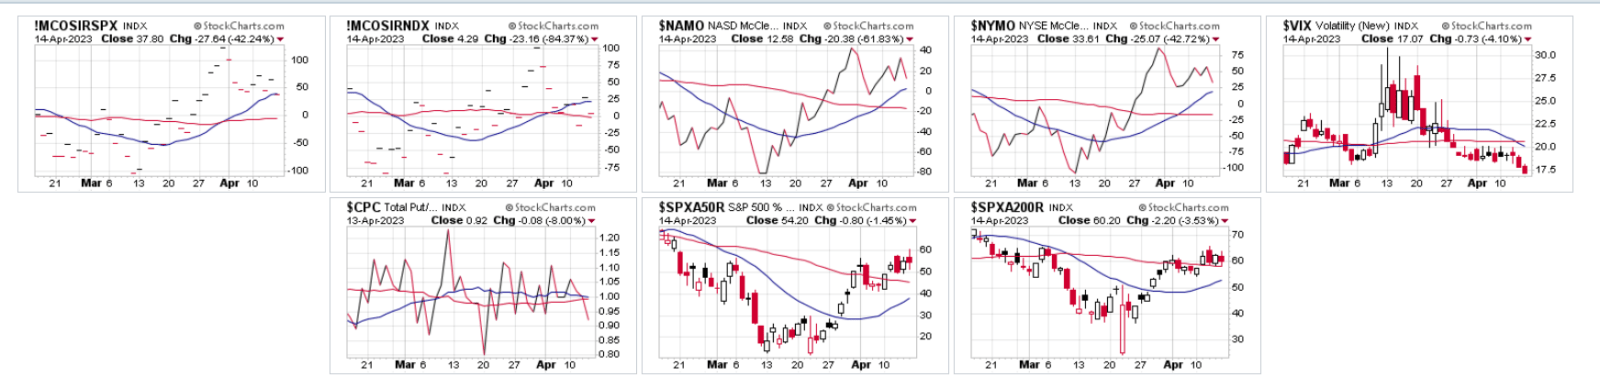
MARKET INTERNALS
- Market oscillators are just above neutral.
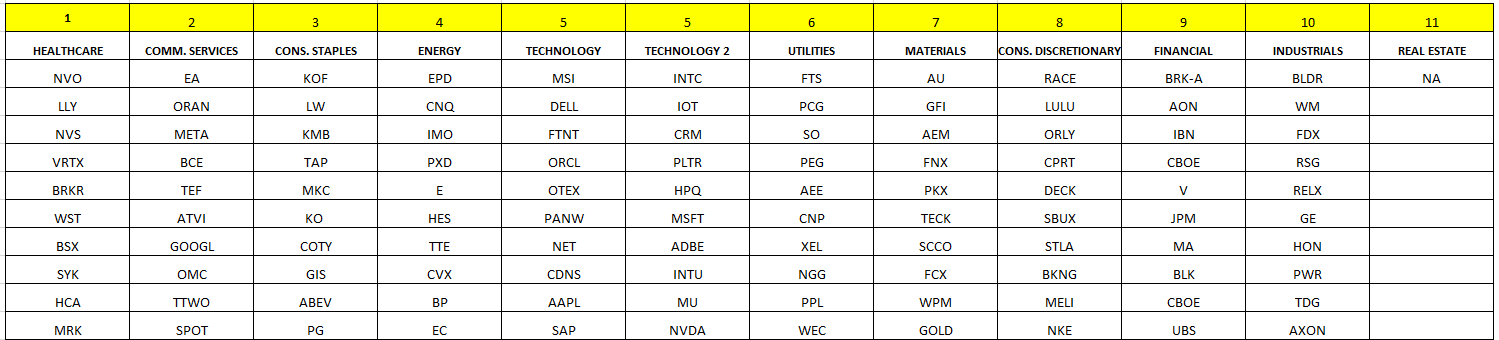
BLUE CHIP DAILY WEEKLY S&P 500 SECTOR RANKING + LARGE CAP FOCUS LIST
- This data is being updated now.
- Stocks and sectors below are ranked by daily RSI – some charts may be extended on a daily basis.
- This list is not screened for earnings dates.
- This list is considered as a select top-ranked large cap uptrends focus list. It is not an absolute list of all large caps.
- All are over the 200-sma. Stocks must be over the 200-sma to be ranked below.
INDUSTRY LONG-TERM TREND AVOID LIST:
- Subprime consumer finance.
WEEKLY MACRO CHARTS:
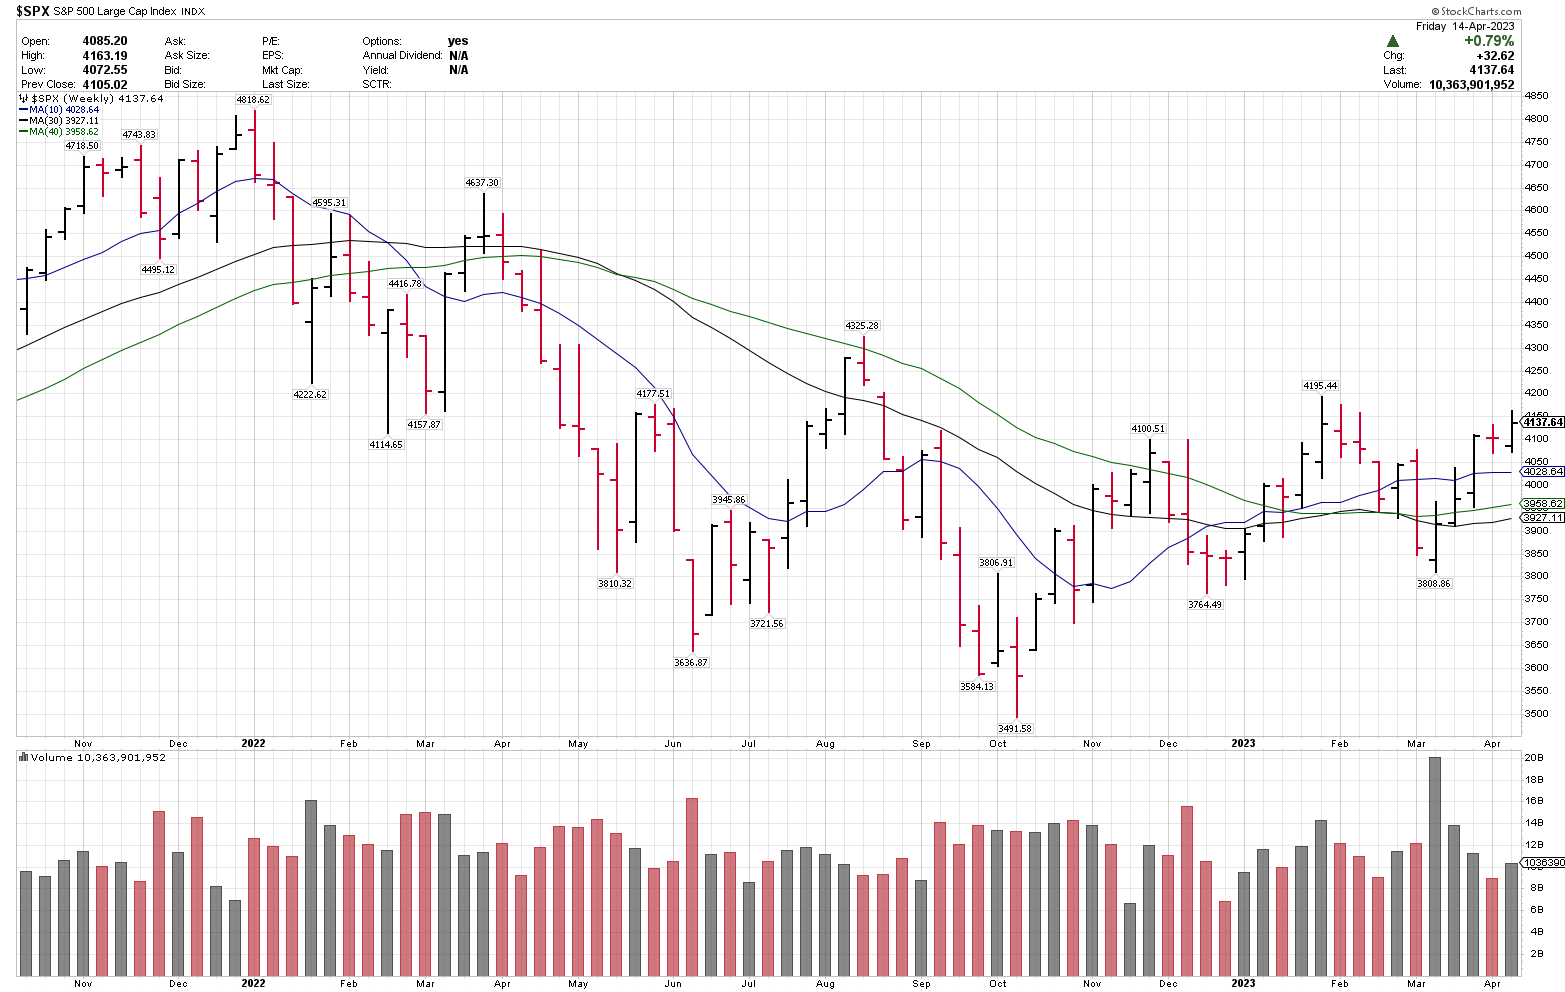
S&P 500 Large Cap Index (SPX)
BCD Trend Rating: Currently over rising 10-week and 40-week MA’s.
(SPX) closed at an 8-month weekly closing high.
Key trend levels: 3900 key support.
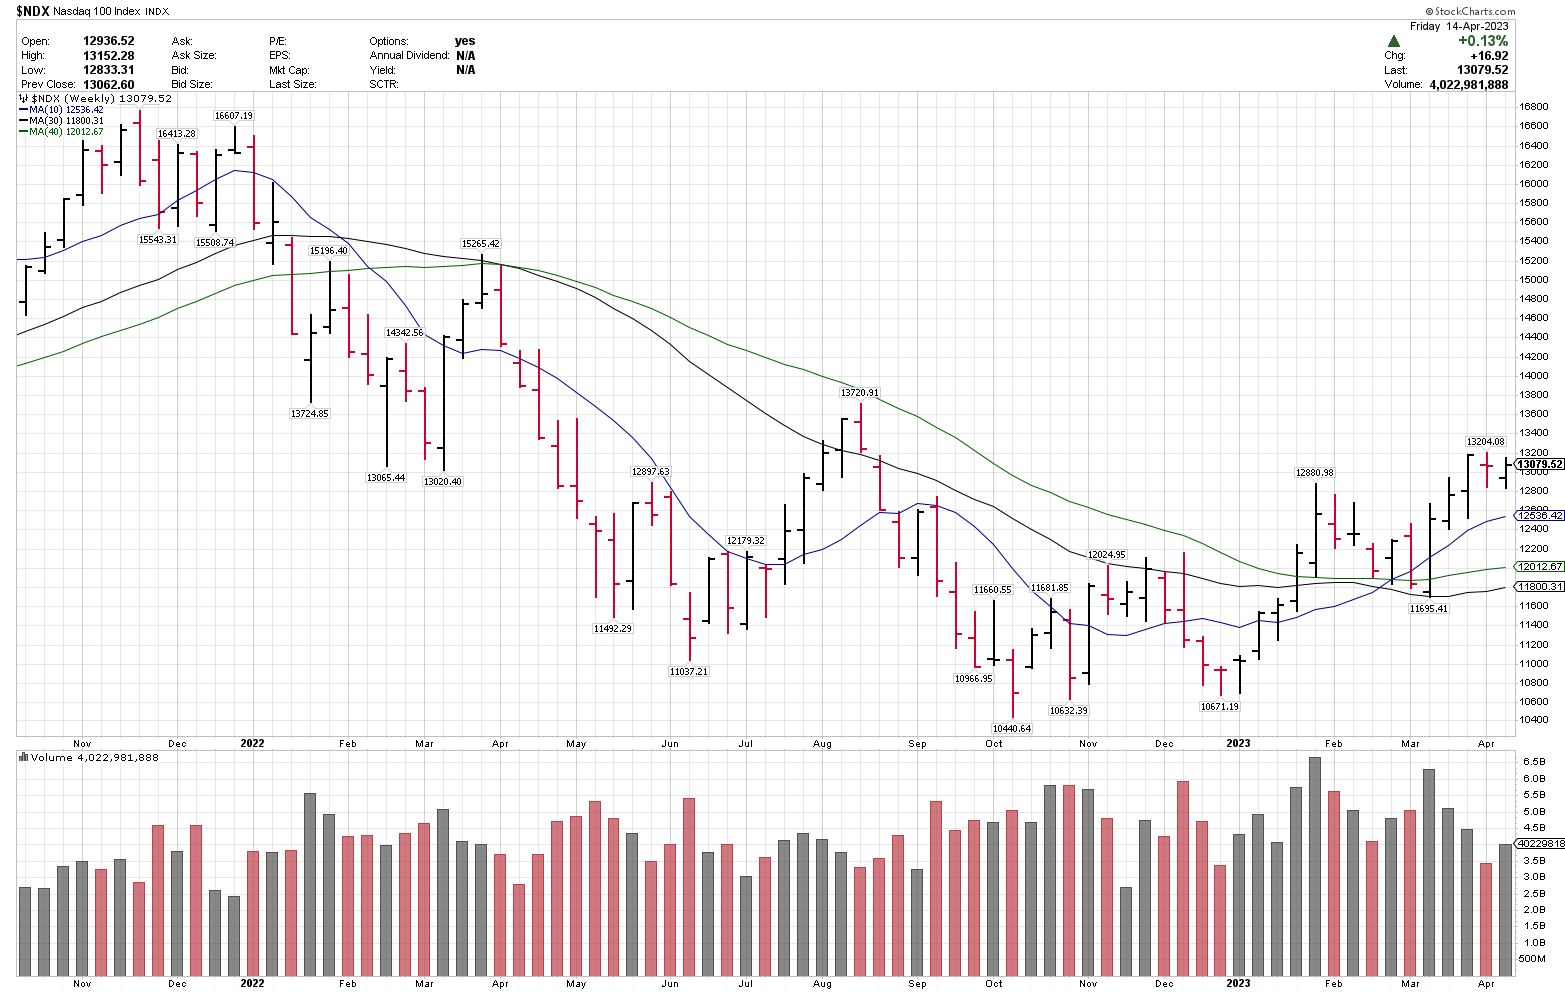
Nasdaq 100 Index (NDX)
BCD Trend Rating: Accumulate.
Key potential support levels: 11500, 12000. Weekly close over 13000.
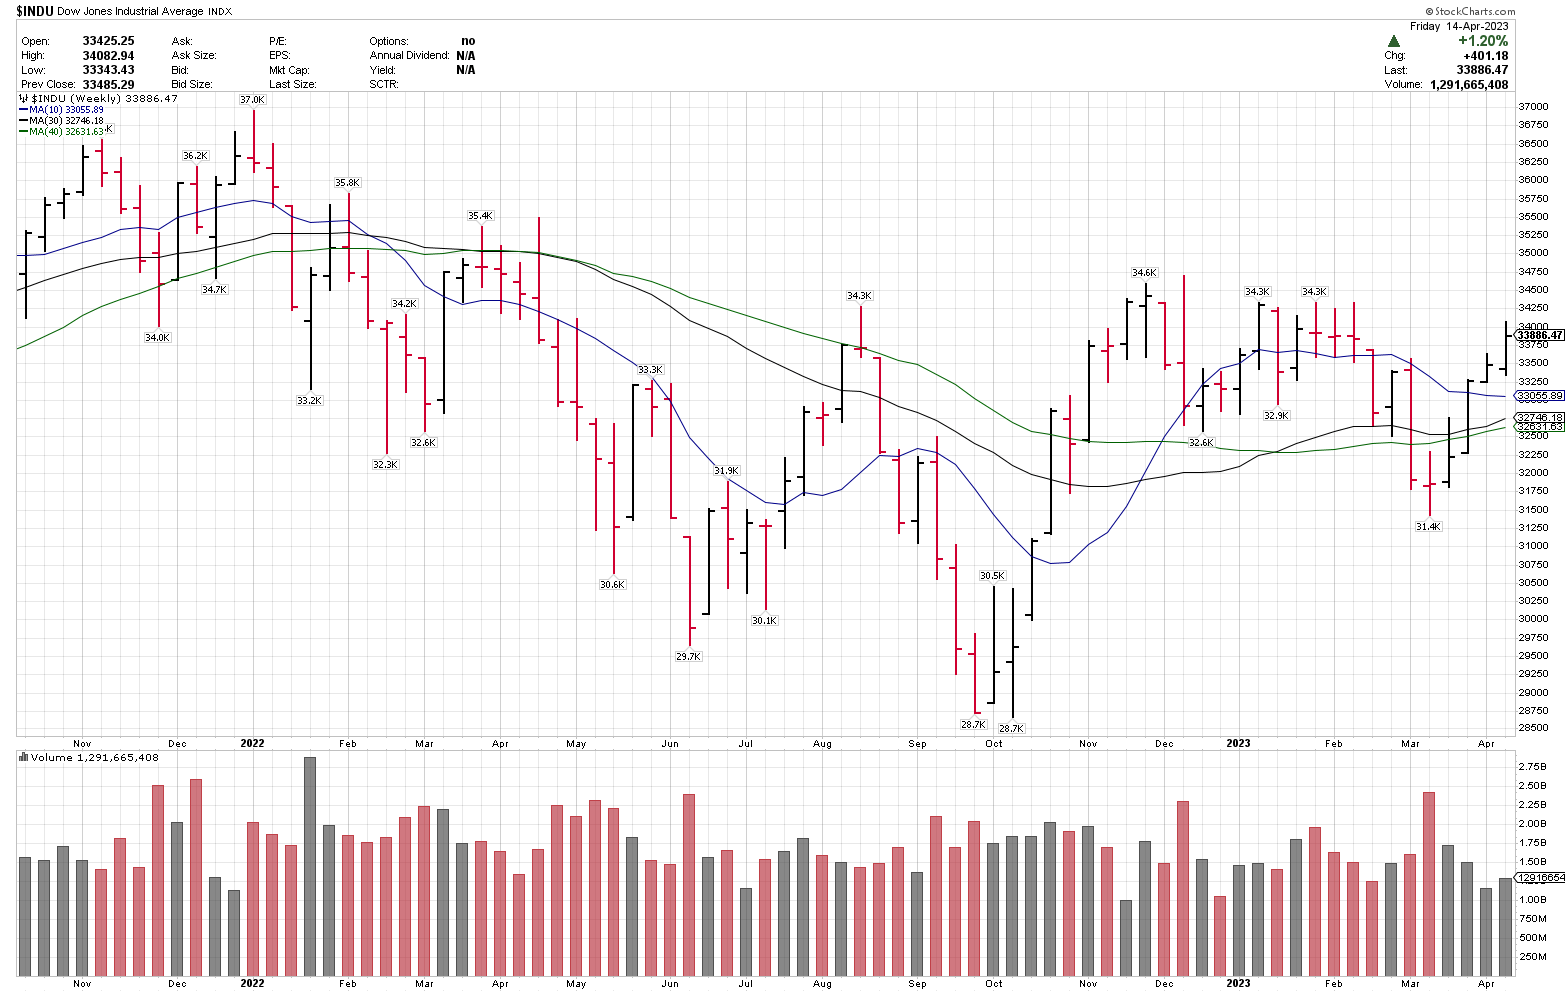
Dow Jones Industrial Average (INDU)
BCD Trend Rating: Neutral. Above 10 & 40-week MA’s.
Key potential support levels: 31400
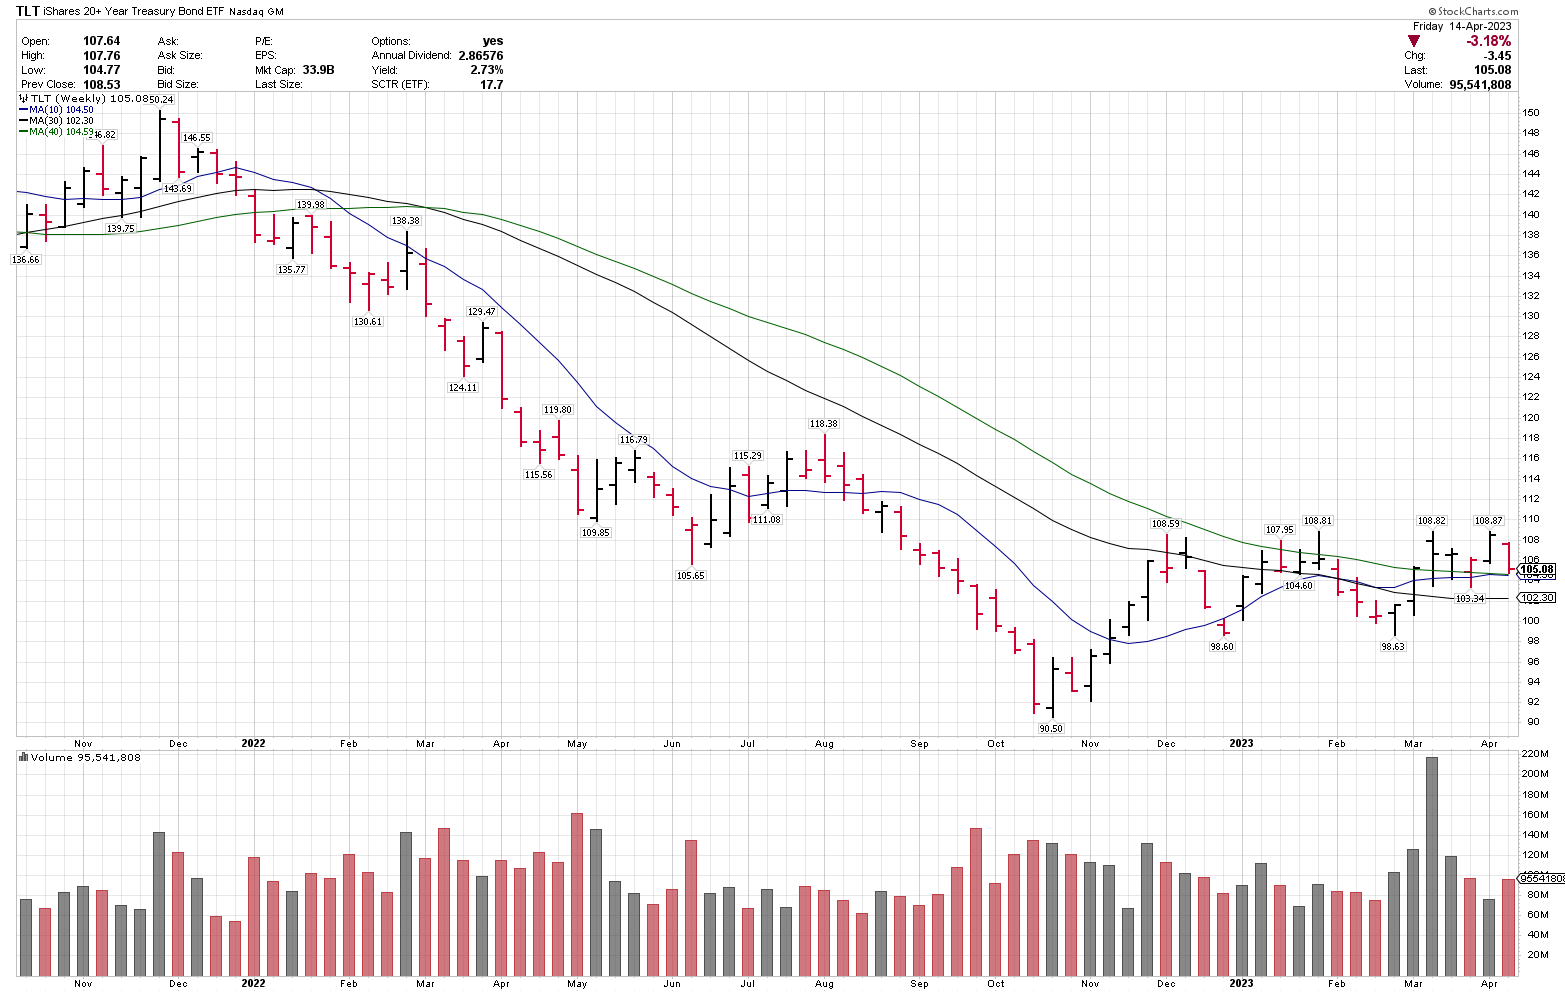
US Treasury Bonds, 20+ Year ETF (TLT)
BCD Trend Rating: Buy over 100.
(TLT) could be trying to put in a longer-term low, if bond yields have peaked, which we believe is the case.
Key trend levels: 98-100 is key technical support. 110 is a key potential breakout level.
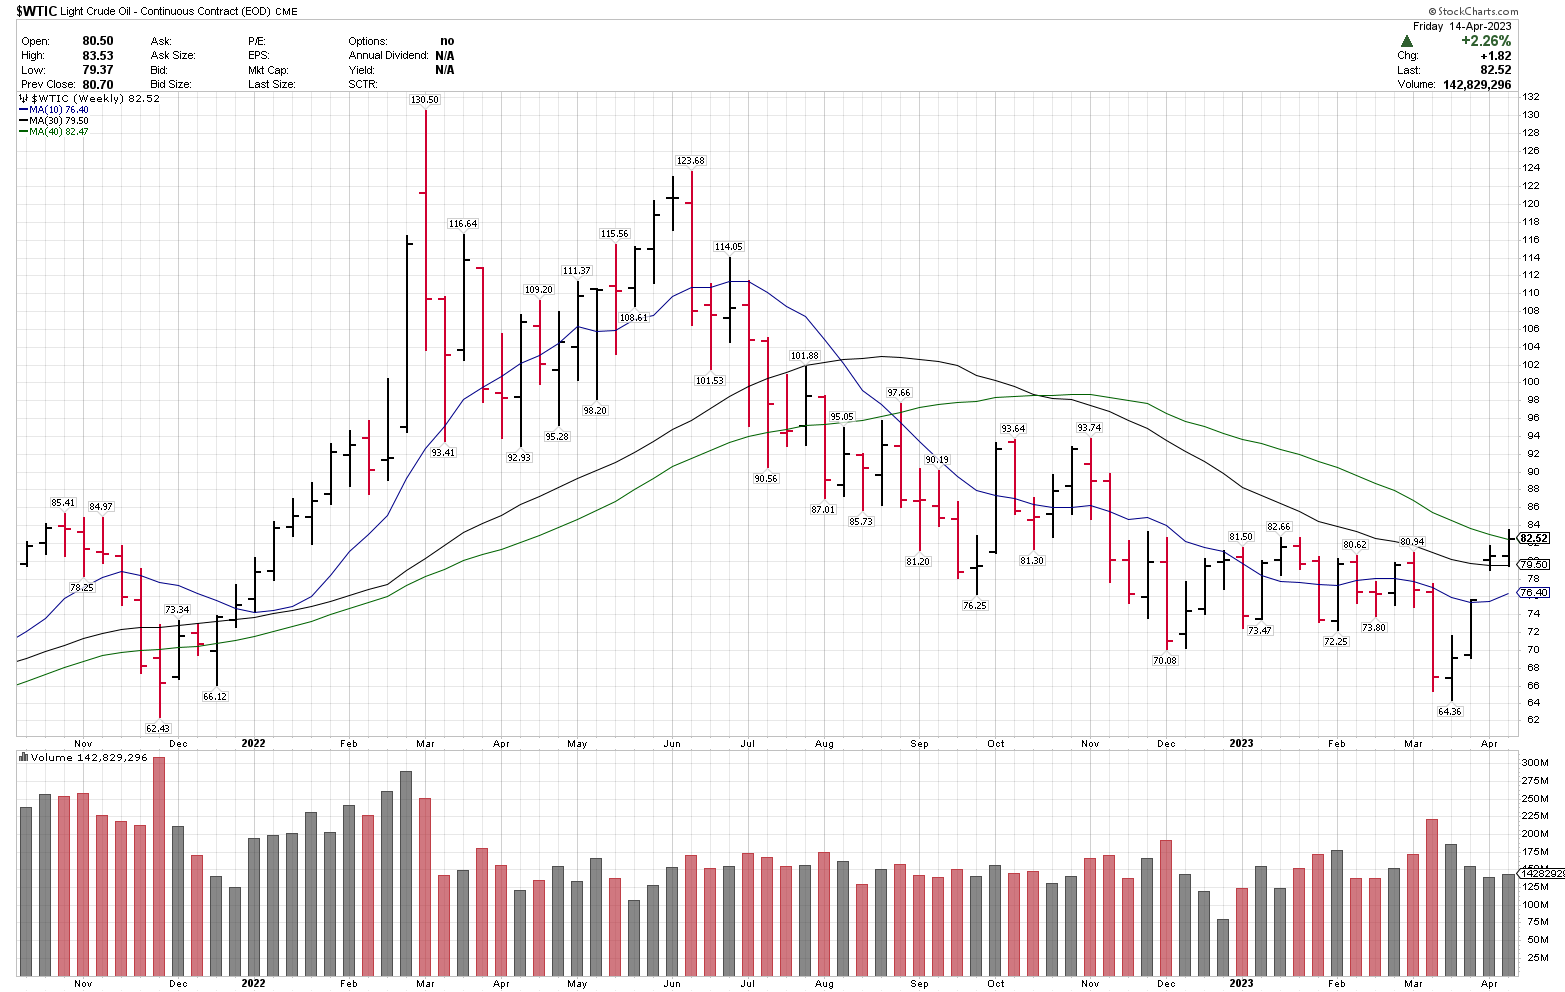
WTI CRUDE OIL (WTI)
BCD Trend Rating: Neutral. 40-week MA reclaim.
Key trend levels: 65-70 support. 84 is a key potential breakout level.
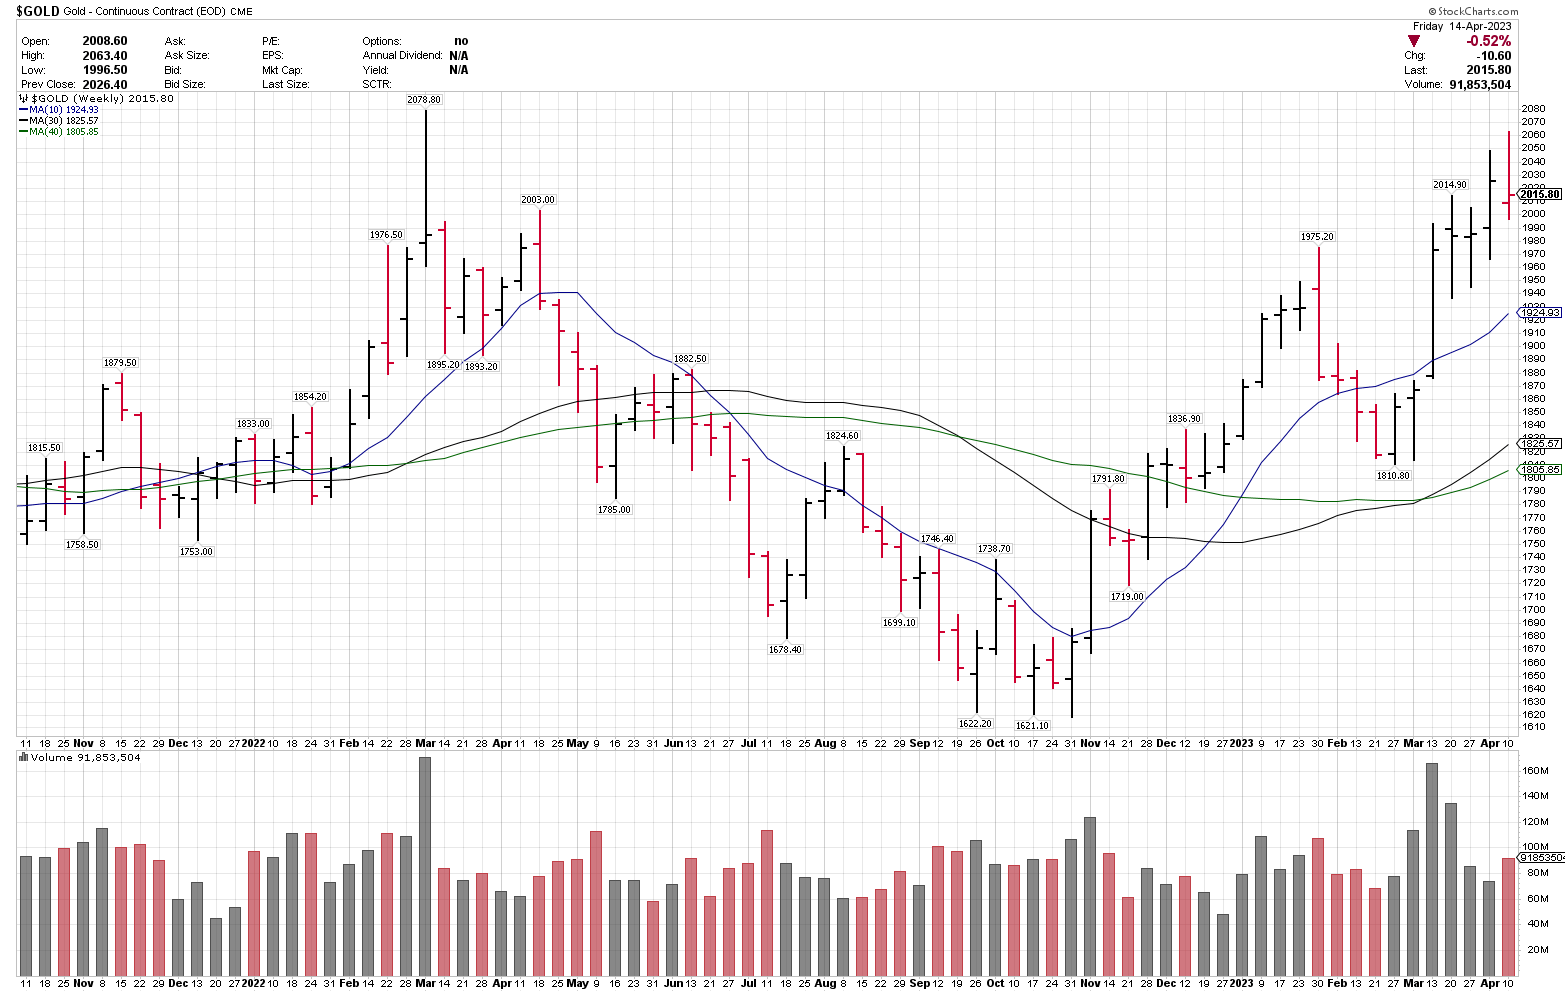
GOLD
BCD Trend Rating: Accumulate.
OPEN POSITION WEEKLY RECAP:
- ETFs could develop into bigger position sizes, going into earnings reporting.
- Weekly data below:
EQUITY MARKETS RECAP
- (SPX) closed +0.79% for the week, (NDX) +0.13%.
- (SPX) closed at an 8-month weekly closing high.
- Major economic data last week was that both CPI and PPI inflation readings came in lower than forecast.
- Financial sector (XLF) was the top S&P performer last week, after well received earnings from J.P. Morgan Chase (JPM), Citigroup (C) and Wells Fargo (WFC).
- The energy sector (XLE) and industrial sector (XLI) were the next two best performers.
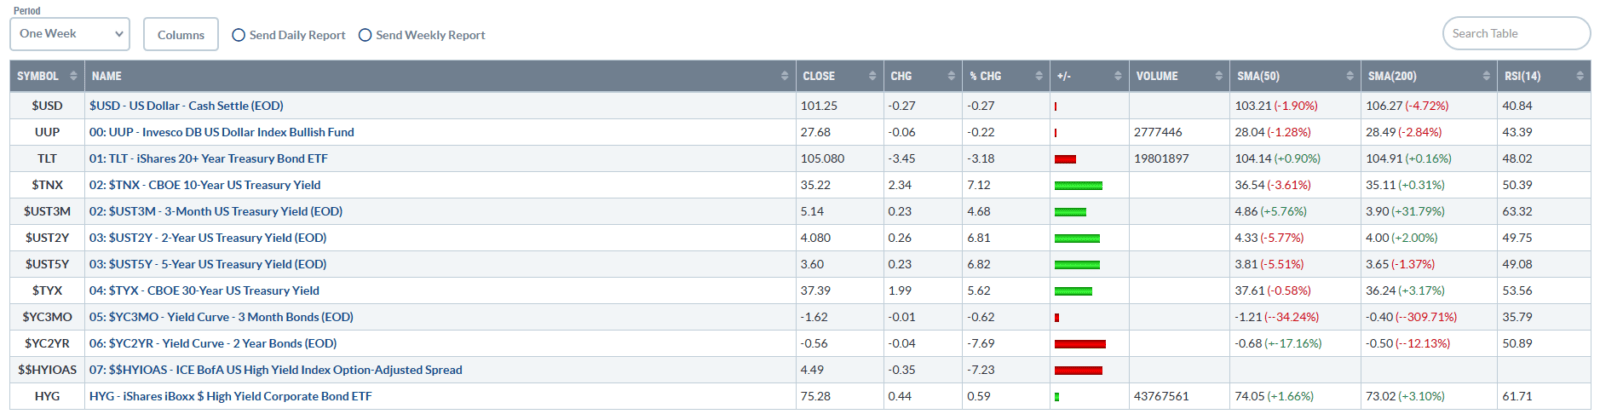
BONDS, US DOLLAR AND THE FOMC
- 10-year UST yields (TNX) closed the week +23.4 basis points, at 3.522. In a near-term pullback, 3.65-3.70 is a potential overhead resistance level, if tested.
- US Dollar index (USD) (DXY) was -0.27% on the week. The lowest weekly close since April 2022.
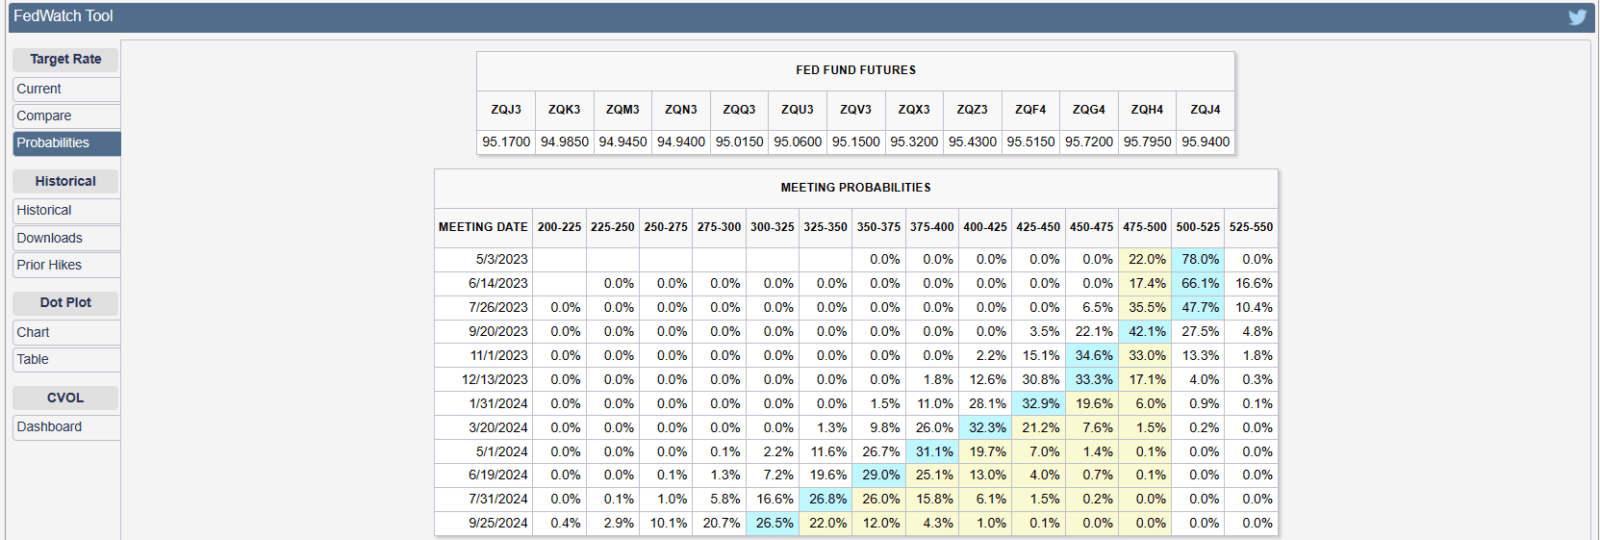
- Current Fed Funds rate is 475-500.
- March CPI was reported on Wednesday, 4/12/23, at 5.0% YOY, vs 5.1% forecast and 6.0% last month.
- The Cleveland Federal Reserve Bank has a real-time April CPI forecast of 5.12 currently.
- The next FOMC interest rate decision is 5/3/23.
- The Fed Funds future market is pricing in 2 rate cuts by the end of 2023, to a target of 450-475. This data can change quickly.
- Our view remains that bond yields have peaked for this cycle.
- Bond market, last weeks data below:
- Fed Funds rate 475-500 currently.
- The next FOMC interest rate decision meeting is 5/3/23.
- Data from the CME Website, below. Link: CME FedWatch Tool – CME Group
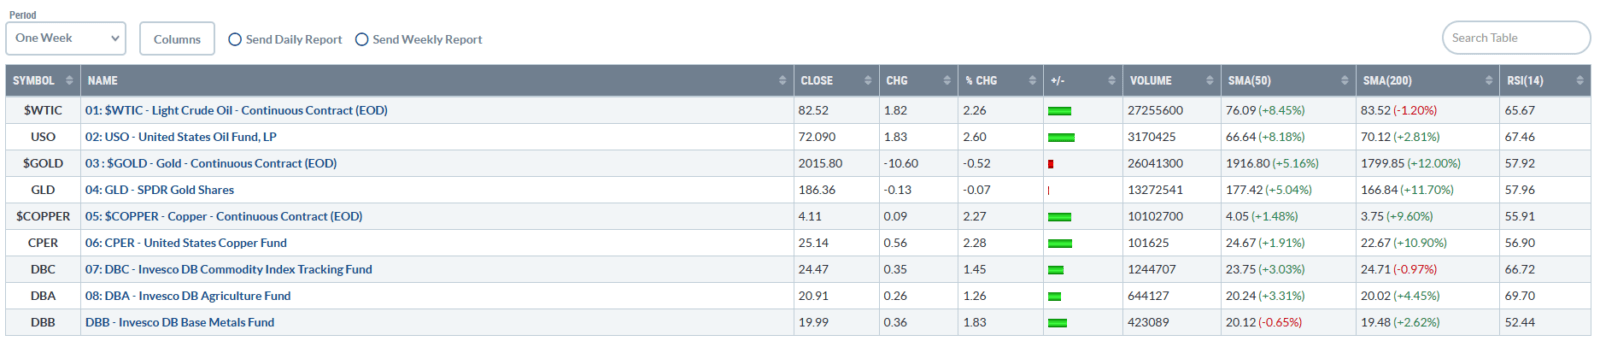
CORE COMMODITY MARKETS RECAP
- Gold remains in a primary uptrend, and reached the second highest daily close on record last week. Wide ranges and pullbacks can be expected in the uptrend.
- Gold has been a recent beneficiary of banking sector turmoil and lower bond yields and (USD).
- Gold and gold miners remain on the weekly Best Ideas ETF list.
- Crude oil (WTIC) closed just above the 40-week MA and is trying to breakout from a stage 1 base and recent downtrend. A close over 84 could signal stage 2 breakout attempt.
- BCD tracking commodity markets, last week’s data below:
Six key items to watch this coming week:
- 1. The financial sector – daily news flow from this sector has diminished over the last three weeks, but can lead to wide market swings. Last week’s major bank earnings were well-received.
- 2. (SPX) ideally to stay over 4000. (QQQ) ETF to stay over 305.
- 3. (TNX) bond yields vs 3.65 to 3.70 overhead.
- 4. WTI crude oil vs 84 on a closing basis, which would be a constructive sign if reached.
- 5. Major corporate earnings next week include American Express (AXP), Bank of America (BAC), Netflix (NFLX), Schlumberger (SLB), and Tesla (TSLA), among many others. Earnings reports can lead to wide ranges in single stocks, sectors and/or indices, in either direction.
- 6. Key economic data next week includes: March Housing Starts (Tuesday), jobless claims (Thursday) and April PMI data (Friday).
SECTOR and INDUSTRY OVERVIEW
Top 5 sectors that are on watch and/or on our potential buy/add list this week – not listed by daily RSI.
- 1. Technology
- 2. Communication services
- 3. Gold and gold miners
- 4. Healthcare
- 5. Cyclicals (discretionary, energy, industrials and materials).
—– - Top ranked lower-volatility groups: US Treasury bonds, gold, healthcare and Europe large-caps.
- Top ranked higher-volatility groups: Technology, communication services, and gold miners.
- —–
- (SPX) 3900-4100 remains a key technical range level. (SPX) closed at 4137.64.
- (TNX) vs 3.65-3.70 is a key technical level.
- US Treasury Bonds (TLT) (TNX): A potential long-term low is in for (TLT), but this market could be volatile over 98-100.
- Crude Oil: (WTIC) (USO) Recent oversold bounce. Key overhead level is 84.
- Gold (GLD): Maintaining the breakout over 1900.
- Our plan is to stay tactical, with a 50-60% target cash range, over the next 2-4 weeks, as market conditions dictate. ETF positions could be increased in size. Higher cash to account for high volatility.
- ETFs are a viable alternative for those who want to remain more tactical.
- Key levels to watch this week: (SPX) ranges 3900-4100, (TNX) vs 3.30 to 3.70, (USD) 100 to 106.
ADDITIONAL CHARTS COVERED IN TODAY’S VIDEO:
Have a great week,
Larry Tentarelli
President and Founder, Blue Chip Daily Trend Report