4/18/20
Publisher’s Note: The following Weekly Trend Report & Video is being made available to the public, in it’s original form, for a limited time. In the video, our strategic overview to scale back in starts at 8:10.
WEEKLY TREND REPORT
3/14/20
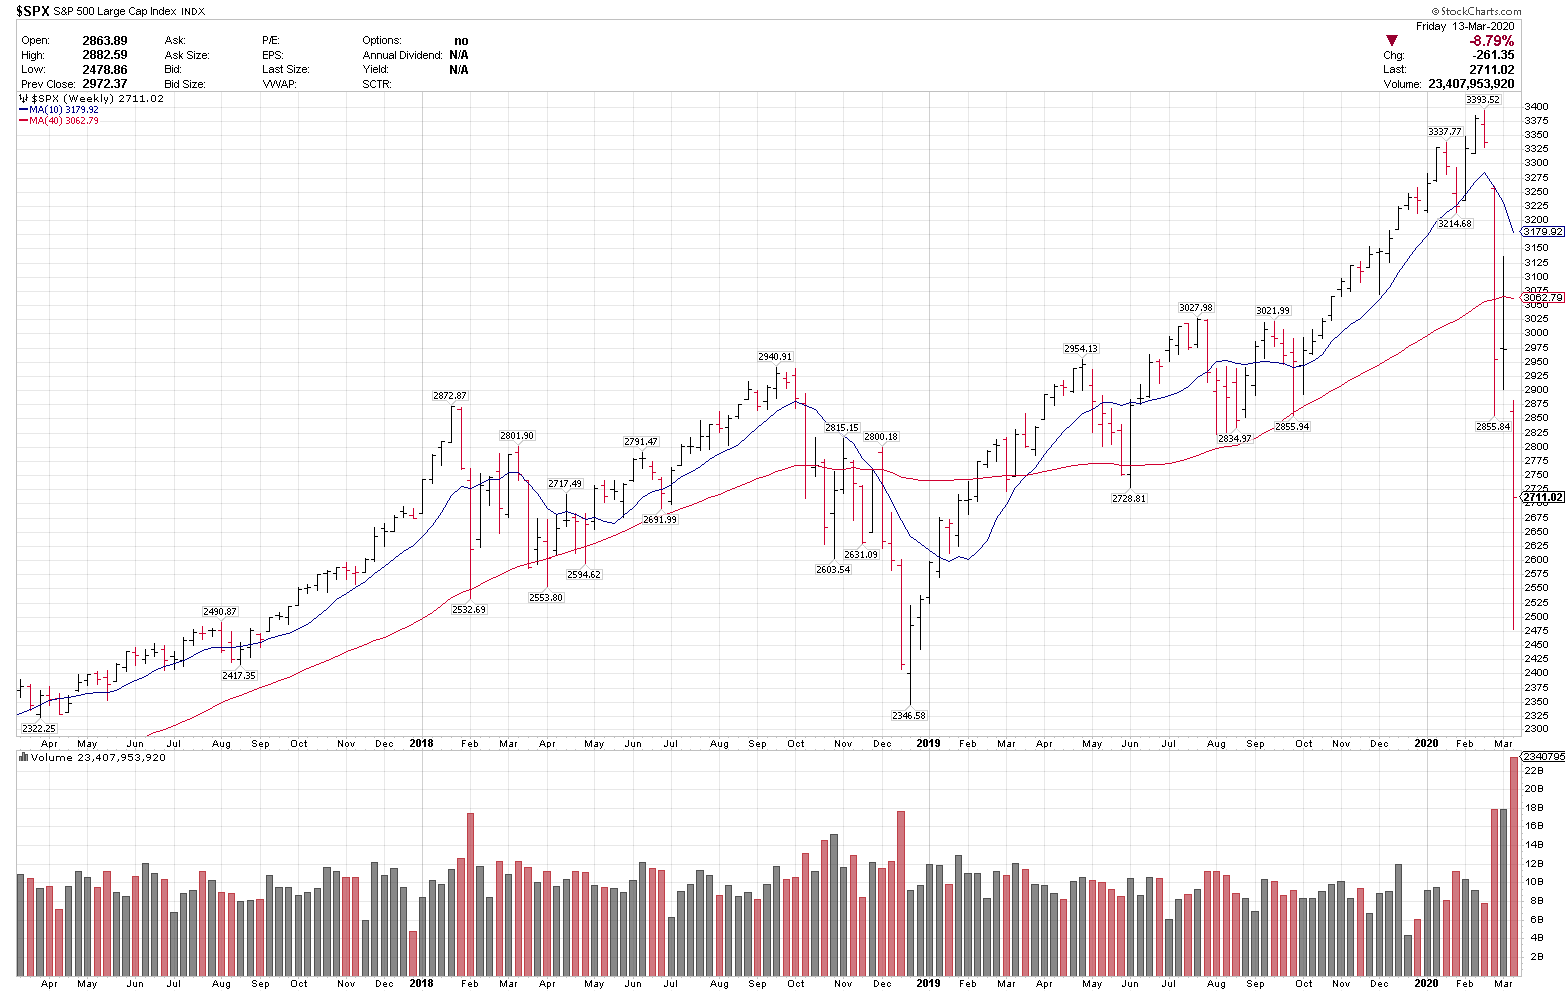
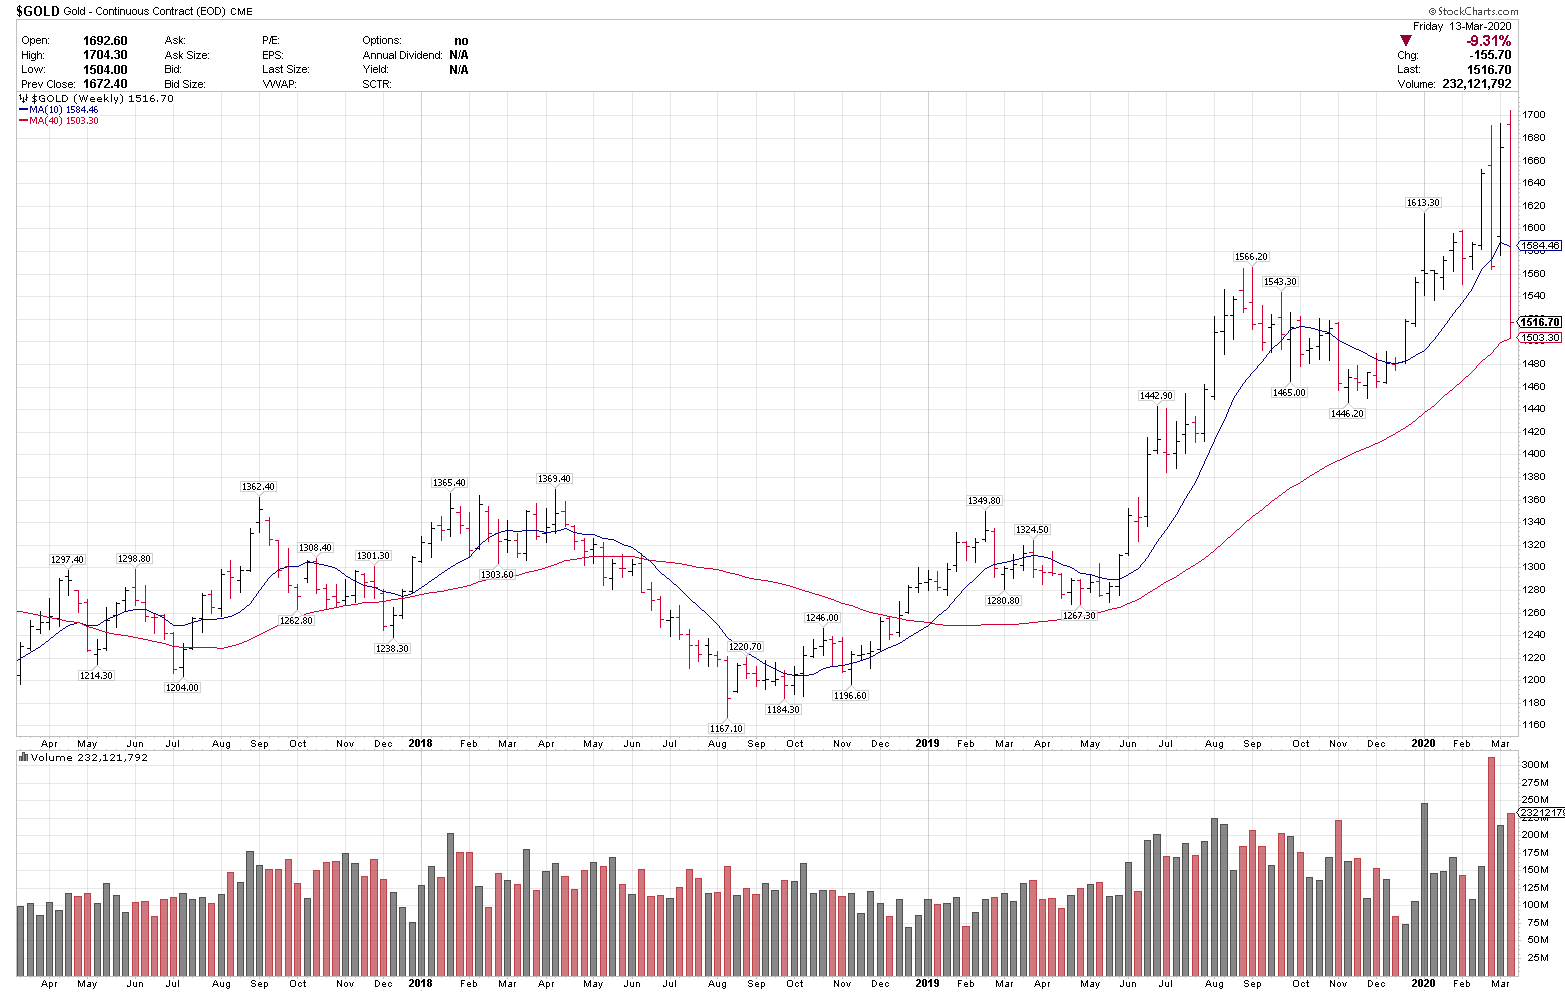
Markets sold off for the week, with $SPX -8.79% to close at 2711.02, Nasdaq -8.17% to close at 7874.88, 10-year UST yields moved up from .0701 weekly to .951, Gold was -9.31% on the week at 1516.70, and Crude oil was -23.13% to close at 31.73. While the equity weakness was being telegraphed by weaker charts that were breaking down and last week’s close below the 200-day moving in the $SPX, traditional ‘risk off’ US Treasuries were also down on the week. In times of weaker equity markets, USTs usually outperform, but did not this week, in what is being reported as a liquidity crunch among large institutions, in a ‘sell everything, hold cash’ environment. A more detailed analysis is here: https://www.bloomberg.com/news/articles/2020-03-14/traders-nightmare-liquidity-vanished-when-they-needed-it-most
WEEKEND VIDEO: https://youtu.be/tPzzZw28BhU
Our defensive positioning in equities vs the S&P 500 sell off, starting on 2/25, has continued to be on the correct side of avoiding this downtrend, https://bluechipdaily.com/daily-trend-report-2-25-20/ but the move into ‘risk off’ assets $TLT, $GLD and $FXY are not playing out yet as expected. The ‘risk off’ positioning was correct, but in either case they are having minor drawdowns for now. Cash balances are still very high, at 78%, and high cash plus no new single stock buys since 2/22, $SQM, or ETF positions since 3/02, $QQQ has helped as well. I continue to believe that high cash balances, and reduced or no equity market activity, has been the best offset for this volatility.
WHERE ARE WE NOW?
There are many recent developments in the risk vs reward equation. Investing, trading and financial markets ultimately come down to a series of risk vs reward scenarios and probabilities.
Price: The S&P 500 corrected 26.9% in 16 trading sessions, the fastest correction of that magnitude from all-time highs ever, (3393 on 2/29 to 2478 on 3/13), and was -16.6% for the week at Thursday’s low. One positive of this, is the further that prices come down, the more discounting of bad news gets priced into the market. This means that markets have dropped this fast to try to factor in the coming economic slowdown and “bad news”. I am not going to try to predict when the low is, and as simplistic as it sounds, the lower the price gets, the closer we are to the equilibrium point of the bad news being “priced in”. The low could be in now at 2478, or at any level lower, nobody at all knows for certain, but as prices come down, the odds get better longer term. Market lows are very easy to spot in hindsight. Trying to time the bottom is not something that I try to do. Those who try to call the bottom usually get it wrong, as there can only be one true low, and they usually expend a lot of capital on the way down on the failed calls.
Central Bank policy: The US Federal Reserve and Treasury announced various easing and stimulus programs this week, that commits anywhere from $1.5 to $5.0 Trillion in extra stimulus, liquidity and easing into the financial system. The ECB, Bank of Canada, and Bank of Japan, among many others have committed to rate cuts and other stimulus measures. As COVID-19 is a global healthcare and economic issue, global central banks are working together with massive stimulus programs.
The FOMC meets this week and the Fed funds futures market is pricing in a full 1.00% cut in the Fed funds rate, to follow on last week’s .50% emergency cut. These massive actions by Central Banks have been needed as liquidity has contracted globally. While these stimulus measures can not ‘stop the markets from going down’, they can serve to slow the tide, as we saw on Friday, and also give aggressive large short sellers reason to pause, and the $SPX 11% swing and Australia $ASX 12% 24 hour reversals showed.
At some point, it should be expected that we get to the other side of the healthcare issue and the stimulus will still be in the system. The Central Banks can not pull back the liquidity right away to risk falling backward, and massive easing usually leads to big upside moves in risk assets. Trying to time the final low, or the start of the move higher is the unknown.
Economic risk: I want to reiterate my view, that while I am going to discuss the financial and economic impact of COVID-19, it is first and foremost a human and health issue, and do not want my discussion of the economics of it, to imply that I am not aware of and sympathetic to the human toll, because I am.
The biggest risk to markets here, and I believe the reason for the record selloff, is that markets are still having a very difficult time pricing in the impact of countries basically ‘shutting down’ for most businesses. I can not speak to other countries, but in the U.S. we are adjusting now for schools shutting down, many being told to work from home, travel being cancelled, conventions and professional sports season being suspended, which is alot of lost revenue, and alot of emotional strain and uncertainty for many. Markets try to price in reward and risk, and because this is an unprecedented issue for us of a global coordinated slowdown, the volatility is extraordinarily high.
Plan going forward:
Our view is that there are two ways to approach equity markets here, especially when looking to allocate high cash:
1. Wait for more clarification and until all of the ‘bad news’ is out of the system. We still don’t know what we don’t know, and the news could be expected to get worse before it gets better. There is no way to gauge the economic impact here. I have traded through all market conditions since 1998, and this is not a “garden-variety” regular pullback. Volatility is near record levels and cash is a great buffer.
The other side of that equation is when markets finally put in the low, we won’t know it for some time, as many will doubt that the low is the low, and at that point markets can move 10-15% off the low and leading stocks 15 – 20%, in a short period of time before they commit cash, and then some will ‘wait for the retest’ which doesn’t always happen and the get into the cycle of not wanting to ‘chase’ higher. Market timing all at once is a difficult longer-term strategy. Many were still waiting to buy the retest from the 2008 and 2018 lows that never retested.
2. Building longer term positions on a scale in basis. Sitting on a high cash balance of close to 80%, I am not going to ‘look for the low’ and then commit all of my capital or even a majority of it at one time. What my plan is here is to start to look to build smaller, longer-term positions on a scale in basis in a few core names over the next few weeks. If my normal position size in single stocks is 4-5% of assets, I will start at 2.5%. If normal stops are the 12% range, I will be at 15-20%. Normal risk that is .50%, will be that or less. Similar to when I started the Newsletter account, on a scale in basis.
I am focused on the Tech SPDR ETF, $XLK, Apple, $AAPL and/or Microsoft, $MSFT. My plan over the next week or two, may be to commit 5-10% combined of my 78% cash to smaller starter positions, into one or two of these names, with wider stops with a total risk of 1.0%, so if the market drops 2, 5 or 10%+, I have risked 1% total.
If these positions start to work, and markets give bottoming signals, then I can always scale more in. If not, and markets continue lower, than I have risked 1%. While I know exactly what technical signals to look for at signs of the low, I would rather follow my scale in process that try to call the bottom.
Either of these strategies can work, and I do not recommend what anyone should do or not do. I only share my insights and general commentary. I am not going to make any directional market calls. Whatever the next 10-20% move is in $SPX, it will not really surprise me. I do continue to expect high volatility and wide ranges. I did not wake up on 2/25 or any day before and say it is time get 100% out of stocks, as the stops and exits do that. Some will claim they did just that, but they likely also did just that significantly lower many times before. I am also not going to come in and say it is time to commit 100% of my capital on one day. We scaled out as stops started to go off, and a scale in process makes the most sense for me as well.
I do know that trying to make all-in, bottom calls, or all-in time to buy calls in very high-volatility markets is a bad idea. I have very little faith in anyone’s ability to call the exact low, or pinpoint the exact day to start to deploy capital.
FOCUS/AVOID SECTORS
My key focus are here on the equity side is technology, primarily high cash position leaders than can withstand an economic slowdown, and that are technically positioned well, which is $AAPL and $MSFT. Outside of that, $GOOGL, $AMZN, $NFLX and $SHOP are top longer term ideas at some point. Given that there has been a reset on everything, I want to focus on my best ideas. or ‘put my best players on the field’. On any resolution or stock market recovery, most stocks can go up very quickly and the markets may put in a low before all of the ‘bad news’ is out of the way. It can get complicated, but scaling in small to top ideas helps to simplify the process.
Semiconductors and hardware are more vulnerable in a slowdown, so I will wait there, but $AMD and $NVDA are top ranked technically. Healthcare would be the second sector of interest, due to it’s more defensive characteristics, and the China Internet space is showing relative strength, and may be least impacted by a U.S. slowdown. Outside of that all, other sectors are still on a wait and see basis.
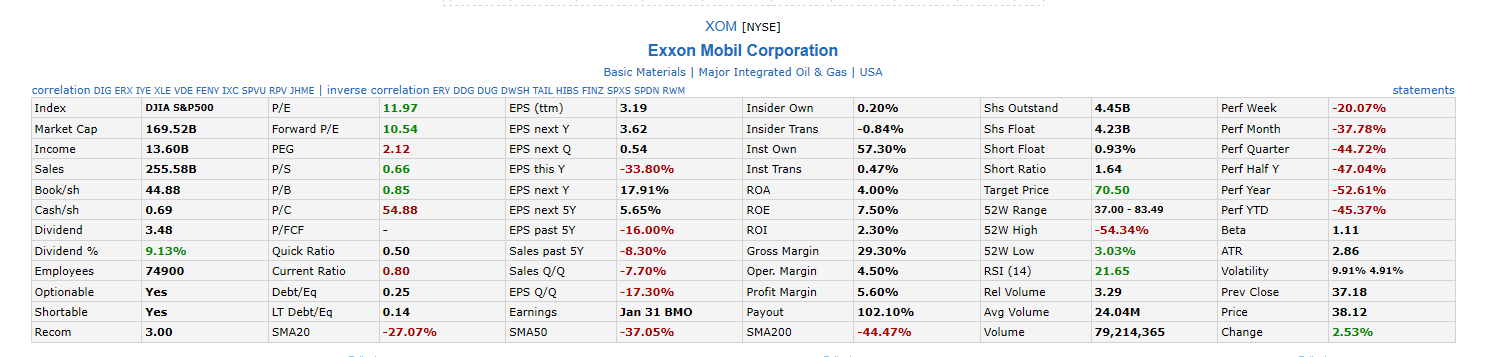
Banks, energy, consumer discretionary and travel and tourism have been very weak, and I am avoiding those groups here. The one exception, for a longer-term idea is $XOM, which currently yields 9.13%, reported net income of $13 billion for the last year and has little longer term debt, so the dividend should be predictable. The stock is -45% YTD and of all the companies that will get through an energy crunch, that is my highest probability idea. All stocks can go lower, but as a total return longer-term idea, this is on my screen.
I am avoiding all other energy names, travel and tourism, and crude oil, as the OPEC countries are having issues, and crude oil is the most vulnerable in any slowdown. If crude stays under $40, many mid-tier names will likely not make it. The way that I approach markets is I don’t try to determine if a name/group will ‘go up’ or not, I just determine if it fits my process. If it doesn’t fit my process, than I pass. These energy names, airlines or cruise lines could turn out to be huge winners, I am not saying that they can’t, but they don’t fit in with what I do. I am looking for the strongest names that have held up technically the best, not the weakest names that have gone down the most. At some point into a confirmed recovery, I may reevaluate those names, but not here or any time soon. Banks could be under pressure for some time, but $JM and $BAC at some point will be on the consideration screen.
SUMMARY
Risk vs reward has improved with $SPX dropping 26%, and Central Banks are going to use all of their tools to flood the system.
News flow is very volatile, we likely have more bad news, before good news, but I don’t try to predict news flow or manage my money based off of it.
The economic impact can not be determined at this time.
I continue to expect very high volatility and 5%+ or more up/down days in $SPX would not surprise me, neither would the direction of the next 10-20% move in $SPX.
I am planning to gradually scale in to a one or two of my best longer term ideas on a reduced size and reduced risk basis over the next few weeks.
WEEKLY CHARTS AND CORE MARKETS PRICES BELOW
10-YEAR UST YIELDS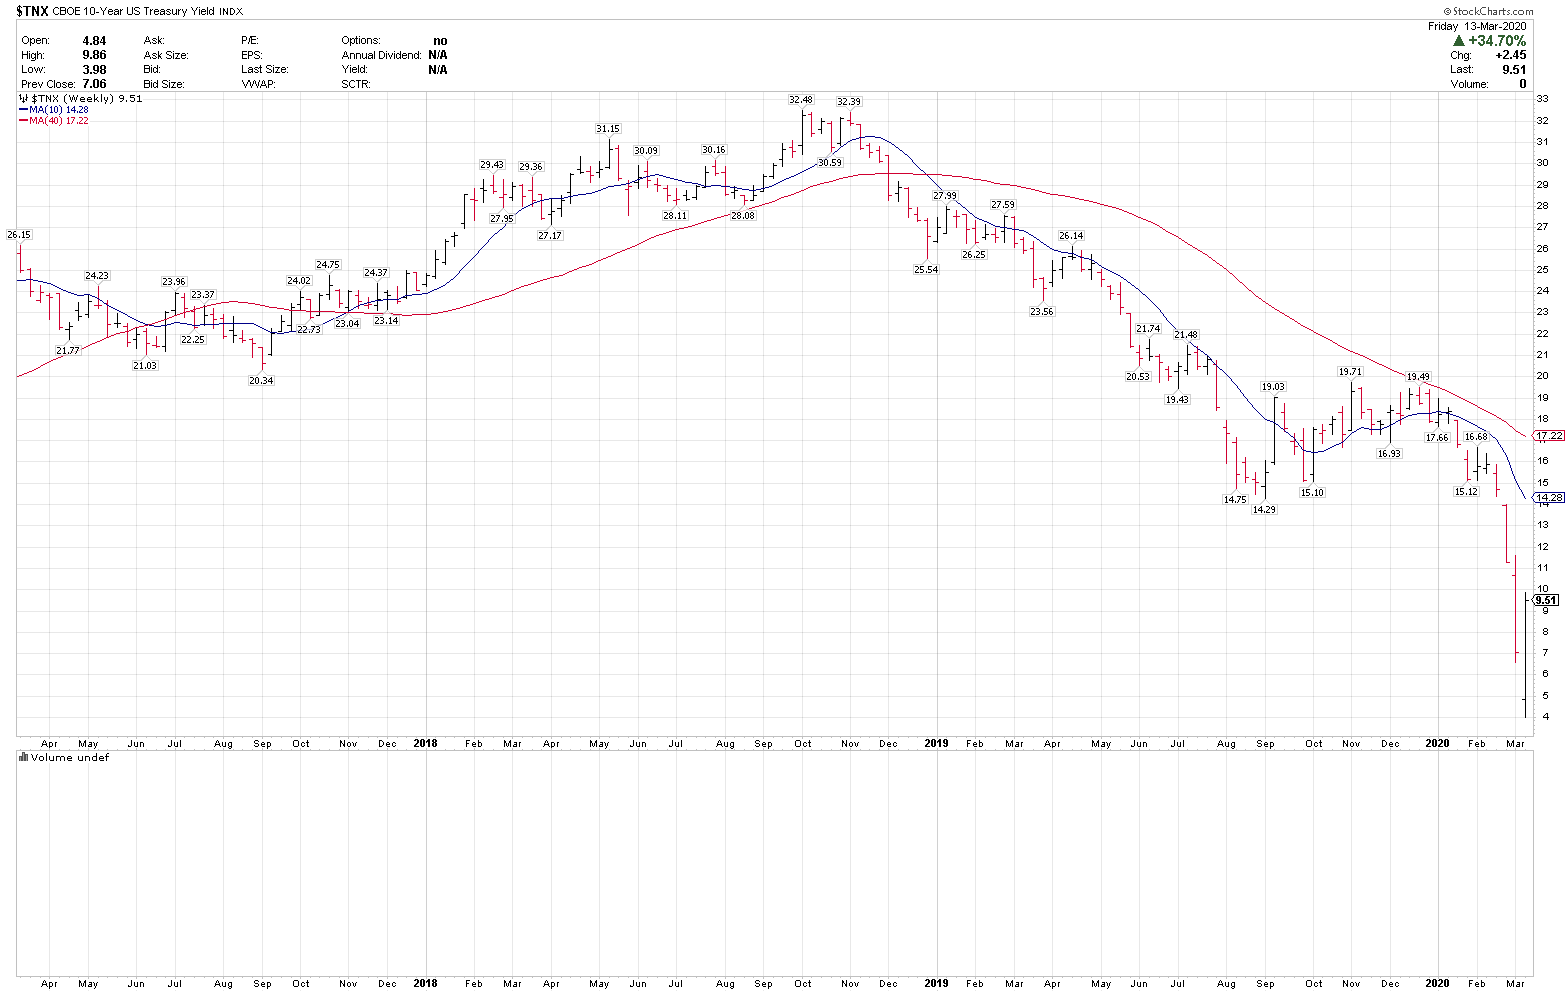
GOLD WEEKLY
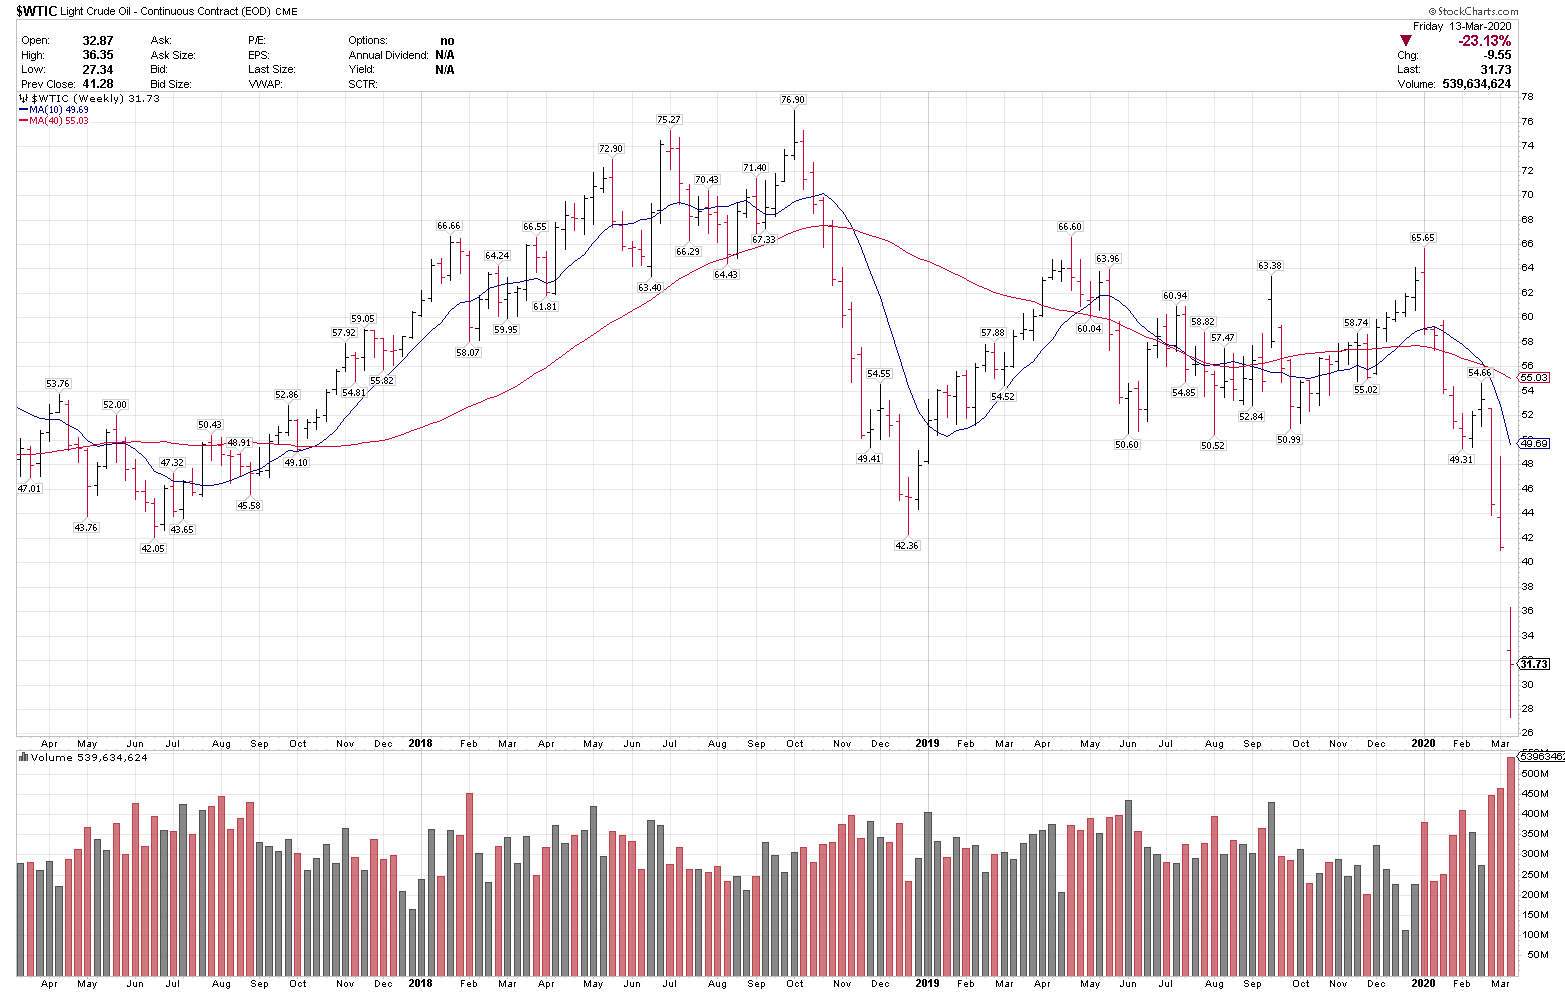
CRUDE OIL WEEKLY WTI
| MARKETS WEEKLY | CLOSING PRICE | CHANGE | % CHANGE | TREND | OVER 40 WK |
| S&P 500 | 2711.02 | -261.35 | -8.79 | D | N |
| Nasdaq | 7874.88 | -700.74 | -8.17 | D | N |
| Dow Industrials | 23185.62 | -2679.16 | -10.36 | D | N |
| 10-year UST Yields | .951 | .245 | 34.70 | D | N |
| WTI Crude Oil | 31.73 | -9.55 | -23.13 | D | N |
| Gold | 1516.70 | -155.70 | -9.31 | U | Y |
| US Dollar Index | 98.90 | 2.97 | -3.10 | N | Y |
| *ETFs* | |||||
| SPY | 269.32 | -28.14 | -9.46 | D | N |
| QQQ | 192.34 | -15.68 | -7.54 | D | N |
| EEM | 36.14 | -3.99 | -9.94 | D | N |
| VGK | 43.64 | 8.31 | -16.00 | D | N |
| GLD | 143.28 | -14.27 | -9.06 | U | Y |
| GDX | 19.00 | -10.41 | -35.40 | U | Y |
| TLT | 153.94 | -12.83 | -7.69 | U | Y |
| USO | 6.96 | -1.77 | -20.27 | D | N |