Weekly Markets Video: https://bit.ly/BCDWeeklyVideo11925
Top 25 list: https://bit.ly/WeeklyTop25List11925
ETF Focus list: https://bit.ly/WeeklyETFFocusList11925
Lower Volatility Sectors list: https://bit.ly/WeeklyLowVolList11925
High Beta List: https://bit.ly/HighBetaList11925
Core Artificial Intelligence (AI) Focus Group, current today, 1/19/25, updated on 12/22/24: https://bit.ly/BCDCoreAITop12TrakingList
(This is a tracking group and watchlist only. Not all charts are considered actionable at all times).
Frequently used terms:
(SPX): S&P 500 Index
(NDX): Nasdaq 100 Index
(INDU) Dow Jones Industrial Average
(TNX): CBOE 10-year US Treasury Yield
(FOMC): Federal Open Market Committee, “The Fed”
(DMA/SMA): Daily Moving Average
WEEKLY SUMMARY, 1/19/25
Weekly Chart Trends:
SPX/NDX: Bullish, weekly uptrend intact.
Bonds: Neutral to bearish.
Gold: Bullish, weekly uptrend.
Crude oil: Neutral/improving.
Bitcoin: Bullish, weekly uptrend.
——
CORE MARKETS OVERVIEW
- This was a bullish week for the S&P 500 index (SPX) and Nasdaq 100 index (NDX), with both up by over 2.8% on the week.
- 87% of SPX stocks and 85% of NDX stocks were higher for the week.
- I attribute this to four key factors:
– The December CPI report was well received. Core CPI was down vs November for both the month-over-month and year-over-year time frames. It is one thing to beat the forecast, but if the forecast is still higher vs the prior month, than there is no real progress. To come in lower vs the prior month does show progress.
– 10-year US Treasury yields (TNX) were – 6.9 basis points on the week and are -20.0 basis point since the intraweek high. The lower CPI readings led to this constructive pullback in yields. Higher yields have recently been a bearish headwind for stocks.
– Corporate earnings reports from financial sector majors JP Morgan Chase (JPM), Goldman Sachs (GS) and Citigroup (C) were all well received. Similar with tech sector and AI bellwether Taiwan Semiconductor (TSM).
– The AAII Investor Sentiment Survey had the most bearish reading since the November 2023 market lows. The AAII survey, at the extremes, is considered a reliable contrarian indicator. Post here
– SPX breadth was very strong all week. Over 5 days this week, the average daily upside breadth was 72%. All 5 days were up by 68% or more. This is a sign of bullish accumulation by fund managers. Post here
EQUITIES
- This was a bullish week overall, as outlined above. There are risks, as detailed below, but this looks to be at least a tradeable low, if not more.
- Markets are going to focus now on earnings reports, with over 40% of the S&P 500 scheduled to report over the next three weeks. That number will probably move higher as earnings dates are confirmed.
- Our top ranked sectors or industry groups: financials (big banks and brokers), technology (Artificial Intelligence (AI) related), energy (natural gas and pipelines), utilities (nuclear and independent power producers).
- Top ranked higher-beta groups: Bitcoin and related stocks.
BONDS AND RATES
- Treasury bonds (TLT) are still in a long-term downtrend. They may have found a longer-term floor right now, but the chart is not on our but list to the current downtrend.
- 10-year UST yields (TNX) pulled back on the week, as outlined above, but we expect the trading range to be 4.25%-5.00% for the first quarter of 2025.
COMMODITIES
- Gold remains buy rated.
- Crude oil is neutral on the weekly trend, but has been outperforming recently.
- Natural gas remains rated “speculative buy”.
FOMC/THE FED
- We expect the Fed to stay on hold for the first quarter of 2025, with no changes in the overnight rate.
- At the January 29 FOMC press conference, we expect Jerome Powell to stay on the “data dependent” message with no change in views.
- Labor market strength continues, jobless claims are low and the economy shows no signs of weakness, so there is no catalyst to cut rates here.
- The Fed funds futures market is pricing in72.4% odds of no rate cut in the first quarter of 2025. Link here:
INFLATION
- Inflation remains sticky, but there was slight progress last week with Core CPI down from November.
- Inflation still looks too high however to warrant a rate cut currently.
BITCOIN
- We remain bullish here and expect new highs within the next few weeks.
BIGGEST RISKS TO OUR CURRENT VIEWS
- A major earnings miss or series of misses.
- A sharp upside reversal in yields.
Key watch points:
-
- 1/ Treasury yields and the U.S. Dollar.
- 2/ Quarterly corporate earnings reports.
- 3/ Incoming inflation, jobs and economic data.
The first quarter of the first year of the U.S. Presidential cycle is often weak, but higher, below. Not all stocks and sectors will follow the index.
– Seasonality is never a guarantee or a prediction. Current charts are always the best guide.
– First posted here 1/5/25.
Source: Ryan Detrick/Carson Research

INDEX MCCLELLAN OSCILLATORS
– The SPX oscillator is near the high end of the daily range, but not anything that I view as relevant overall.

CORE MACRO MARKETS, WEEKLY RECAP

BLUE CHIP DAILY MARKET/SECTOR OVERVIEW, 1/19/25
These are intermediate-term (2-4 month) trend views, not short-term market calls. Short-term volatility and/or pullbacks are possible.
Top ranked individual stock ideas are posted to our weekly focus lists, (Top 25, Low Volatility, High Beta, ETF).
BUY/ACCUMULATE is considered constructive here or on standard pullbacks.
HOLD/ADD is positive.
NEUTRAL is no bias either direction.
“Confidence rank” 1 = high, 2 = average, 3 = neutral

U.S. KEY ECONOMIC CALENDAR
Full calendar, source: U.S. Economic Calendar – MarketWatch

OPEN POSITIONS RECAP:
- Tracking page: Open Positions – Blue Chip Daily Trend Report
- Cash: ~4%.
- Target cash allocation is 1-3%.

THIS WEEK’S TOP 25 LIST:
- Standard stop losses are 8%-12%.
- These charts are selected based on their current trends, not as an overall market call.
- Each chart is ranked on a stand-alone basis. This is not a suggested model portfolio.
- The charts are listed below by daily RSI.
- This list is not screened for earnings dates. Earnings dates should be verified.
- An asterisk (*) is considered an extended chart or potentially higher volatility, at time of posting.
- Charts link: https://bit.ly/WeeklyTop25List11925
JBL, BSX, GEV* JPM, HWM, WFC, MTZ, MPLX, CAH, MS, WMB, ENB, WSM, MRVL, ANET, VST*, SE, DAL, GOOGL., SPOT, TSM, AMZN, TSLA*, META, PLTR*

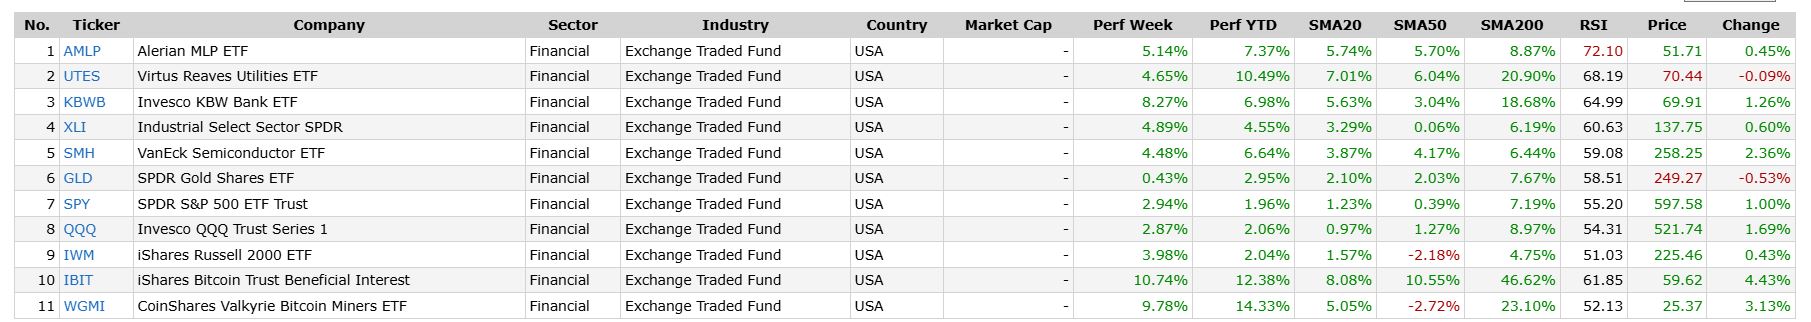
THIS WEEK’S ETF FOCUS LIST
- Standard stop losses are 8-10%.
- These charts are selected based on their current trends. This is not a short-term market call.
- All charts are subject to pullbacks or higher volatility at any time.
- Each chart is ranked on a stand-alone basis. This is not a suggested model portfolio. There is often sector overlap.
- The charts are listed below by daily RSI.
- An asterisk (*) is considered an extended chart, or potentially higher volatility, at time of posting. Two asterisks (**) is highest volatility/speculative.
- Any chart that closes below the 50-dma is considered under review.
Charts link: https://bit.ly/WeeklyETFFocusList11925
AMLP, UTES, KBWB, XLI, SMH, GLD, SPY, QQQ, IWM
High-volatility/or speculative: IBIT, WGMI
WEEKLY LOWER-VOLATILITY SECTORS LIST:
- Standard stop losses are 10%.
- Listed by daily RSI
- These charts are selected based on their current trends, not as an overall market call.
- Based on the stand-alone charts, not as a model portfolio
- (*) = extended chart or higher volatility possible/earnings.
- Not screened for earnings dates. Earnings dates should be verified. Any chart posted within 20 days or less, ahead of earnings, is considered a watch-list chart.
- Any chart that closes below the 50-dma is considered under review.
- Charts: https://bit.ly/WeeklyLowVolList11925
ETR, BSX, CAH, HSBC, BK, PRMB, PODD, BJ, WMT

WEEKLY HIGH-BETA and SMALL CAP LIST:
- Standard stop losses are 12-15%.
- Listed by daily RSI.
- Based on the stand-alone charts, not as a model portfolio
- These charts are selected based on their current trends, not as an overall market call.
- (*) extended chart or higher volatility.
- This is a very high volatility list. Wide single stock ranges are always expected. This list is compiled for those looking specifically for high volatility, often speculative stocks.
- Not screened for earnings dates. Earnings dates should be verified. Any chart posted within 20 days or less, ahead of earnings, is considered a watch-list chart.
- Any chart that closes below the 50-dma is considered under review.
- Charts: https://bit.ly/HighBetaList11925
AR, KTOS, CRK, CRS, CLS, RBLX, HOOD, CEG, TLN, CYBR, SMTC, CRDO, DDS, TDS, SN, BROS, VRT, SNOW, NET, MSTR, RDDT, COIN

WEEKLY CORE MACRO CHARTS:
S&P 500 Large Cap Index (SPX)
Weekly trend rating: Buy/accumulate.
10-week MA trend rating: Uptrend.
40-week MA Trend Rating: Uptrend.

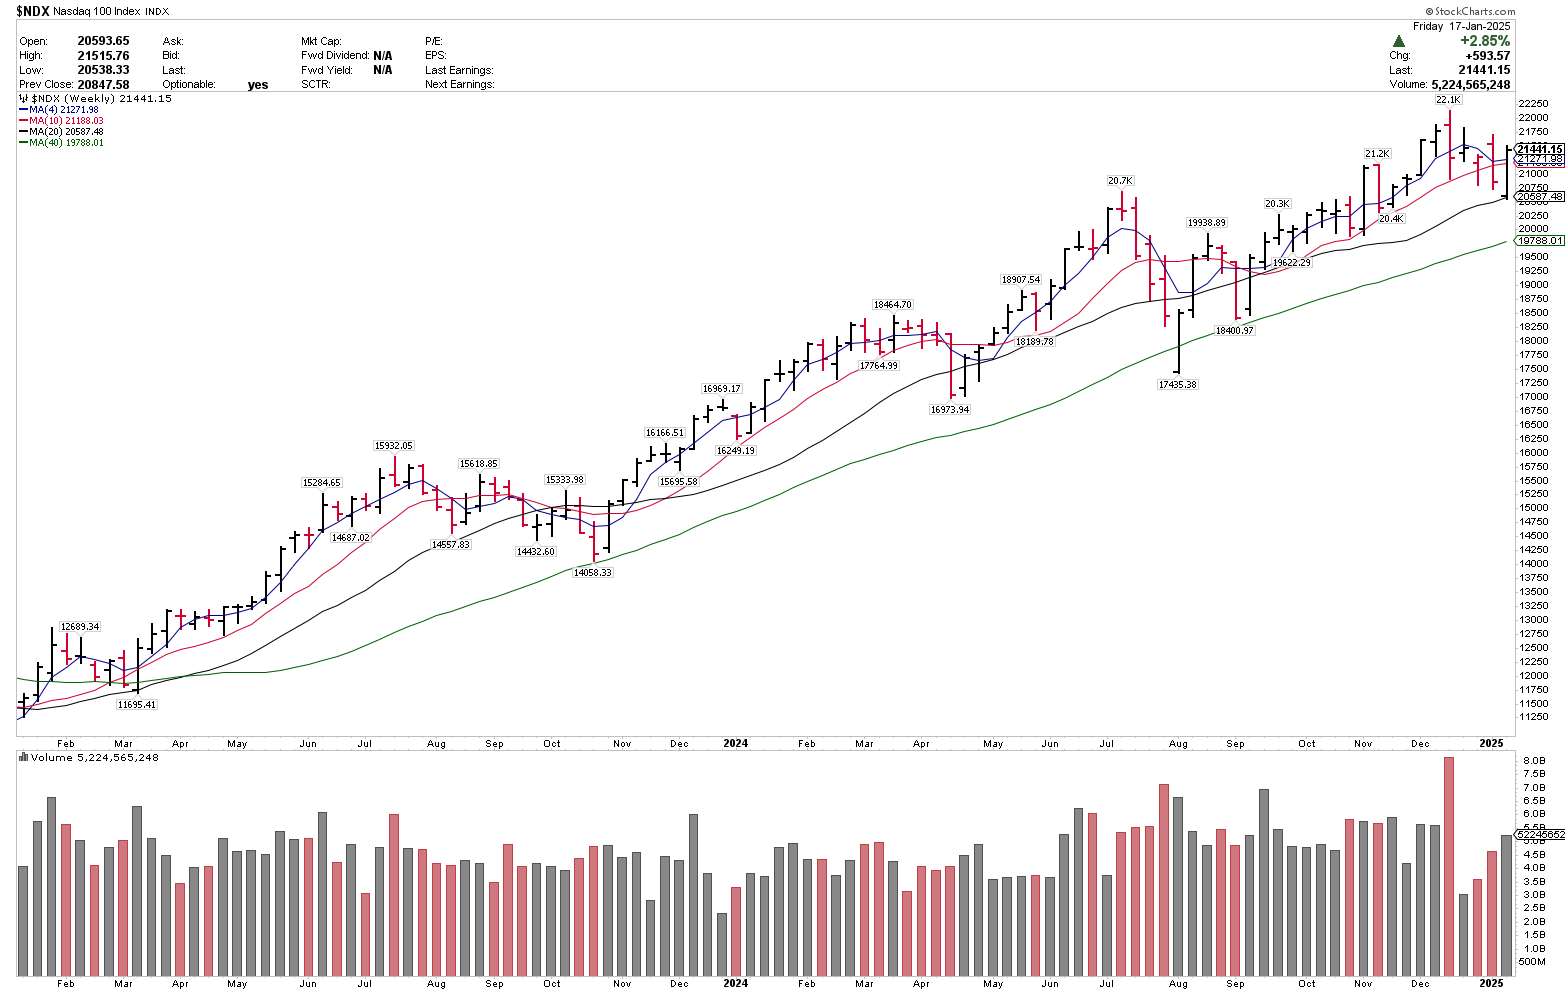
Nasdaq 100 Index (NDX)
Weekly trend rating: Buy/accumulate.
10-week MA trend rating: Uptrend.
40-week MA Trend Rating: Uptrend.
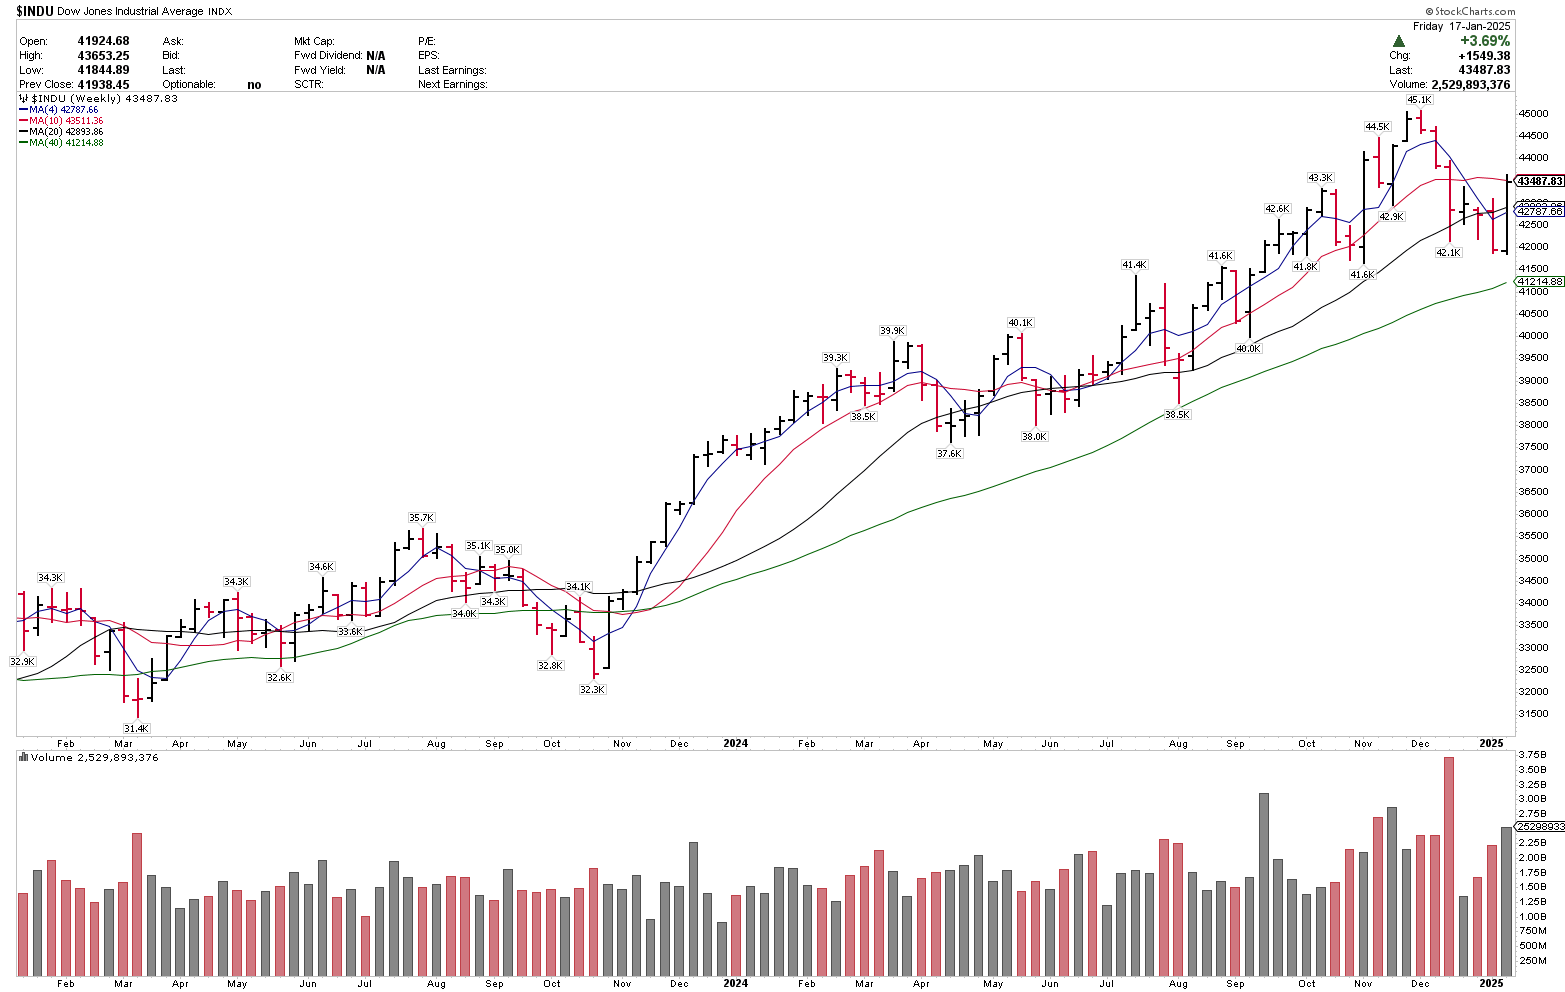
Dow Jones Industrial Average (INDU)
Weekly trend rating: Buy/accumulate.
10-week MA trend rating: Neutral.
40-week MA trend rating: Uptrend.
Russell 2000 (small caps) ETF (IWM)
Weekly trend rating: Accumulate.
10-week MA trend rating: Down.
40-week MA trend rating: Uptrend.

US Treasury Bonds, 20+ Year ETF (TLT)
Weekly trend rating: Avoid. This chart may have found a tradeable low, but the primary trend is down.
40-week MA trend rating: flat.
10-week MA trend rating: down.

CBOE 10-Year US Treasury Yield (TNX)
Weekly trend rating: Up.
The near-term trading range is 4.50-4.80.
40-week MA trend rating: flat.
10-week MA trend rating: up.

WTI CRUDE OIL (WTI)
Weekly trend rating: Neutral/improving.
40-week MA trend rating: down.
10-week MA trend rating: up.

GOLD
Weekly trend rating: Buy.
40-week MA trend rating: uptrend.
10-week MA trend rating: down.

BITCOIN
Weekly trend rating: Buy/accumulate.
40-week MA trend rating: uptrend.
10-week MA trend rating: up.
This is a very high volatility/speculative market.

COMMODITIES, TRACKING GROUP
- Gold is rated buy.
- Crude oil is rated neutral/improving.
- Natural gas is a high volatility chart, rated speculative buy.
Inflation – Cleveland Federal Reserve Bank Real-Time inflation forecast, below:
inflation Nowcasting (clevelandfed.org)

Fed Funds futures, from the CME Website, below.
Link: CME FedWatch Tool – CME Group

ADDITIONAL CHARTS COVERED IN TODAY’S VIDEO:

Have a great week,
Larry Tentarelli
Chief Technical Strategist and Founder
Blue Chip Daily Trend Report
_______________________________________________________________________________________________________________________________
DISCLAIMER: Blue Chip Daily Trend Report, LLC, is a daily research publication and is for informational and educational purposes only. It provides only general, disinterested and non-specific commentary and is not a recommendation to buy or sell any securities or make any investment decisions. It is not investment advice. Blue Chip Daily Trend Report operates under an exclusion from the definition of an investment adviser because:
a) it offers only “impersonal advice”, i.e. advice not tailored to the individual needs of a specific client, group of clients or portfolio;
b) the publication is “bona fide” and contains only disinterested commentary and analysis, and no promotional material, or information distributed as an incident to personalized investment services; and
c) this publication is of general and regular circulation and is not issued from time to time in response to episodic market activity or events affecting the securities industry. Please see full disclaimer below.
Blue Chip Daily Trend Report, LLC, “Company”, Larry Tentarelli and all associated persons and publications, newsletters, commentary and social media feeds is not an investment advisory service, nor a registered investment adviser or broker-dealer and does not purport to be, or to tell or suggest which securities, investments or currencies individuals should buy or sell for themselves. Blue Chip Daily Trend Report is a daily financial publication and is for informational and educational purposes only. It provides only general, disinterested and non-specific commentary and is not a recommendation to buy or sell and securities or make any investment decisions.
The information provided in any correspondence, publications, websites, or social media feeds and accompanying material is for informational purposes only. It should not be considered legal or financial advice. Data and information provided is for informational purposes only. The information provided has been obtained from sources deemed reliable but is not guaranteed as to accuracy or completeness. Neither Blue Chip Daily Trend Report, LLC, nor any of its data or content providers shall be liable for any errors or omissions or for any actions taken in reliance thereon. You should consult with a professional Advisor to determine what may be best for your individual needs. Blue Chip Daily Trend Report, LLC, and all affiliates, does not make any guarantee or other promise as to any results that may be obtained from using the content. No one should make any investment decision without first consulting his or her own financial advisor and conducting his or her own research and due diligence. To the maximum extent permitted by law, ”Company” disclaims any and all liability in the event any information, commentary, analysis, opinions, advice and/or recommendations prove to be inaccurate, incomplete or unreliable, or result in any investment or other losses.
Content contained on or made available through the website, publications, and associated social media feeds is not intended to be and does not constitute legal advice or investment advice. Your use of any information online, or materials linked from the publication or website is at your own risk. All trades, patterns, charts, systems, etc., discussed on this site and any associated sites or feeds and the product materials including website and twitter feed are for illustrative purposes only and not to be construed as specific advisory recommendations.
By accessing this publication, website, and its pages, links, associated social media feeds and publications, which users may access through this site, a user agrees not to redistribute the information found therein. All material in this website and its related websites and pages are protected under copyright laws of the United States. Unauthorized forwarding, copying or reproduction will be treated as a breach of copyright. The Information provided in this website is not to be relied upon for your investment decisions. Your decision to buy any securities is as a result your own free will and your own research. Past results are not indicative of future returns. There is a very high degree of risk involved in any type of trading. Stocks, Options, ETF’s & Futures are not suitable for all investors. “Company” and affiliated sites, and its subsidiaries and all “affiliated” individuals assume no responsibilities for your trading and investment results. No representation is being made that any account will or is likely to achieve profits. All investors should consult a qualified professional before trading any security. Under no circumstances should anything contained in this website be construed or considered as an offer to sell, or a solicitation of any offer to buy. While all reasonable care has been taken to ensure that the information contained herein is not untrue or misleading at the time of publication, we make no representation as to its accuracy or completeness and it should not be relied upon as such. From time to time “Company” and any of its officers or employees may have a position or otherwise be interested in any transactions, in any investments (including derivatives) directly or indirectly the subject of this report. Entities including but not limited to Blue Chip Daily Trend Report, LLC, its members, officers, directors, employees, customers, agents, and affiliates may have a position, long or short, in the securities referred to herein, and/or other related securities, and may increase or decrease such position or take a contra position at any time with no notice. All other trademarks are property of their respective owners. All rights reserved.