START YOUR 30-DAY FREE TRIAL HERE: 30-Day Free Trial – Blue Chip Daily Trend Report
In this brief educational blog and video, we take a look at our sale in Netflix (NFLX) on December 15, 2021, just over $585, and discuss what led to the sale, and why we have avoided the stock on the way down, to avoid a 62% decline in 4 months. Our subscribers were alerted of this sale in real-time.
YOUTUBE VIDEO: https://youtu.be/QM-Sbt8QMjY
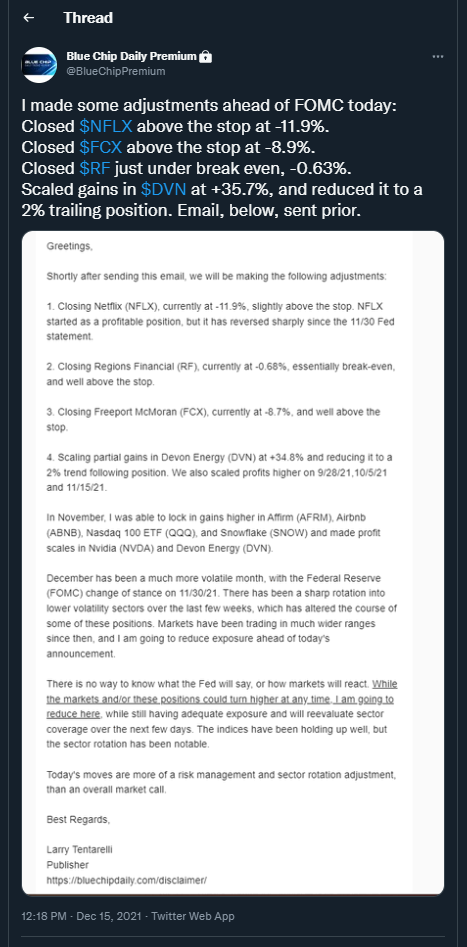
1. After testing a potential breakout on 11/29/21, the stock turned sharply lower on 11/30, after a pivot from Jerome Powell and the FOMC on the pace of their tightening cycle.
2. The stock closed below the 50-day moving average on 12/1, a bearish technical signal.
3. The stock failed just below the 50-day moving average on 12/8, another sign of weakness.
4. I closed the position ahead of the FOMC statement on 12/15, to avoid any further volatility.
5. The stock closed below the 200-day moving average on 1/6/22, another major bearish signal.
6. We have avoided this stock all the way down, as it has been trading below a declining 50-day moving average and below the 200-day moving average.
The total drawdown avoided so far here is 62%.
Our technical process took us out of the stock 4 months ahead of the major Wall Street brokerage firms, which issued 9 downgrades, today, after the major decline.
See our other top market calls for 2022 here: Top Market Calls 2022 – Blue Chip Daily Trend Report
JOIN Blue Chip Daily Here: Blue Chip Daily Trend Report