I booked +20% gains in part of my long $NVDA position today and am holding the rest. In this blog and video I walk you through the entry screenshot, chart, mindset and how I have managed the position so far.
4/13/20 Our Chart of the Day best idea
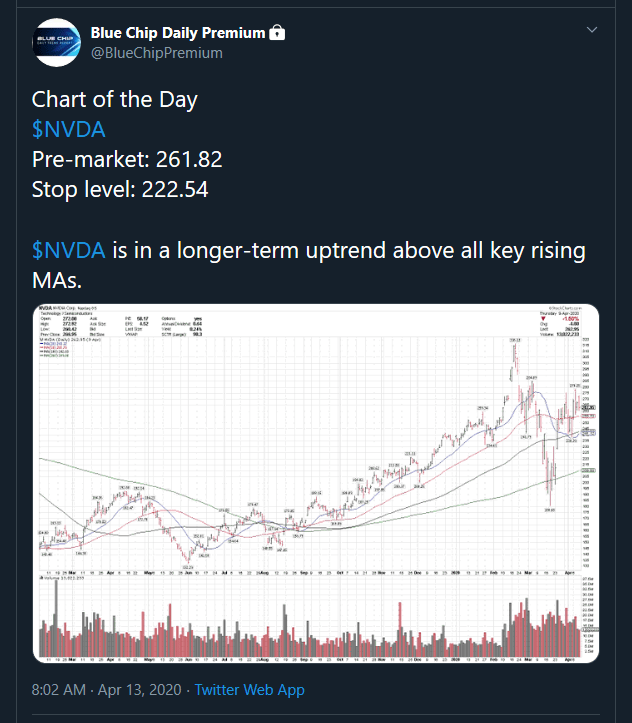
End of week chart from 4/9/20, the stock market was closed on 4/10/20.
4/13/20 Waiting for new $AMZN and $NFLX to start to work before adding more risk. Once they started to break out, that was the green light for a new position.
$NFLX
4/14/20 long just over 280. 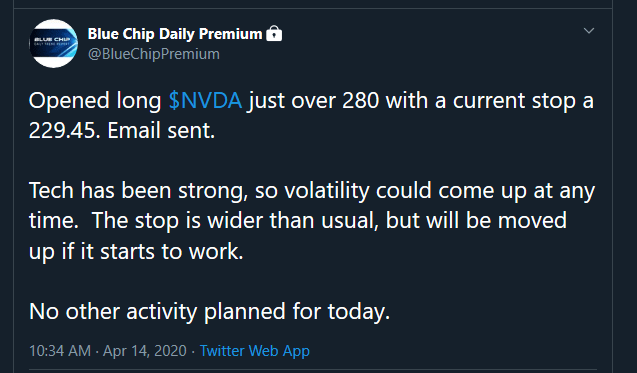
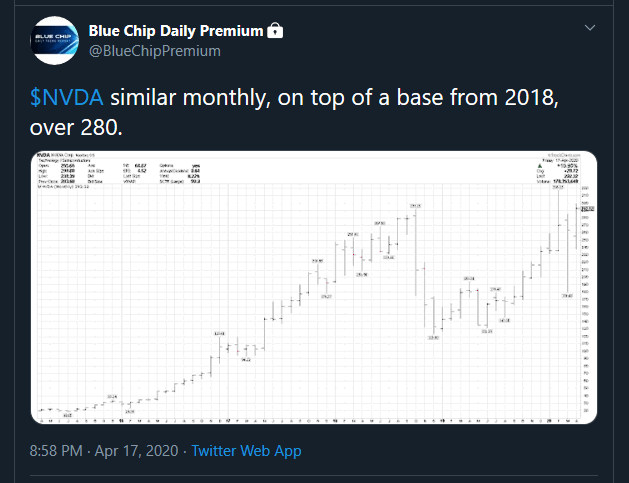
4/17/20 monthly chart highlighted
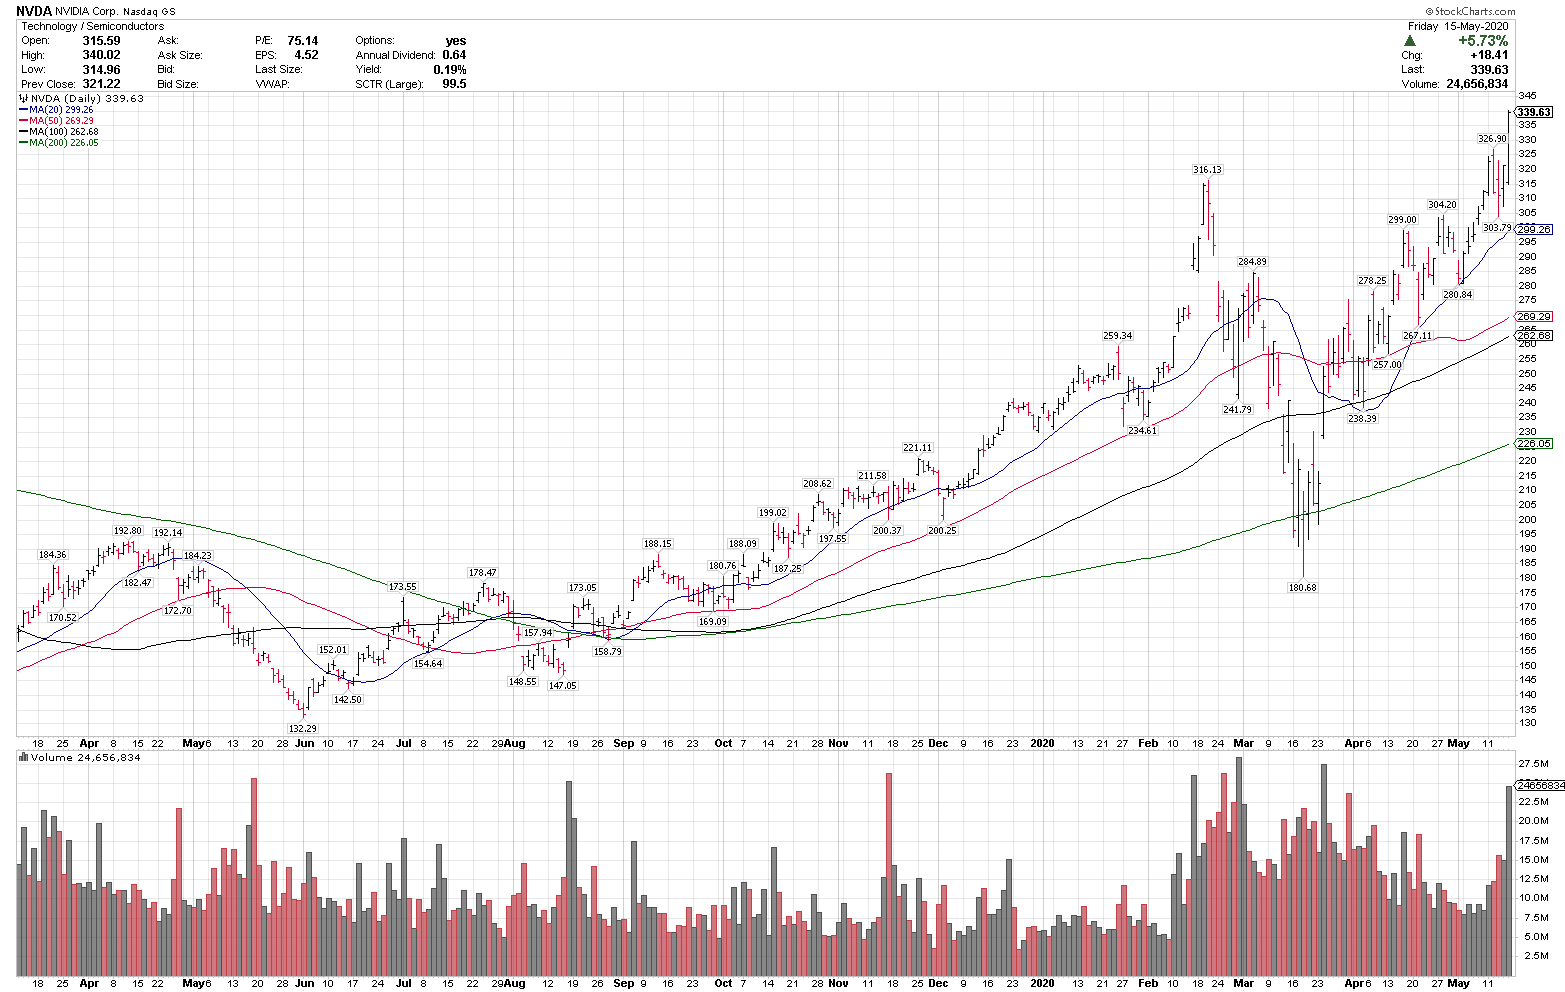
5/15/20 $339.63, new all time high, +21% – scaled partial profits today
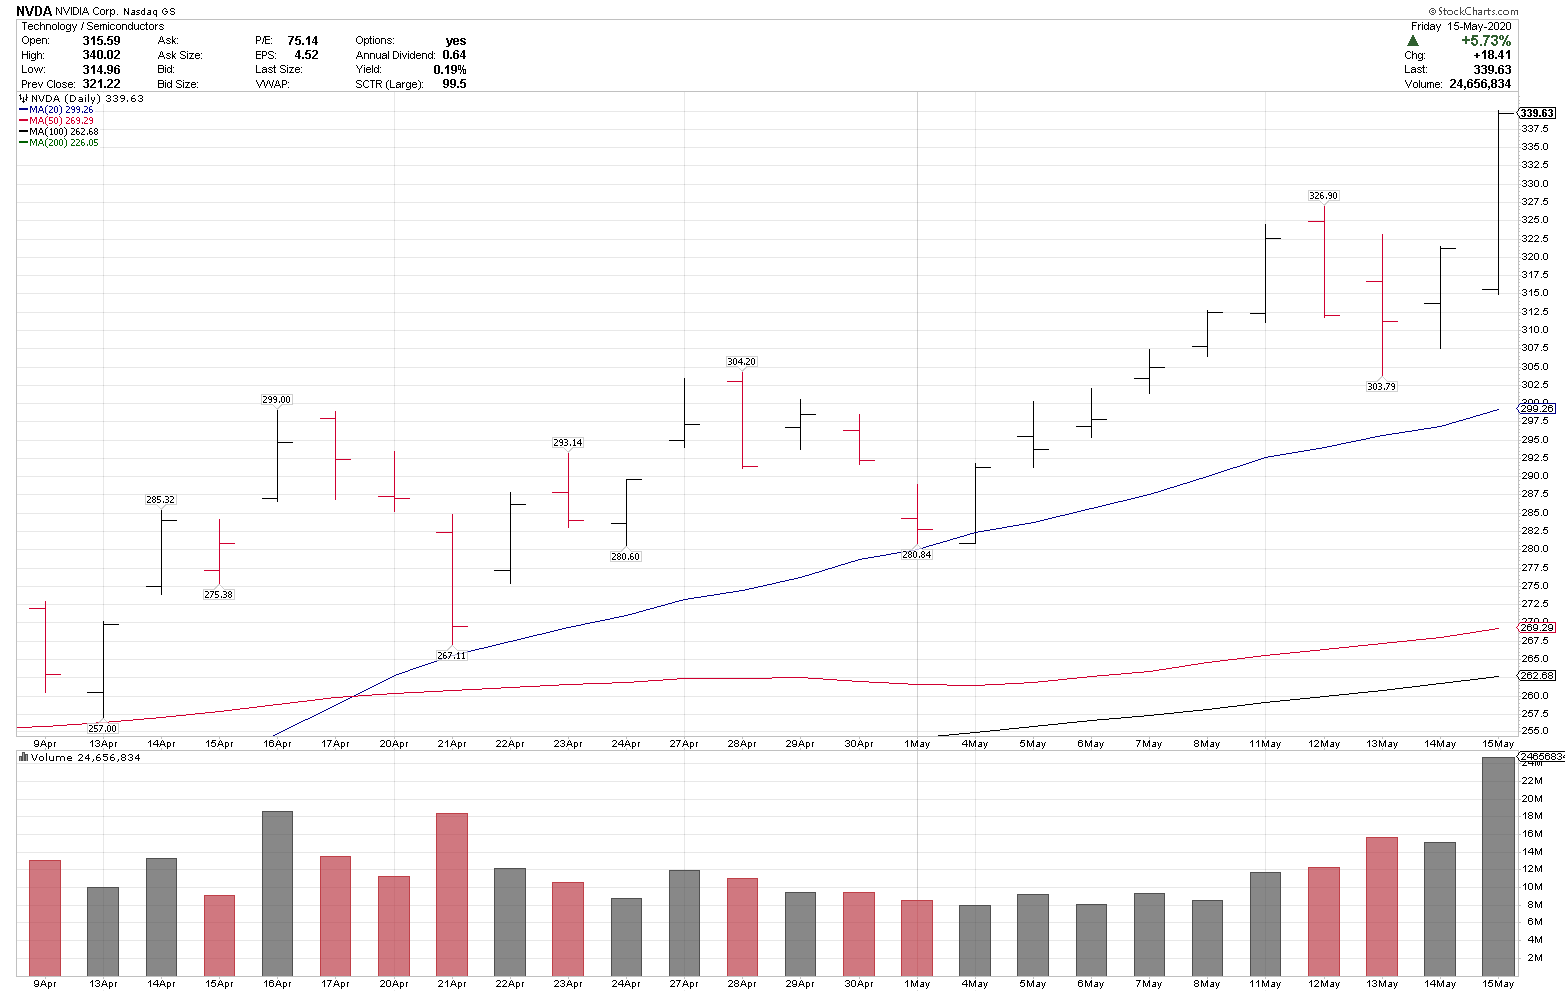
Since entry on 4/14
est idea