I have been trading for 22 years now, starting in 1998, when the S&P 500 was trading near 1100. Since then, I have traded my way through 4 Bear markets, a market shutdown, a flash crash and various highly volatile and stressful market conditions. Having started in 1998, this marks the beginning of my fourth decade in markets, and the Bear markets have often taught me the best lessons.
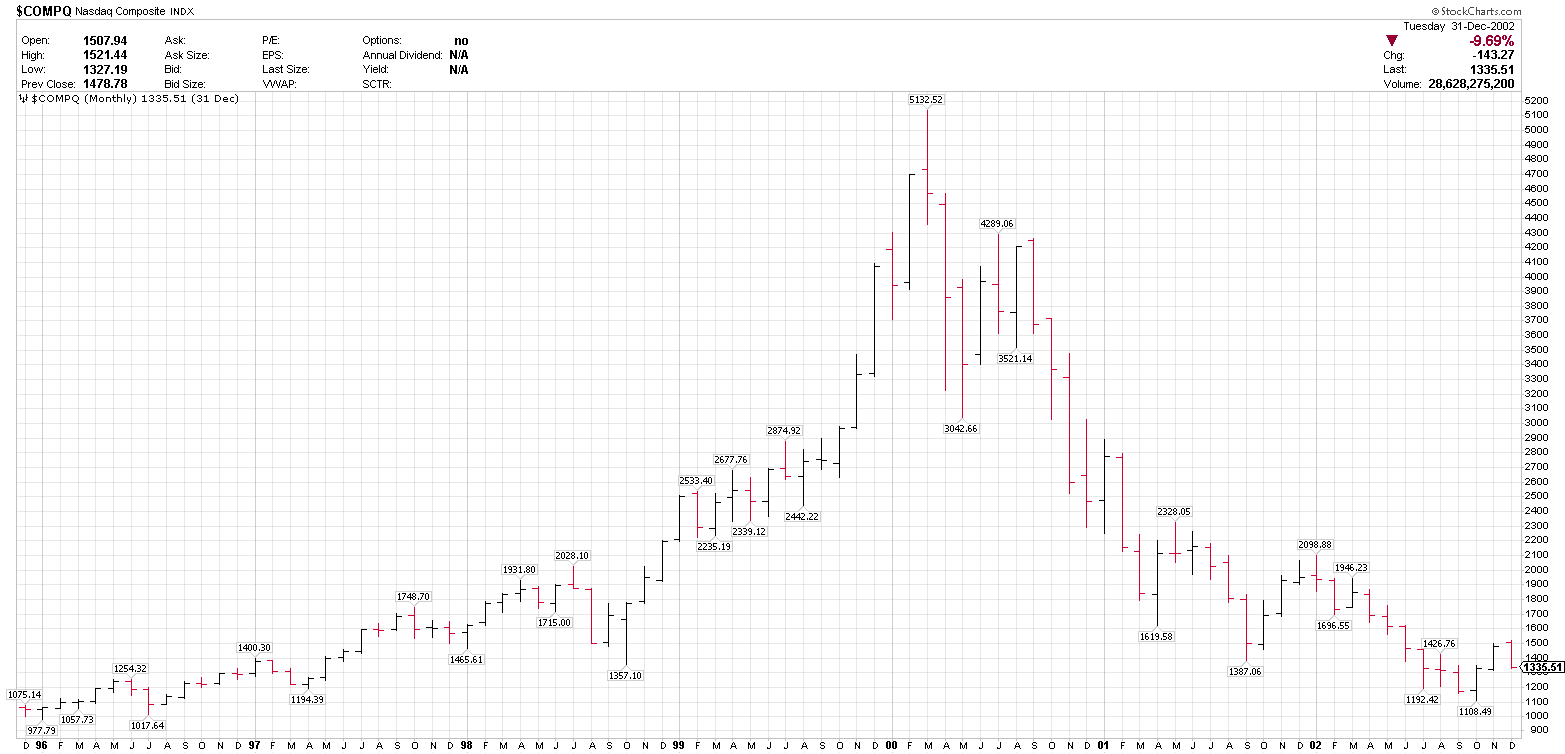
I became actively involved in markets starting in late 1998 when I was hired by Merrill Lynch for their Financial Advisor Training Program. All we had to do to make money back then it seemed was buy a tech stock, an internet stock, or a ‘Nifty 50’ Large-Cap, (General Electric, Home Depot, Pfizer, or any other large cap household name). It was great for the first 16 months, as everything that I bought or recommended seemed to go up daily. The Nasdaq literally doubled in 15 months. Leading stocks like Cisco $CSCO, went up 10x and Qualcomm $QCOM, went up 35x in a few years.
Then, from March to May of 2000, the index had a 40% drawdown, and within 2 1/2 years, lost 80% of it’s market cap. In a short period of time, stock market leaders like Lucent Technologies $LU, MCI WorldCom $WCOM, Sun Microsystems $SUNW, Nortel Networks $NT, Global Crossing $GBLX, and Enron $ENE, lost 70% to 100% of their value.
NASDAQ 1996 – 2002, 2000 “TECH BUBBLE” and BEAR MARKET
In the middle of the 2000 – 2002 Bear Market was the tragic 9/11 attack, which shut the stock market down for four trading days, and contributed to an 18% $SPX drawdown in September 2001 alone.
$SPX 7/2001 – 12/2001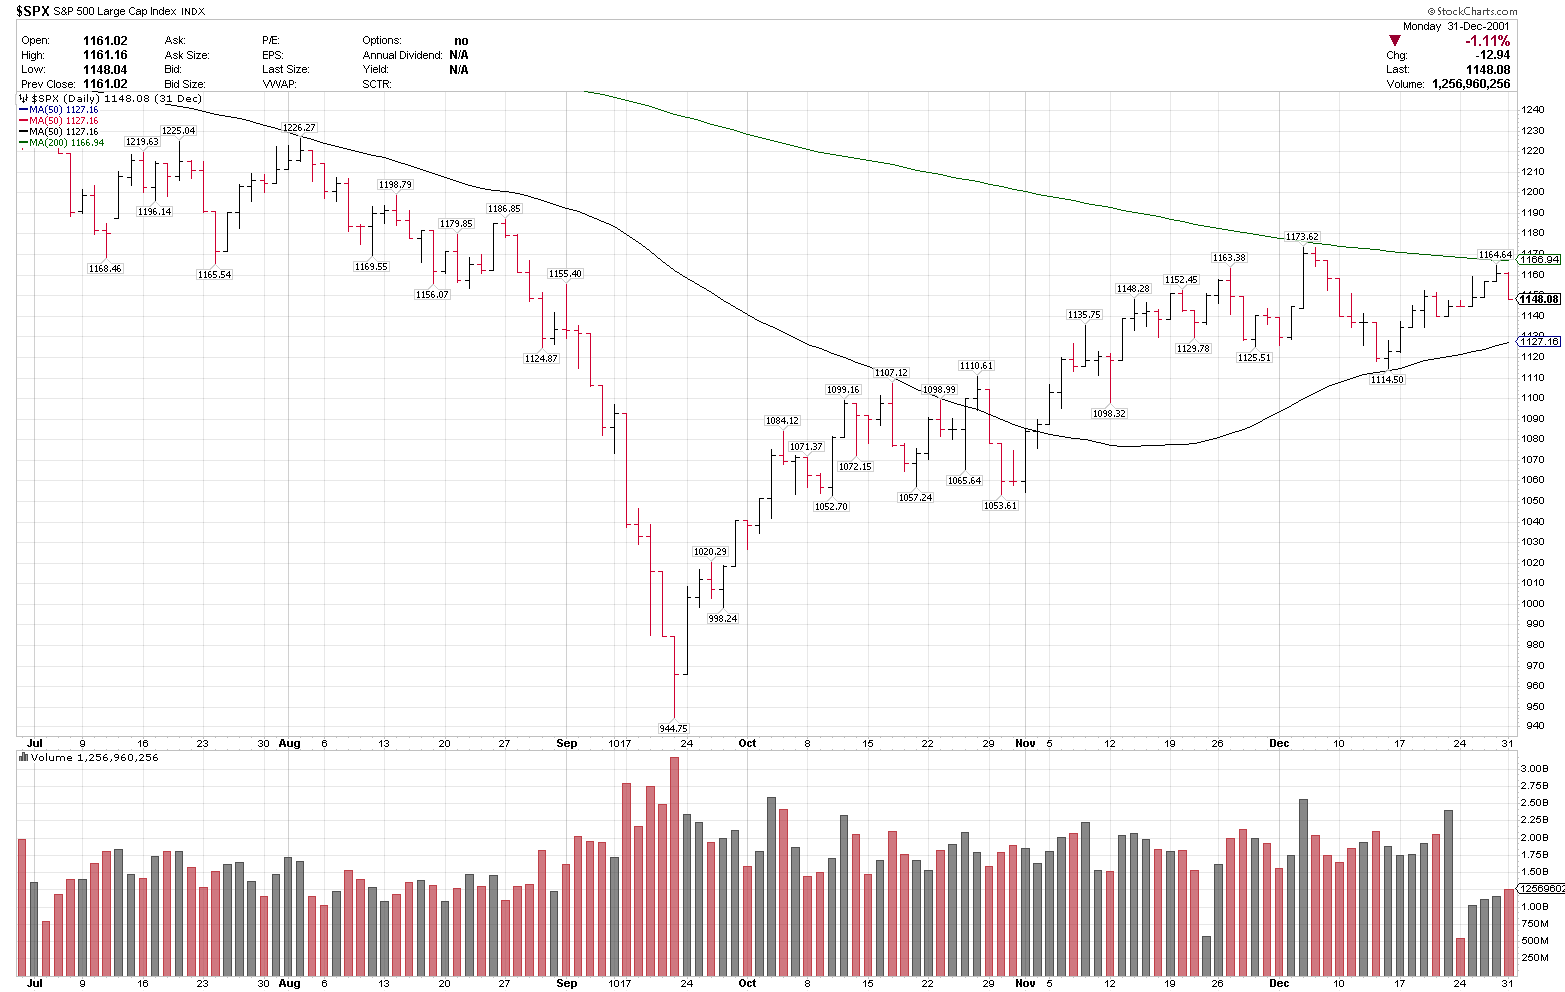
Having somehow made my way through that Bear Market, and having lost a considerable amount of money, but still in the game, I found myself looking for answers as to how I could have avoided being caught in the massive unwind. I started to look in the charts to see if I could find a clue or signal to alert me that lower prices were ahead. I will come back to this point later in this piece.
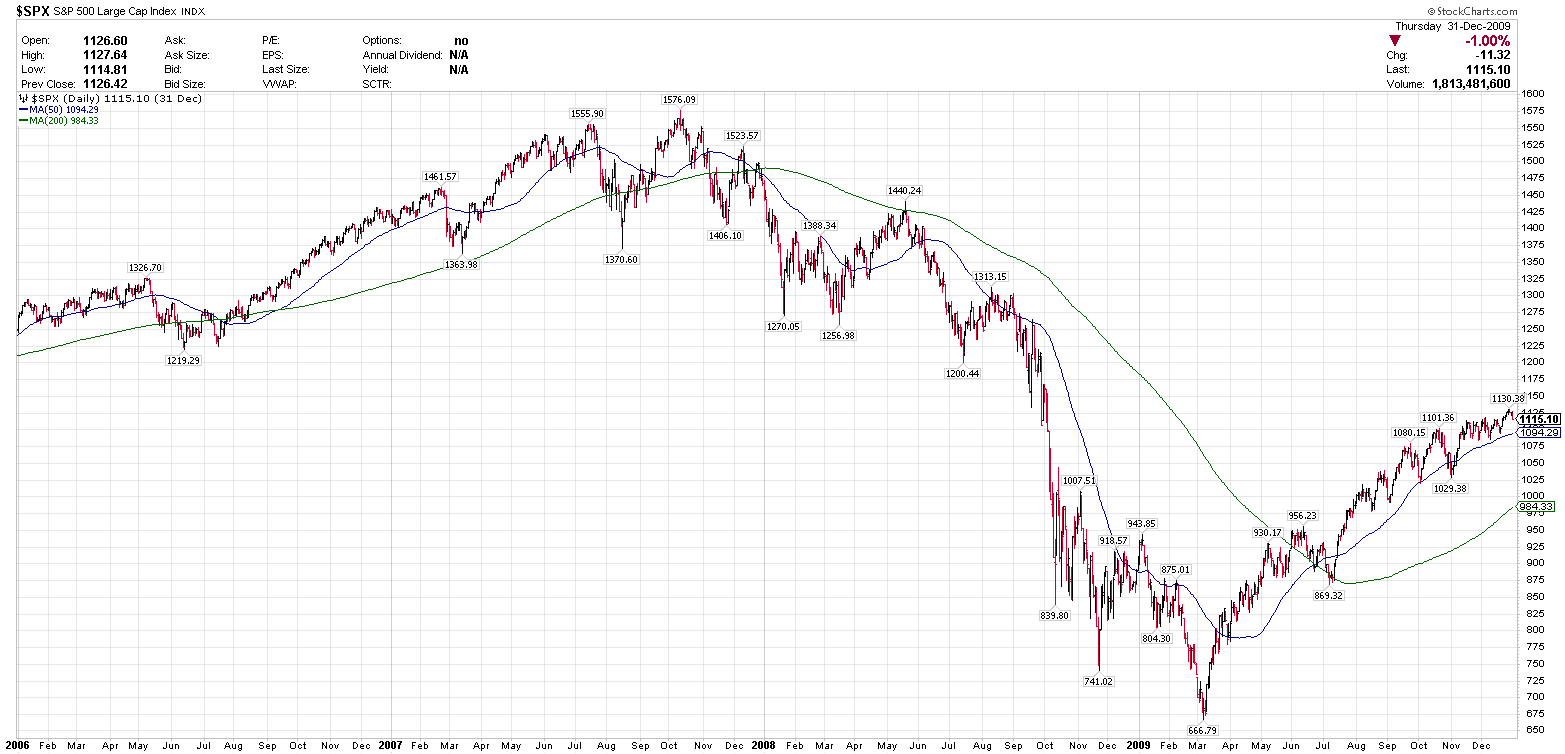
I then traded into the 2007/2008 Great Financial Crisis/Subprime Mortgage meltdown which saw Wall Street institutions like Lehman Brothers $LEH, Bear Stearns $BSC, and Merrill Lynch $MER, go bankrupt, stop trading or get taken over by other firms. Mortgage giants Fannie Mae $FNM, Freddie Mac $FMCC, Countrywide Financial $CFC, and Washington Mutual $WM, also were taken over, were insolvent or were selling for pennies on the dollar. Global behemoths Bank of America $BAC, Citigroup $C, and American International Group $AIG, lost 95% of their value.
It seemed that everyday, another leading name was going out of business, and Federal Government emergency meetings were in the news daily. The Wall Street Journal published an article about money markets breaking the $1 threshold, and I found myself hoarding physical cash in case the ATMs stopped working. These were truly scary times for those of us who were aware of the magnitude of the derivatives problem.
$SPX 2007 – 2009 ‘GFC’ BEAR MARKET
$BAC 2007-2009 ‘GFC’ BEAR MARKET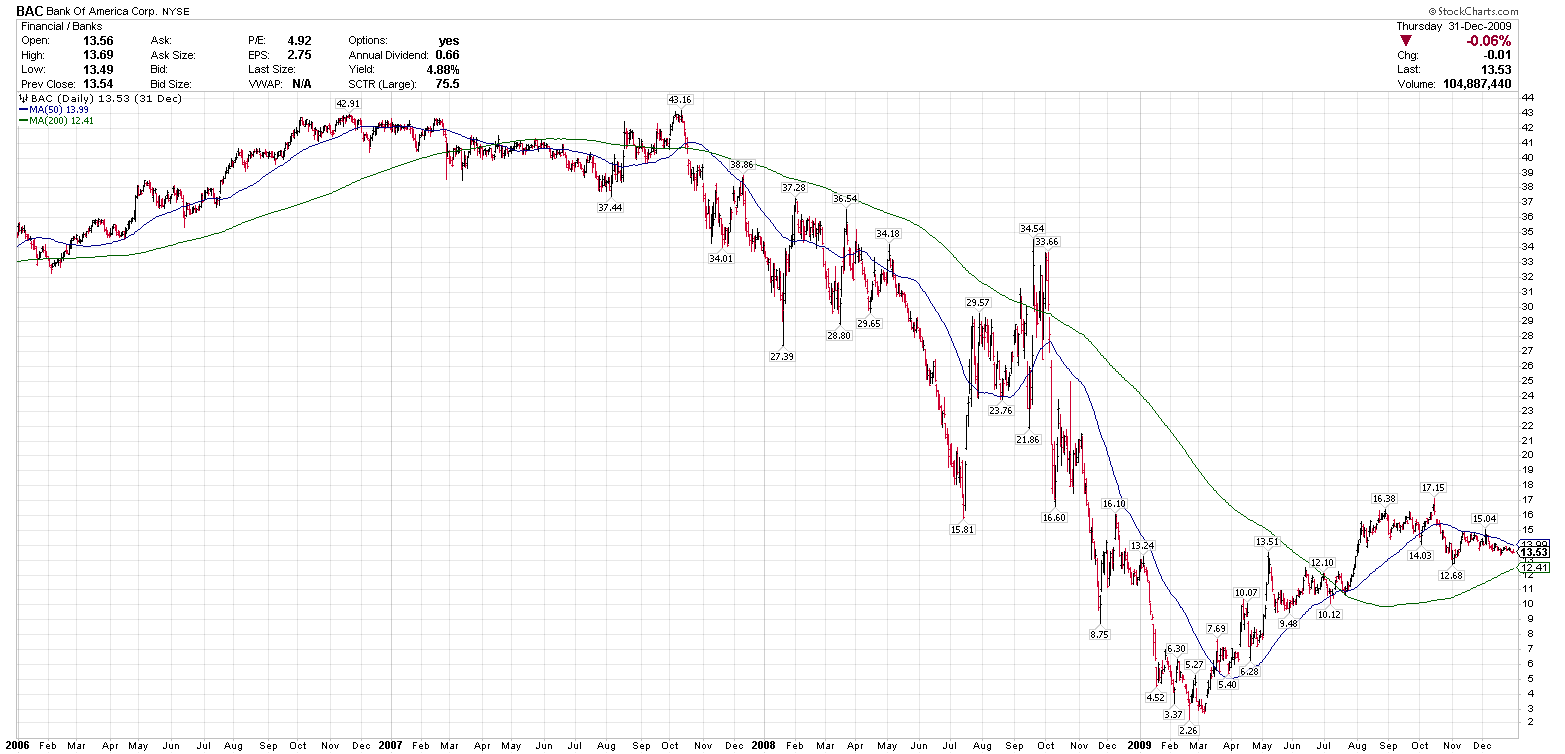
Since then we have had the much more subdued Flash Crash of 2010, which saw the Dow drop 9% and bounce within 36 minutes. Bear Market #3 came in 2011, as $SPX had a 21% drawdown from the May 2011 peak at 1370, to the low in Oct0ber 2011 just under 1080. We had another 15% correction in 2015 and then #4, the 2018 Bear Market, which saw a 20% drawdown in Q4.
$SPX 2018 BEAR MARKET 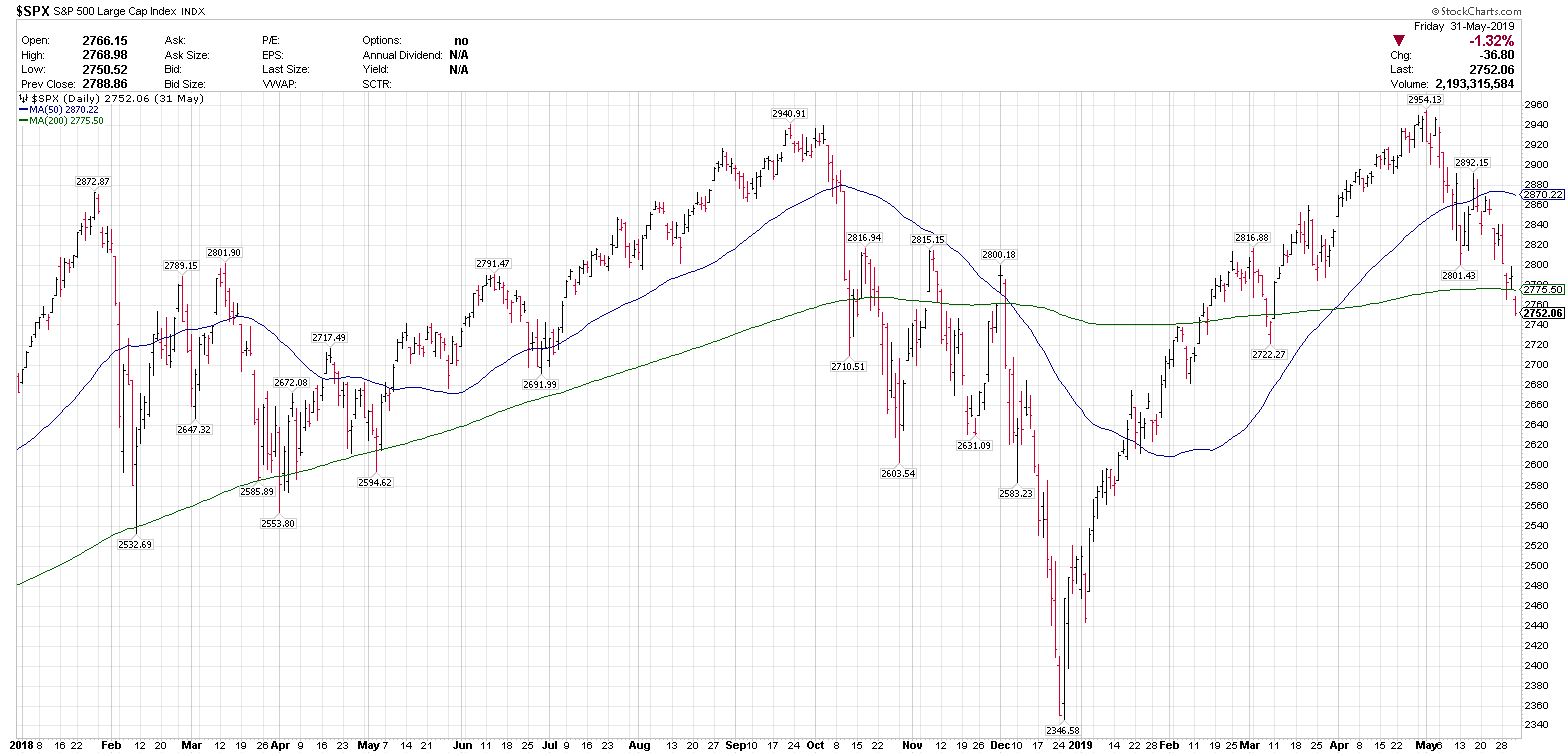
The textbook definition of a Bear Market is a 20% drawdown in a major index from peak to trough. Having been through 4 of them, I also choose to use this standard definition. Here are a few key lessons that I have learned from these Bear Markets:
1. Bear Markets start as a breakdown process, and don’t happen all in one day.
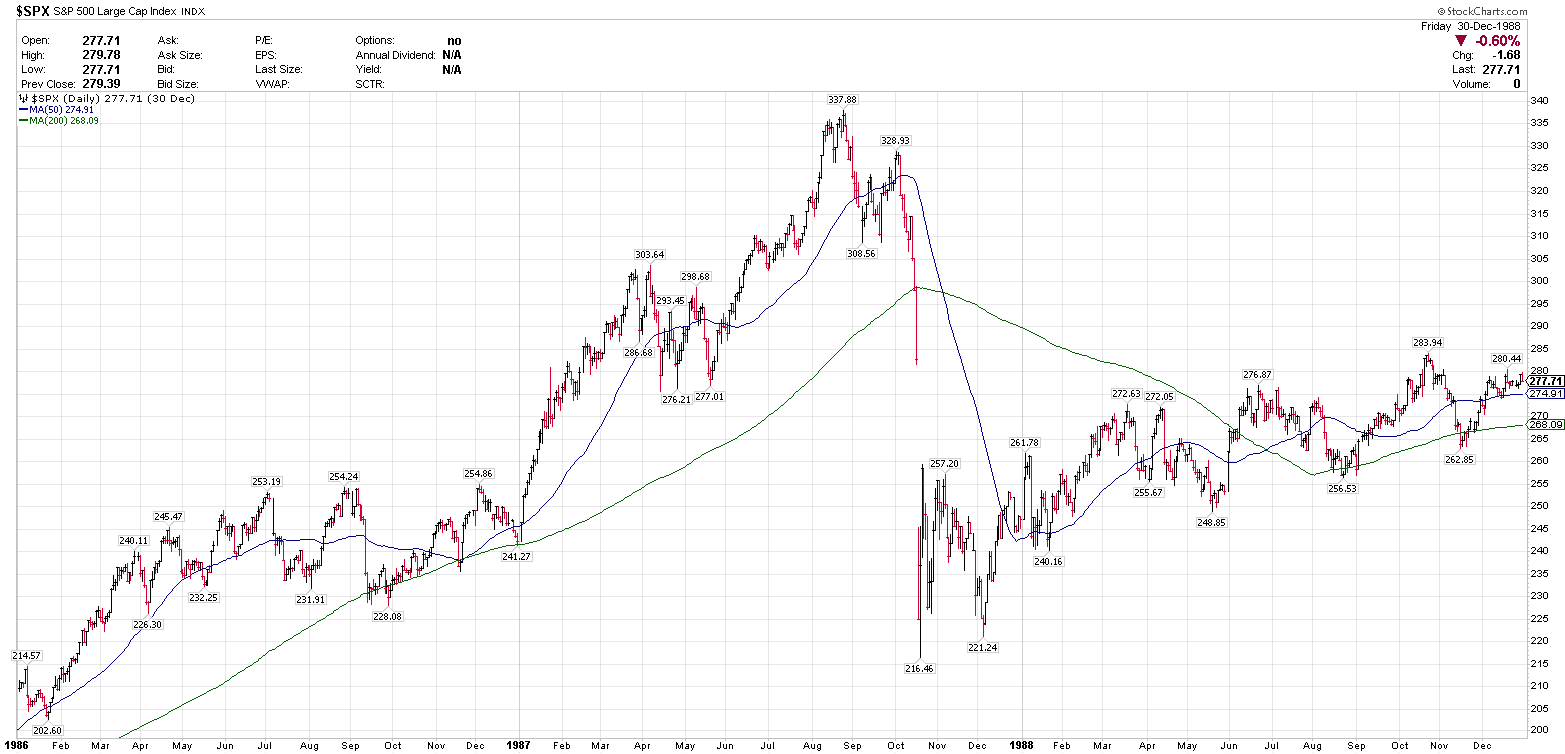
In studying the last 4 bear markets and the 1987 Black Monday, the S&P put in a new high and then over the course of 3 to 7 weeks in some cases, started to make lower highs and lower lows, and in each case broke down below key price levels and below the 200-day moving average before the unwind accelerated. In many cases, moving averages crossed down. On Black Monday, October 19, 1987, the S&P 500 lost 20.4% in one day. This drop occurred 7 weeks after the August 25 top at 337, and after two successive closes below the 200-day moving average (chart below). The selloff leading up to the Crash was a 7-week event, with multiple exit signals along the way, not a one day event.
$SPX 1986 – 1988
2. There is no prediction needed to avoid being pulled down into a Bear Market.
Peter Lynch famously said, “Far more money has been lost by investors preparing for corrections, or trying to anticipate corrections, than has been lost in corrections themselves.” We see this on Twitter and in the financial media daily. Some pundits have been calling the top in markets since 2011. We hear daily about the ‘slowing economy’, some random divergence, or arbitrary countdown indicator, that have just been flat out wrong for years.
Instead of predicting a top, and then being caught on the outside looking in as stocks move higher, the smart move is to stay long and wait for the exit signals to actually occur. In each and every instance, the price broke down, support broke down, and price broke below the 50, 100 and 200-day moving averages. A reactive trader or investor who follows price signals and/or moving averages would see the exit signals and simply get out of the way.
3. Keep buying the pullbacks until it stops working, and then stop buying.
In uptrends and Bull Markets, the smart move is to stay long and keep buying the pullbacks in the strongest names, betting on trend continuation, until this strategy stops working. When it stops working, then I will test new uptrends and push them until they stop working. If no uptrends are working, then the move is to stop buying, raise cash and/or look for downtrends to short, for those who trade short as well. Buying pullbacks is a great strategy in uptrends and as long as it keeps working. When markets get choppy or break down, it may not be the best strategy, so the smart move is to wait.
4. In Bear Markets, Cash and U.S. Treasuries often outperform.
Once the indices and leading stocks start to break into downtrends, chasing them down is a failed strategy. In downtrends, cash will drastically outperform, and U.S. Treasuries should as well. Downtrends and Bear Markets trade much differently than uptrends do, and usually with higher volatility. Traders might be tempted to try to catch the bottom, but in most cases, it is better to let the bottom prove itself, or at a minimum, test the waters with small positions.
5. Scared Money doesn’t make money
Having traded through almost every possible market condition, including market shutdowns, I have been stress tested with real money on the line. Experience teaches lessons and often instills wisdom. My trading plan is to identify trends, determine stop placement, size the risk and then let the trade go to work with stops in place. I trade from an intermediate to longer-term perspective. Once the stops are in, this helps filter out the noise. It doesn’t matter what the overnight futures markets are doing, what the media says, or an analyst downgrade, or a TV guru, or anyone online.
A few weeks ago, many online were outwardly concerned because $AAPL was going to shut down stores in China for a week or two. That proved to be the low of the cycle and $AAPL recently made a new all-time high. Markets are volatile and stocks are volatile. They both go up and down, and often go down much faster than they go up. If a trader is going to get shaken out by daily volatility, they will not last over time. It seems that many traders often let themselves get shaken out of potentially winning positions or markets with pure daily noise. Size the risk, set the stop ad let the trade go to work. Cool heads and steady hands lead to success over time.
SUMMARY
Going on my fourth decade in the markets, I have learned many lessons along the way. The most valuable lesson that I exercise daily is not to make market calls or try to call tops and bottoms.
This may feed the ego, but not the bank account. My best success has come from objectively following price, and reacting to key entry and exit signals as they occur, managing risk, and being aware of key breakout or breakdown signals.
The market in many traders heads is much different than the market in reality, and is one reason that traders beat themselves, go though massive drawdowns and miss major moves. I would rather accept that any outcome is possible, follow price action and have a plan in place for any potential outcome.
I tune out the media, third party opinions, anyone’s predictions at all, and avoid over-complicating the process. Simple usually works better than complex, doing less is better than doing more, and the biggest winners usually come from longer time frames. Bear Markets may seem costly at the time, but to those who choose to learn from them, they can be a very valuable teacher.
Whenever the next Bear market starts, whether it is this week or many years down the road, it will show up in the charts like it always does. Price will break down and make lower highs and lower lows, will break below key levels and moving averages, and charts will break down and start to weaken. These are the exit signals that I look for. Some seem to believe that this will happen all in one day, maybe it will, but that is not how this process has played out before.
At the time of this blog, I am 100% long equities, holding strong names in strong uptrends, with stops and risk management always in place.