The S&P 500 index (SPX) is at a key technical level, going into the week and ahead of the August CPI report on Tuesday, pre-market.
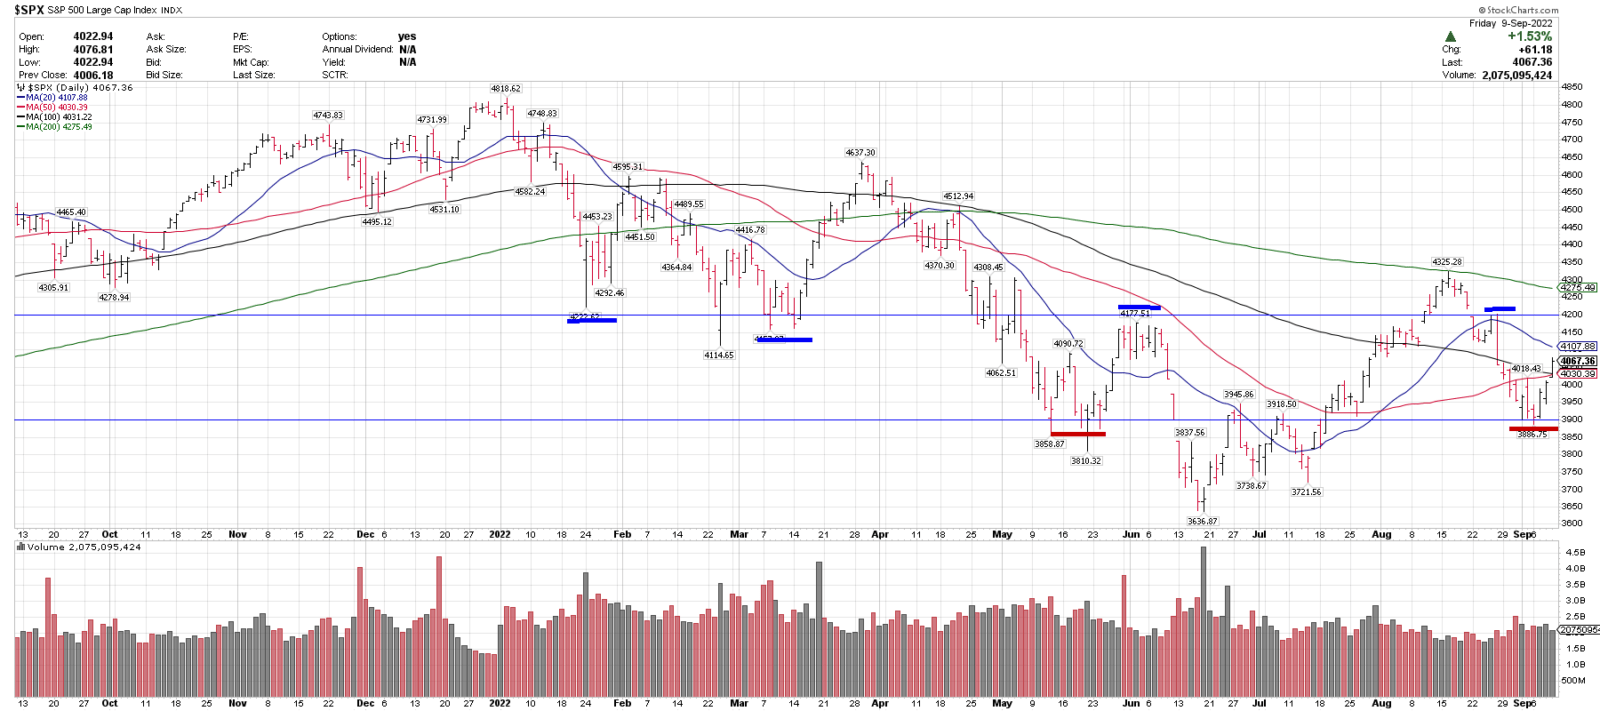
- We view (SPX) in a technical range, in the middle of the 3900-4200 range.
- (SPX) recently made a higher low (3886) vs the major June low (3636), and a lower high (4203) vs the recent August recovery high (4325).
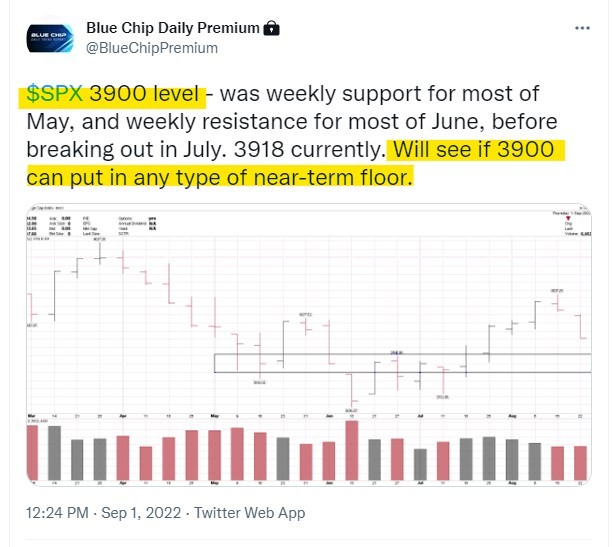
- 3900 is technical support, dating back to May 2022 (red hashmarks on the chart below), and held 4 times over the last two weeks, on a closing basis.
- 4200 represents support and resistance at various times, dating back to January 2022, (blue hashmarks on the chart below).
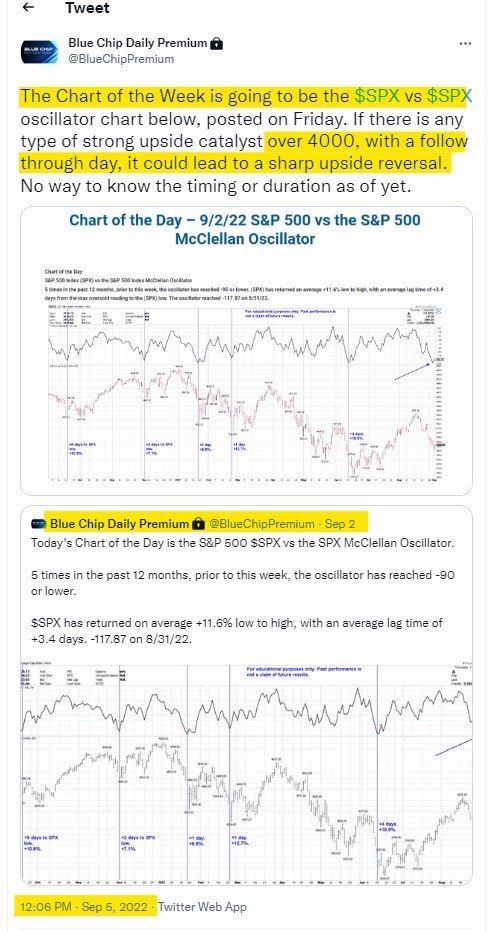
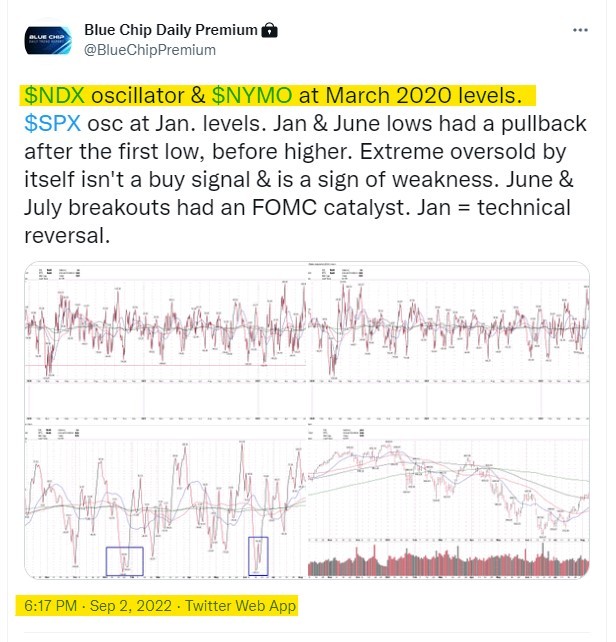
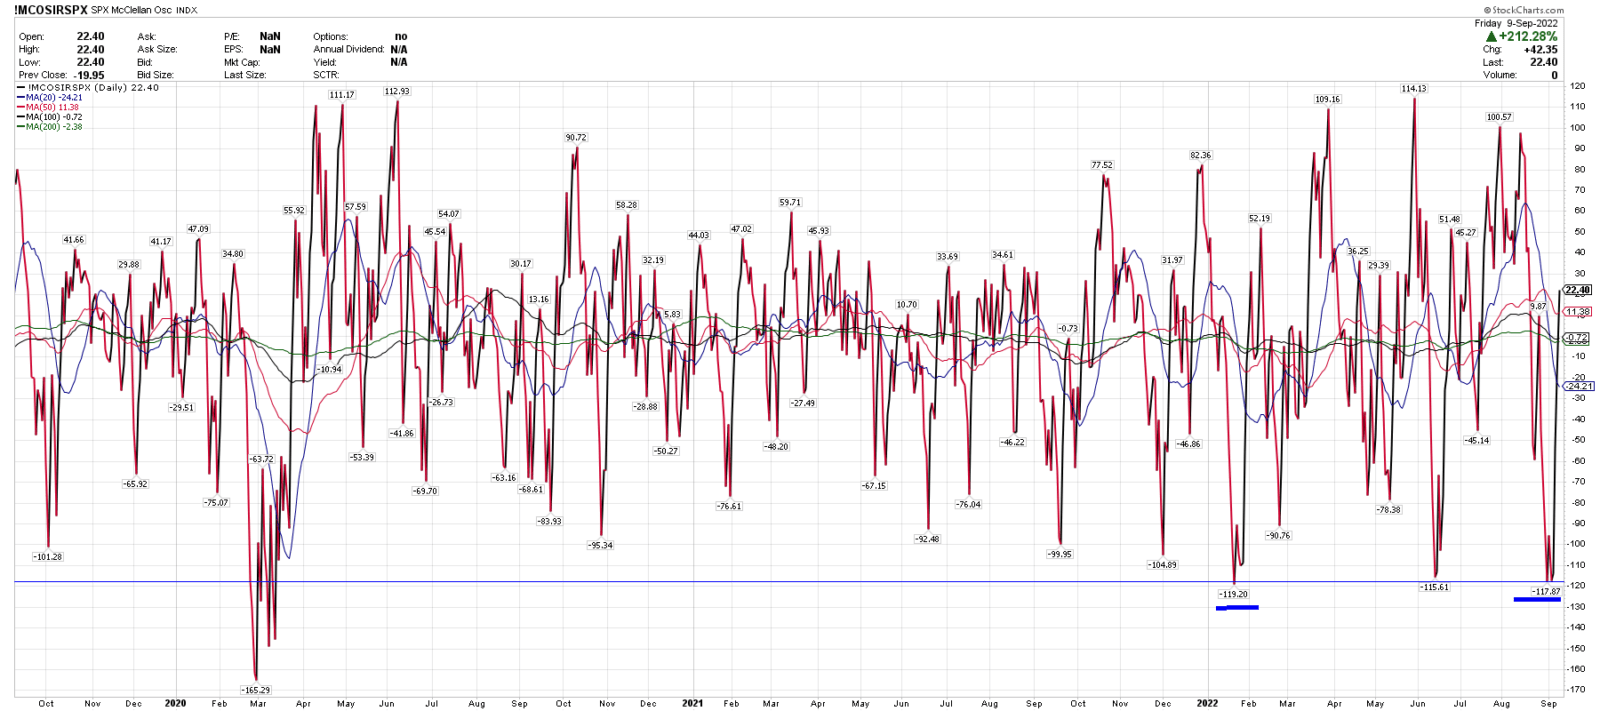
- The S&P 500 reached the most oversold level, as measured by the McLellan Oscillator, since January 2022, which led to a sharp counter-trend rally. (Chart #2 below)
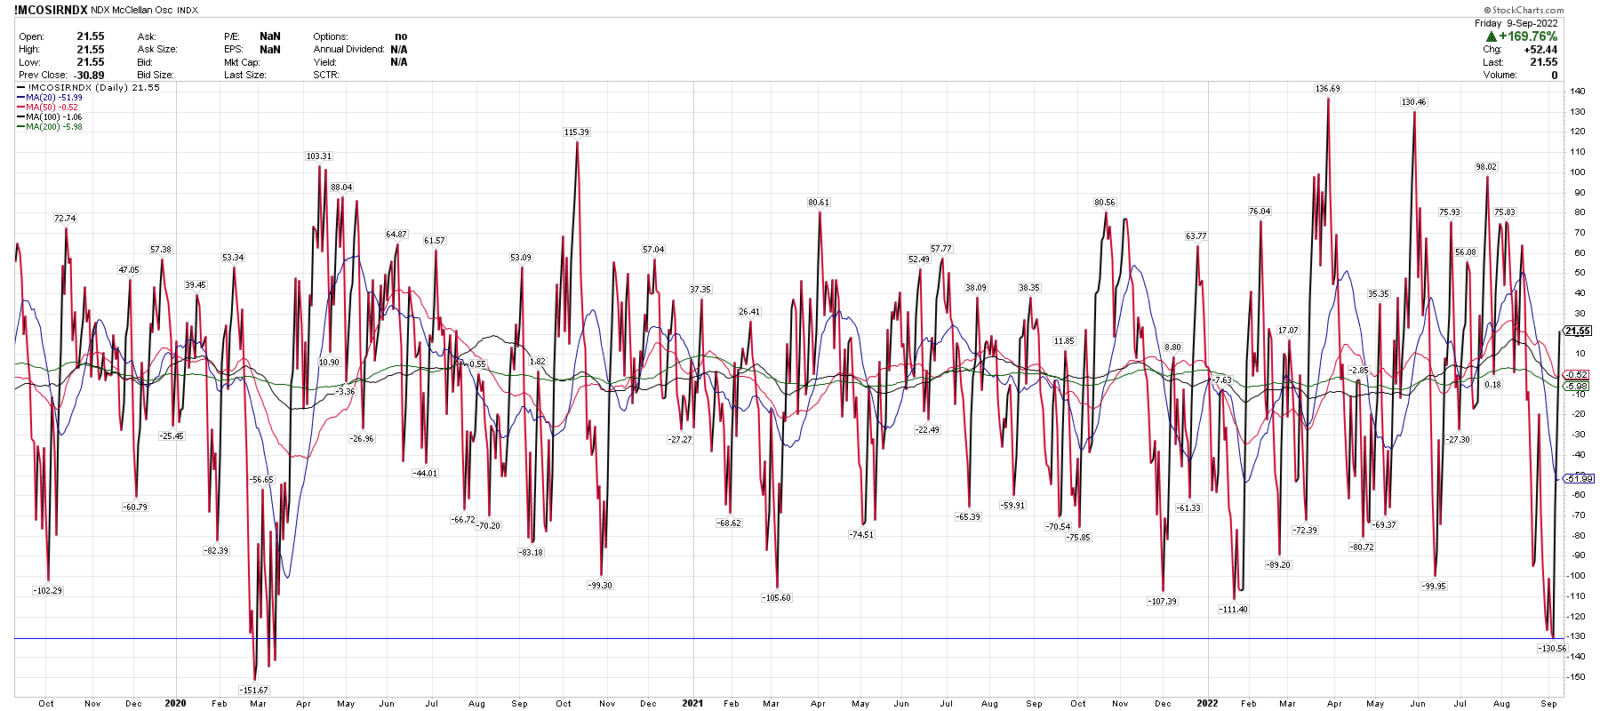
- Nasdaq 100 (NDX) reached the most oversold reading since March 2020, which also preceded a sharp counter-trend rally. (Chart #3 below)
- We shared this information with Blue Chip Daily Members last week, from September 1 and into the recent S&P 500 low on Tuesday.
- This week’s CPI report, could provide a directional catalyst, as it has over the last few months. There is no way to know as of yet what the CPI will come in at and how the markets will react.
S&P 500 technical alert, 3900 major support level. – Blue Chip Daily Trend Report
S&P 500 and Nasdaq 100 major oversold technical alert, at the lows. – Blue Chip Daily Trend Report
The first level to clear, on a closing basis, (3900 or 4200) could signal the next leg of the move.
There are other near term technical readings that we use, that helped us to identify the reversal at 3900 last week.
S&P 500 McClellan Oscillator
Recent low -117.87.
The most oversold reading since January 2022, and second lowest reading since the March 2020 market lows.
NDX McClellan Oscillator
Recent low -130.56.
The single most oversold reading since the March 2020 market lows.