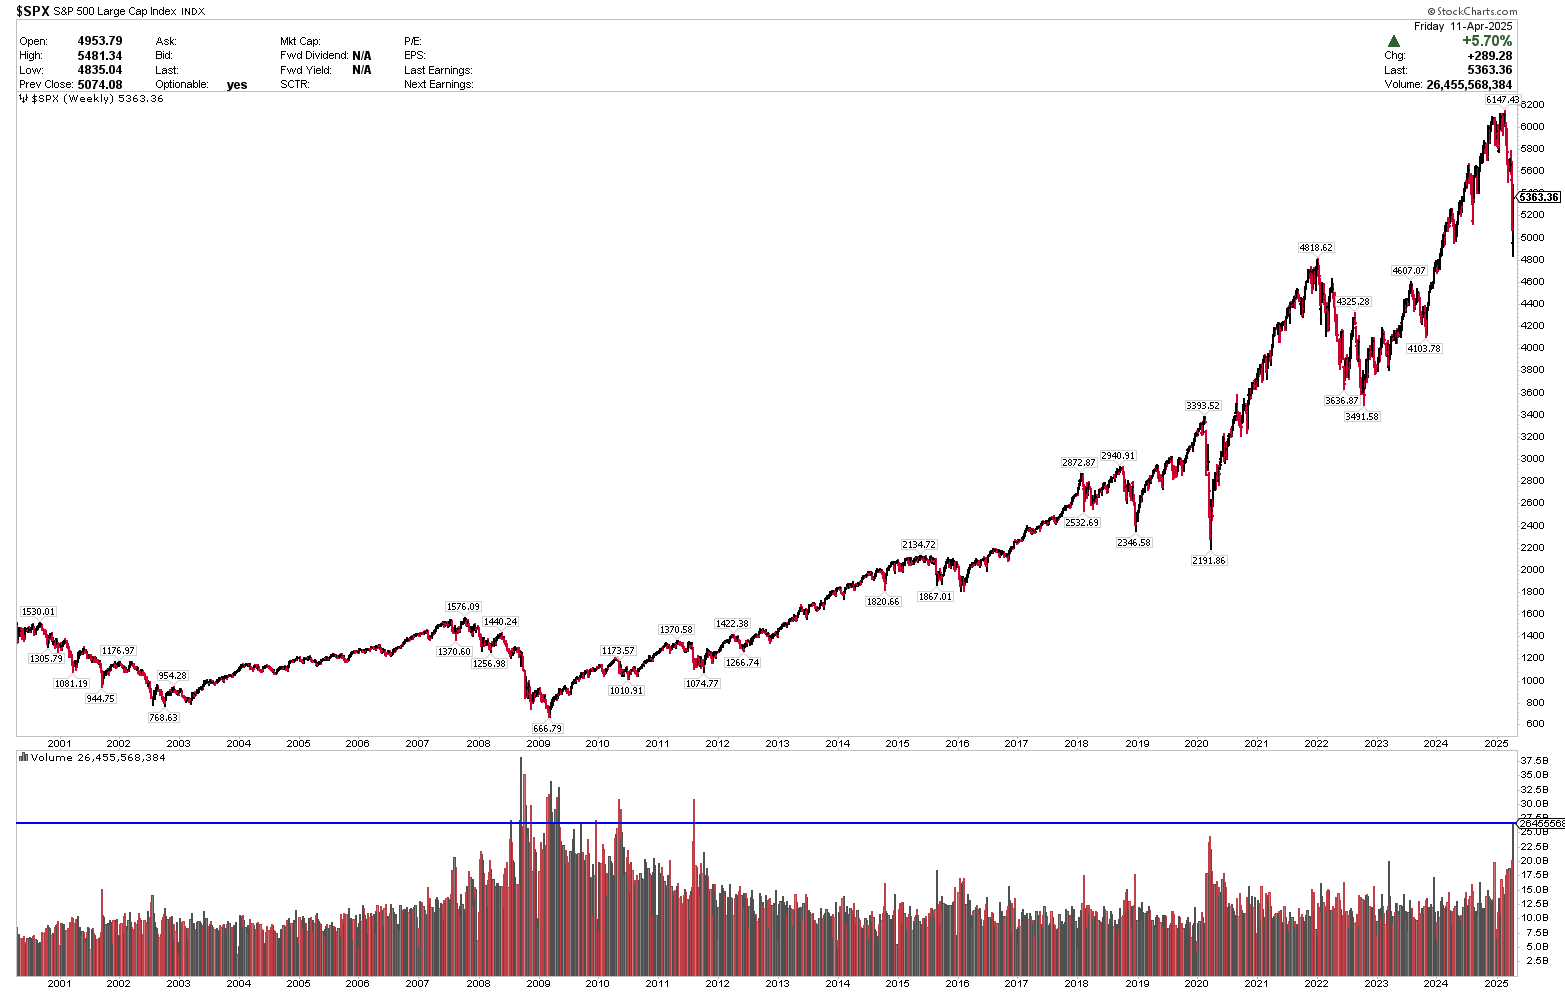
The S&P 500 index just put in the highest weekly volume in 14 years.
- Similar volume spikes in 2009, 2010, 2011 and 2020 marked major market lows. On a technical level, this week’s massive volume selling flush and reversal is identical to prior major market lows. Only 2008 broke lower.
- From a technical perspective, this is an extremely bullish development, as extreme volume selling flushes and reversals often signal major bear market lows.
- From a fundamental perspective, we still have concerns about the volatility of the tariff news cycle and potential economic uncertainty.
- That being said, we believe that the White House is very focused on how the markets will react going forward and we expect the tone of the tariff news cycle could be walked back to a degree. The 90-day tariff pause announced on Wednesday is indicative of this.
- To be clear, I follow price and trends, but I rarely make long-term predictions. This post is not a prediction on my end that a long-term low is in place.
- The high volume selling flush and reversal, into deeply oversold markets is indicative of prior bottoming events.
Another major development is that the Fed has publicly stated now that they will intervene if financial markets show undue stress.
This is in contrast to Jerome Powell’s commentary the prior Friday. We expect that this is related to credit and FX markets, not necessarily stock market volatility. Boston Fed President Susan Collins told the Financial Times: …“We have had to deploy quite quickly, various tools” she told the Financial Times, referring to past interventions to address chaotic conditions in markets. “We would absolutely be prepared to do that as needed.”
One of our major concerns over the past week was that stock market volatility would carry over into the much more important credit and FX markets. This was evident very early Wednesday morning with outsized moves in the bond market. The White House stated this week that bond market volatility was a factor in President Trump’s 90-day tariff pause decision. We believe that both the 90-day tariff pause and Fed backstop will remove some of the major systemic risk concerns from the markets going forward.
TWO CHART OF THE WEEK IDEAS
Chart of the Week, Defensive Sectors, 4/13/25, British American Tobacco (BTI)
Sector: Consumer Staples
Price: 41.57
Stop: 34.38
Volatility: 3.33% (all charts should be considered as high volatility currently)
BTI is a high dividend stock (7%+) trading over 5 daily MAs, 4 are rising. Support at 38, breakout if a close over 43.
Weekly volatility note: Markets are trading in very wide, high volatility ranges, with the S&P 500 index below the 200-day moving average. Our posted ideas are based on the individual charts, not a directional market call. Some members research ideas at the market, others often develop a watchlist.
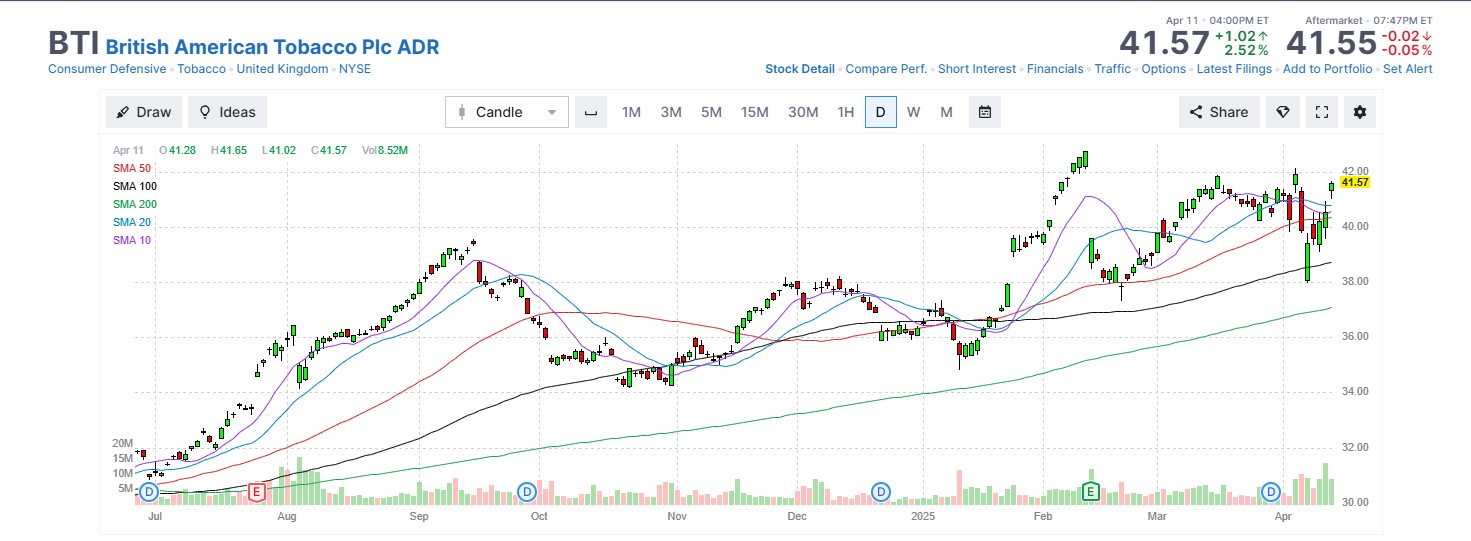
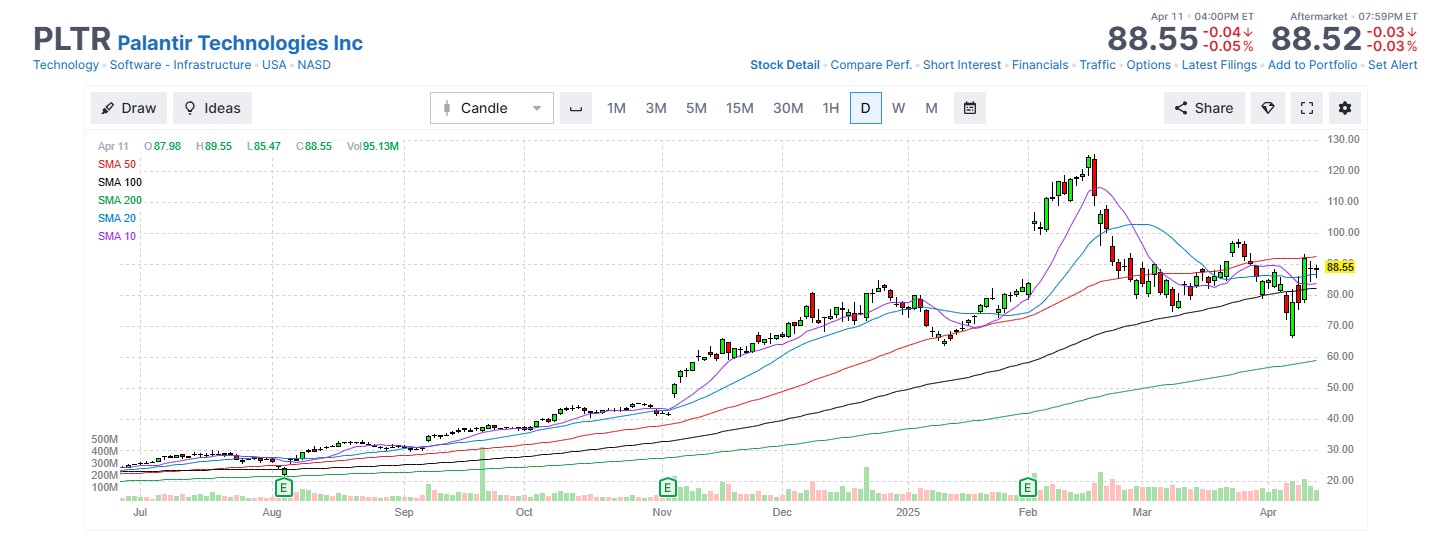
Chart of the Week, Tech Sector, 4/13/25, Palantir Technolgies
Sector: Technology
Price: 88.55
Stop: 74.26
Volatility: 14.55% (extreme)
PLTR is trading over 4 rising MAs and just below the 50-dma. A close over 99 could signal a range breakout. The volatility ranges here are very high. This was our Chart of the Day on 4/8/25.
Weekly volatility note: Markets are trading in very wide, high volatility ranges, with the S&P 500 index below the 200-day moving average. Our posted ideas are based on the individual charts, not a directional market call. Some members research ideas at the market, others often develop a watchlist.