MARCH 5, 2022
This blog and video was originally posted for Blue Chip Daily Members only, on 12/5/2021. Posting Tweet below:

On March 5, 2022, we made it available to the public.
ORIGINAL BLOG AND VIDEO:
This is only for educational purposes.
Past performance does not guarantee any future results and there is no implication here at all.
This is only a historical look at past rate hiking cycles.
Each market environment is unique.
While this information is assumed to be accurate, none of it should be used to make any investment decisions.
Video: https://vimeo.com/653523347/e72af2deea
THIS WEEK’S FED PIVOT
- Fed Chair Jerome Powell announced last Tuesday, 11/30/21, that the Fed could step up their timeline for taper and for possible interest rate increases.
- Markets had a quick response and long duration stocks with no current earnings and/or higher valuations sold off very sharply.
- Conversely, 279 large caps closed higher on the week.
- Of the top 20 performers, 19 have current earnings.
- Of the bottom 20 performers, only one has current earnings.
FED RATE HIKES
- The Fed began targeting the money supply to fight inflation in 1979.
- 1979 to 1980 saw rates adjusted from 10.25 to 20.0 to 8.5 and back to 20. No relevance there.
- 1984 to 1987 rates were being taken down from 10.50 to 7.25.
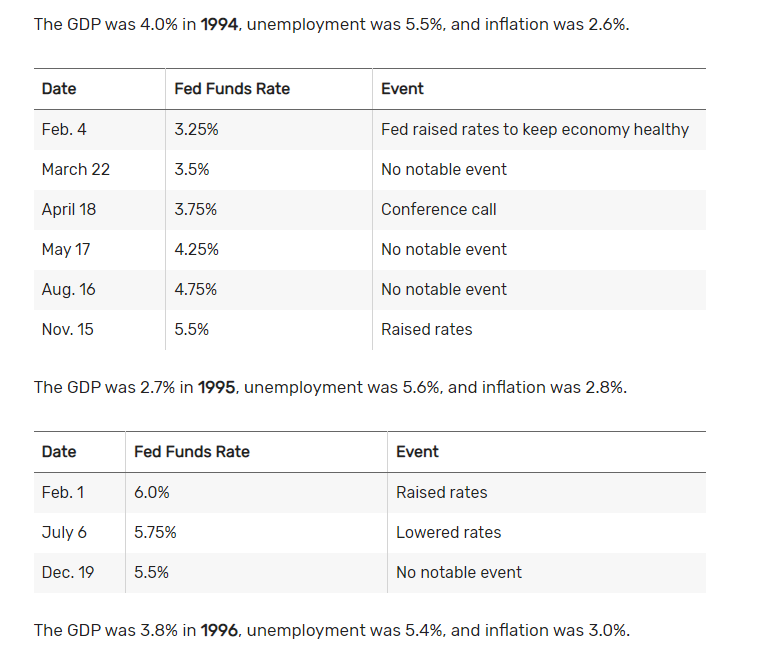
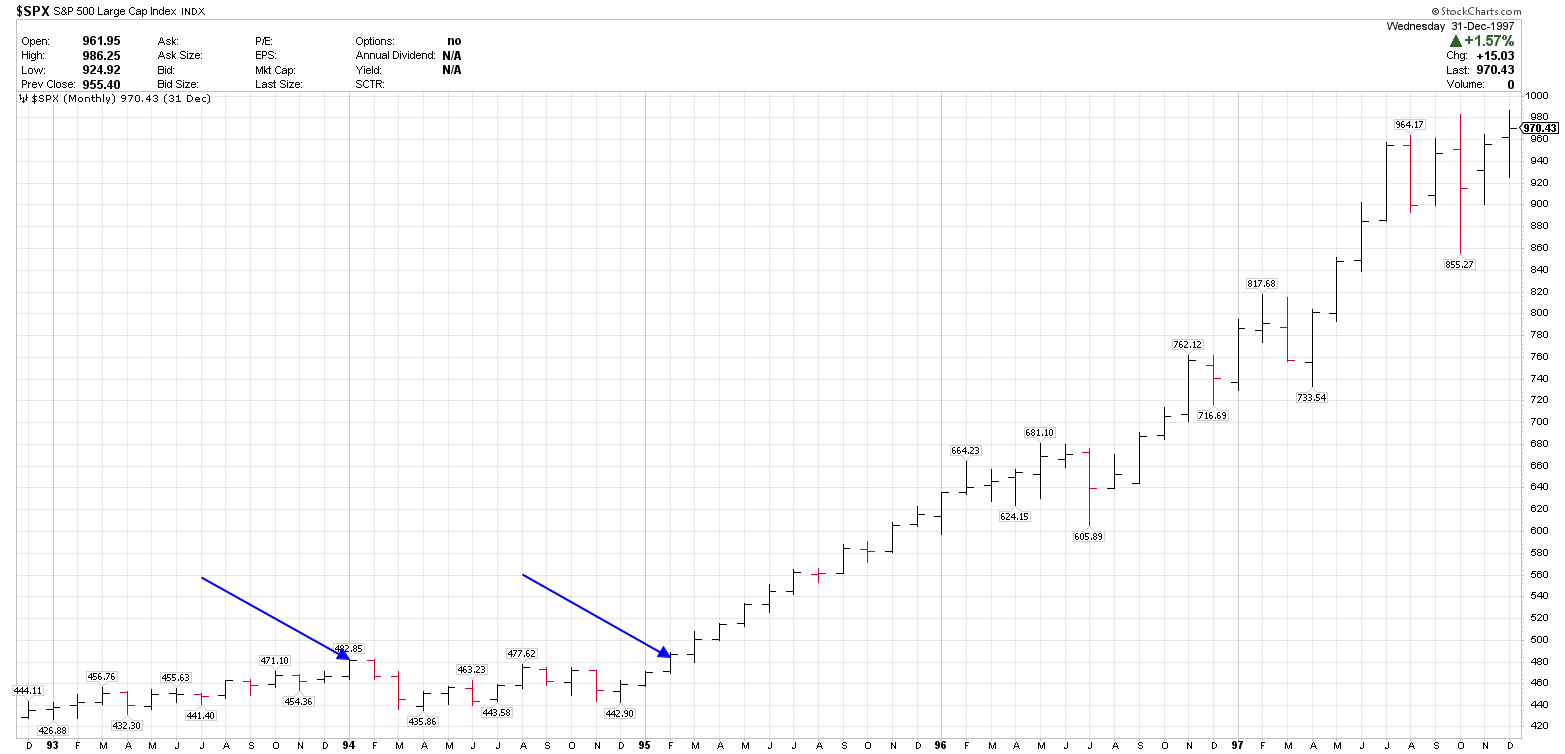
- Rates came down until 1994 at 3.25.
4 major rate hiking cycles: 1994, 1999, 2004, 2016
1994 RATE HIKES
2/4/94: 3.25%
2/1/95: 6.0%
7 hikes.
SPX start: 480
SPX peak: 762
9% pullback Feb 1994.
+58%
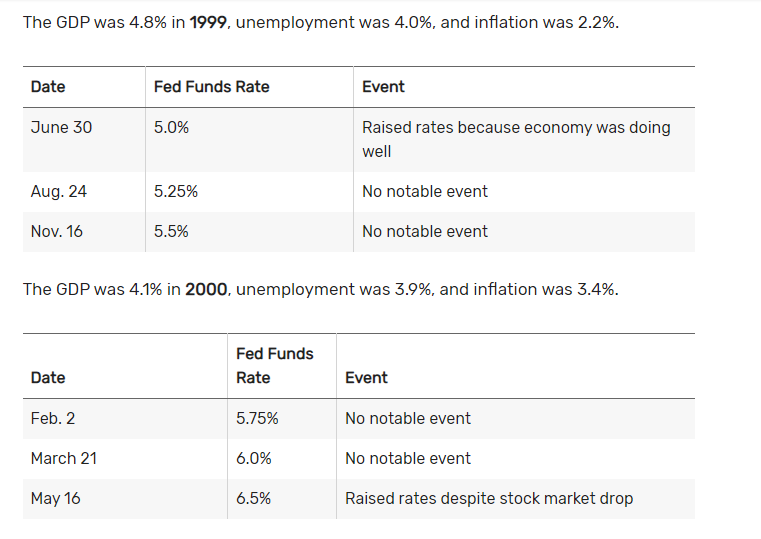
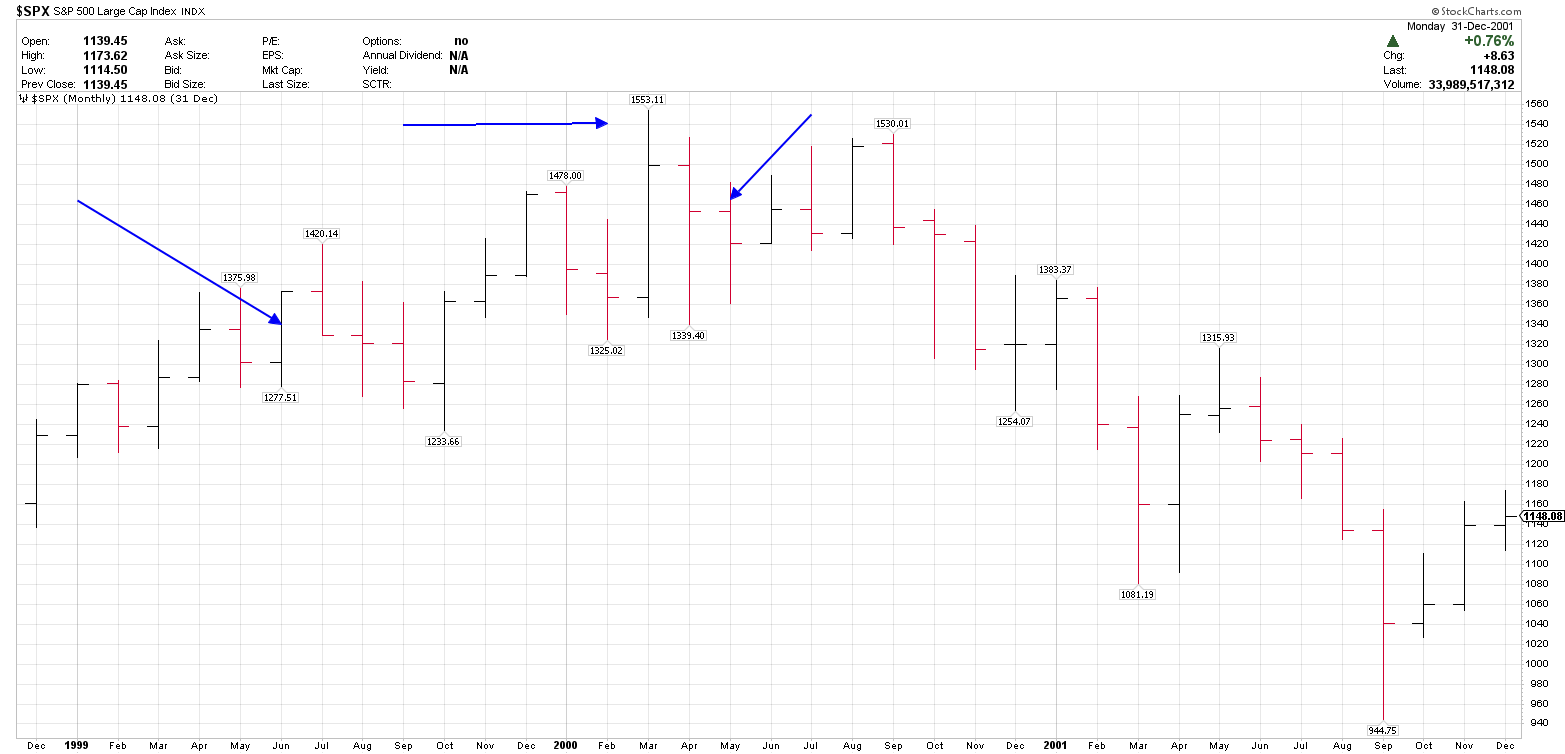
1999 RATE HIKES
6/30/99: 5.0%
5/16/00: 6.5%
6 hikes
SPX start: 1380 (This data was corrected and revised up from 1300, after I rewatched the video.)
SPX peak: 1553
+12.5%
NDX more than doubled in the same time period. 2100 to 4800.
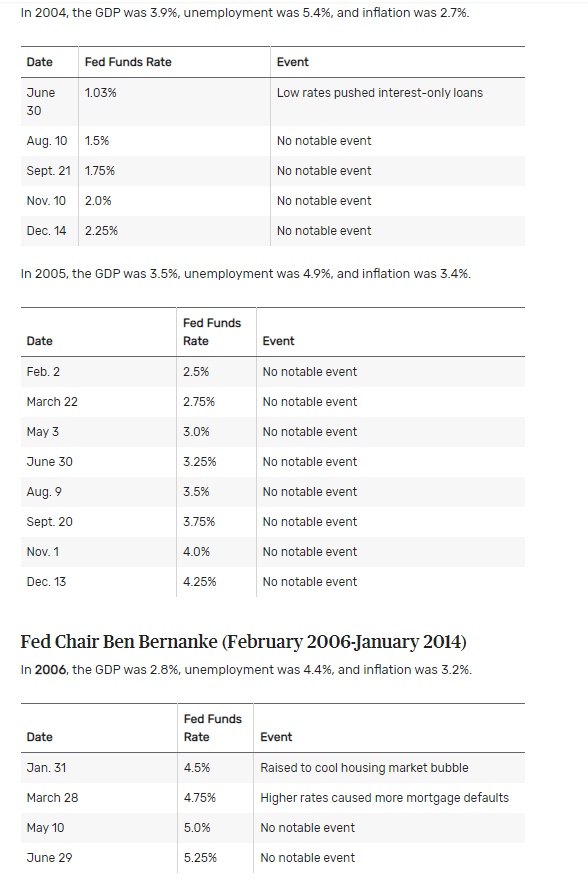
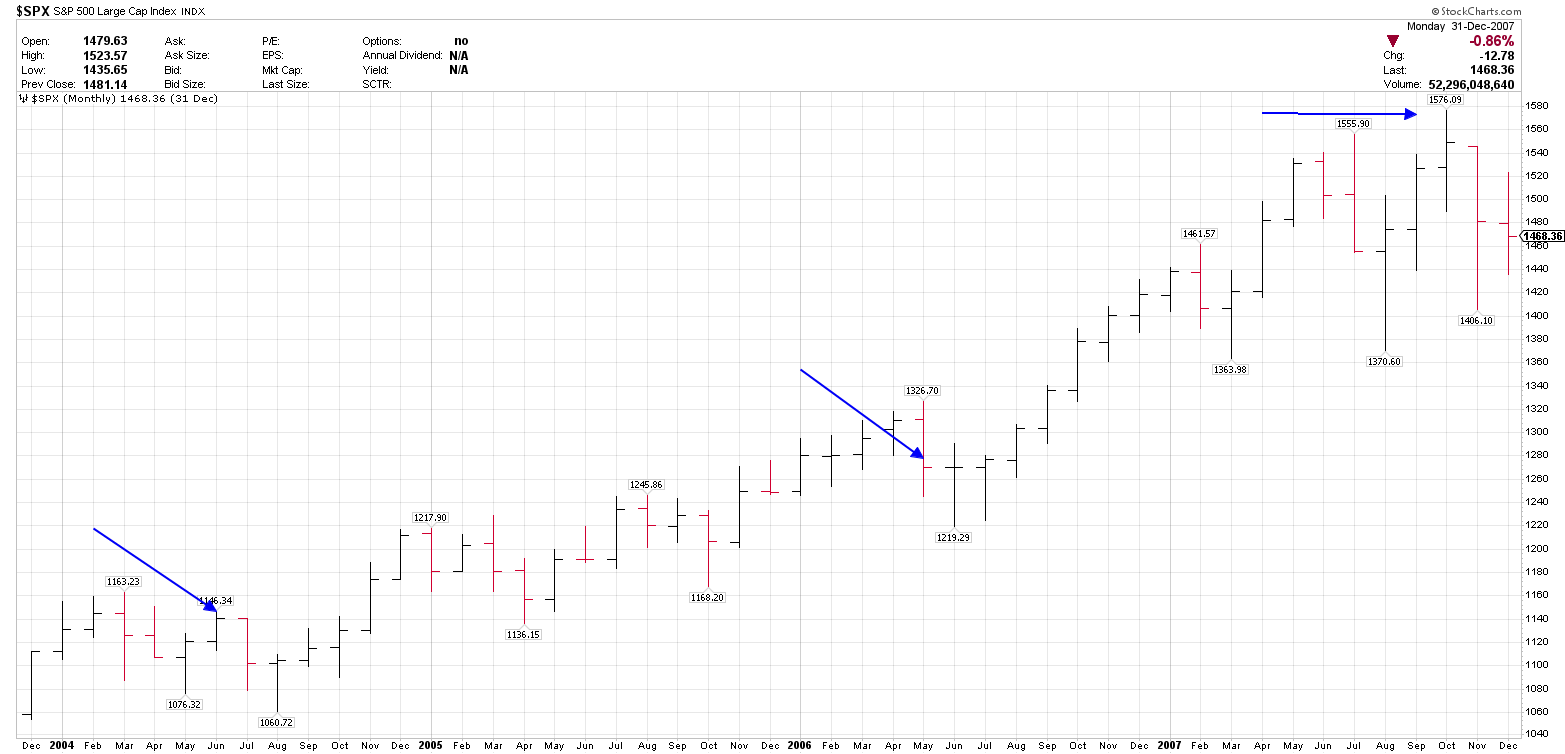
2004 RATE HIKES:
6/30/04 1.03%
6/29/06: 5.25%
16 rate hikes
SPX start: 1140
SPX peak: 1326 (end) 1576 (high)
7% pullback
+38%
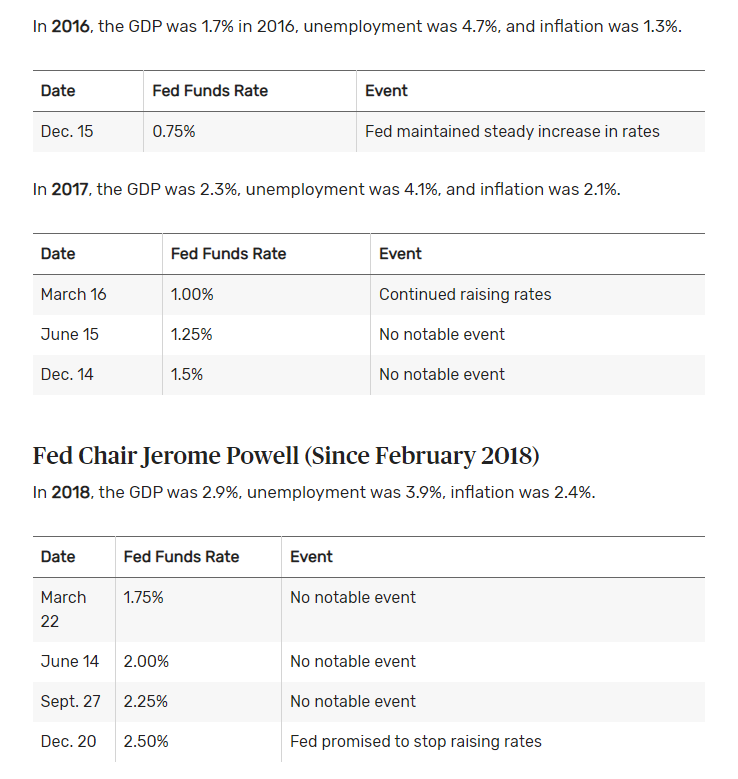
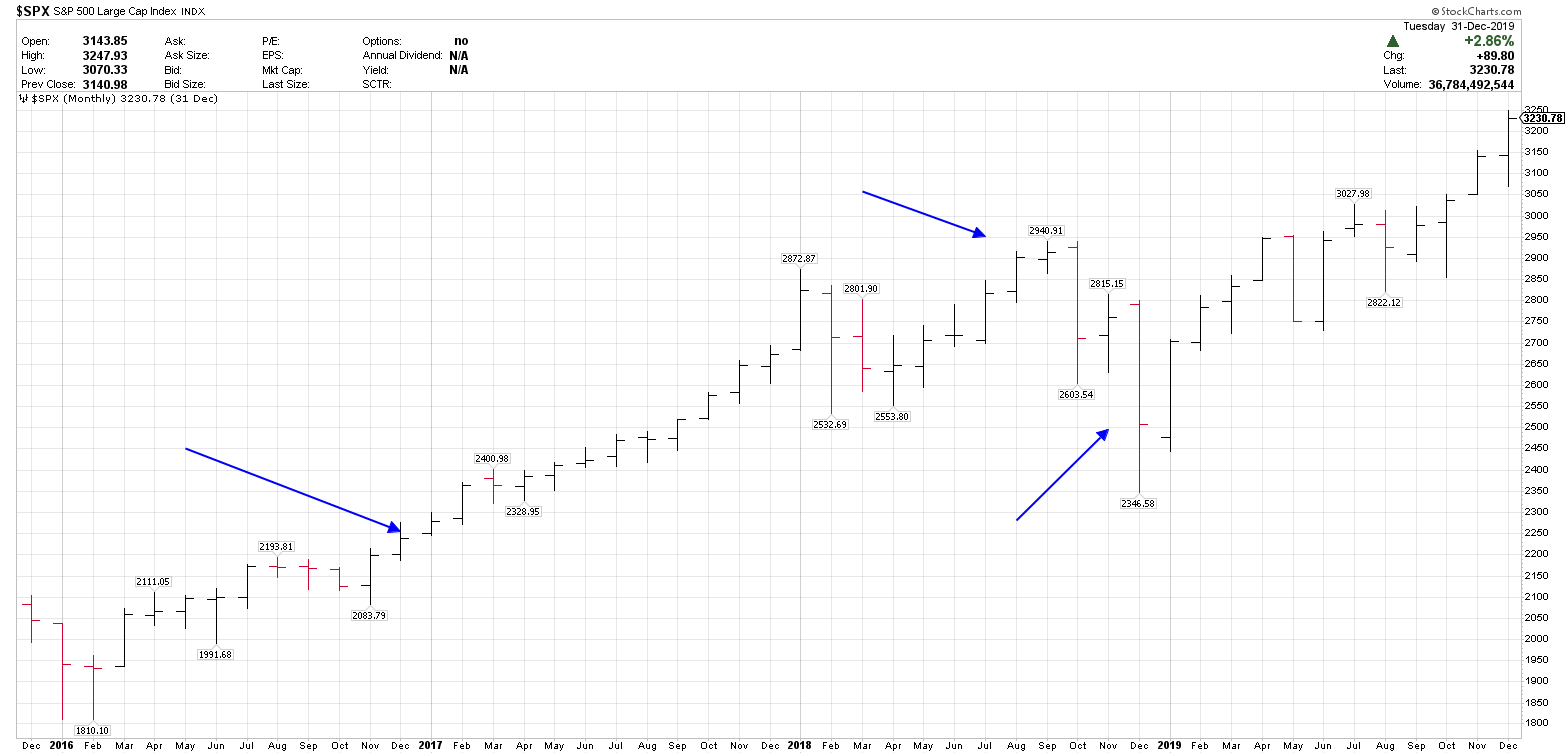
2016 RATE HIKES
12/15/16: 0.75%
12/20/18: 2.50%
8 hikes
SPX start: 2250
SPX peak: 2940
+30%
Historical out-performers:
1. High quality stocks, with current earnings.
2. Strong cash flow, including dividends.
3. Lower volatility.
4. Lower valuation, based on:
Low EV/EBITDA
High FCF/EV
Low P/B
Low P/E to growth (PEG)
5. Price momentum (30wk/75w week trend following)
Currently, energy, materials, healthcare, financials, select technology.
Historical under-performers:
1. Long duration, no current earnings.
2. High valuations.
3. High volatility.
While it is believed to be accurate, there is no representation made and it should not be used to make any investment decisions.
Fed rate hikes source: History of the Fed Funds Rate: Highs, Lows, and More (thebalance.com)