This is only for educational purposes.
Past performance does not guarantee any future results and there is no implication here at all.
This is only a historical look at past rate hiking cycles.
Each market environment is unique.
While this information is assumed to be accurate, none of it should be used to make any investment decisions.
Video: Please Join to View
THIS WEEK’S FED PIVOT
- Fed Chair Jerome Powell announced last Tuesday, 11/30/21, that the Fed could step up their timeline for taper and for possible interest rate increases.
- Markets had a quick response and long duration stocks with no current earnings and/or higher valuations sold off very sharply.
- Conversely, 279 large caps closed higher on the week.
- Of the top 20 performers, 19 have current earnings.
- Of the bottom 20 performers, only one has current earnings.
FED RATE HIKES
- The Fed began targeting the money supply to fight inflation in 1979.
- 1979 to 1980 saw rates adjusted from 10.25 to 20.0 to 8.5 and back to 20. No relevance there.
- 1984 to 1987 rates were being taken down from 10.50 to 7.25.
- Rates came down until 1994 at 3.25.
4 major rate hiking cycles: 1994, 1999, 2004, 2016
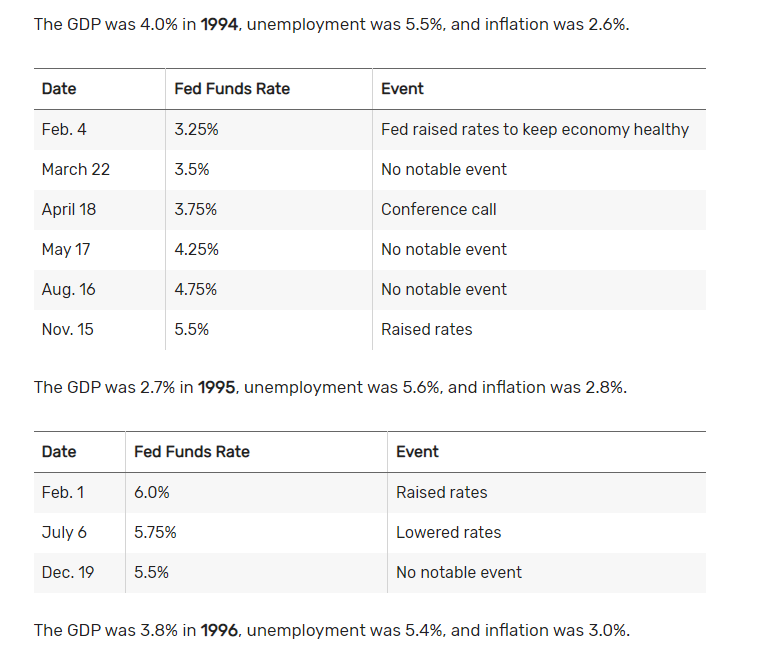
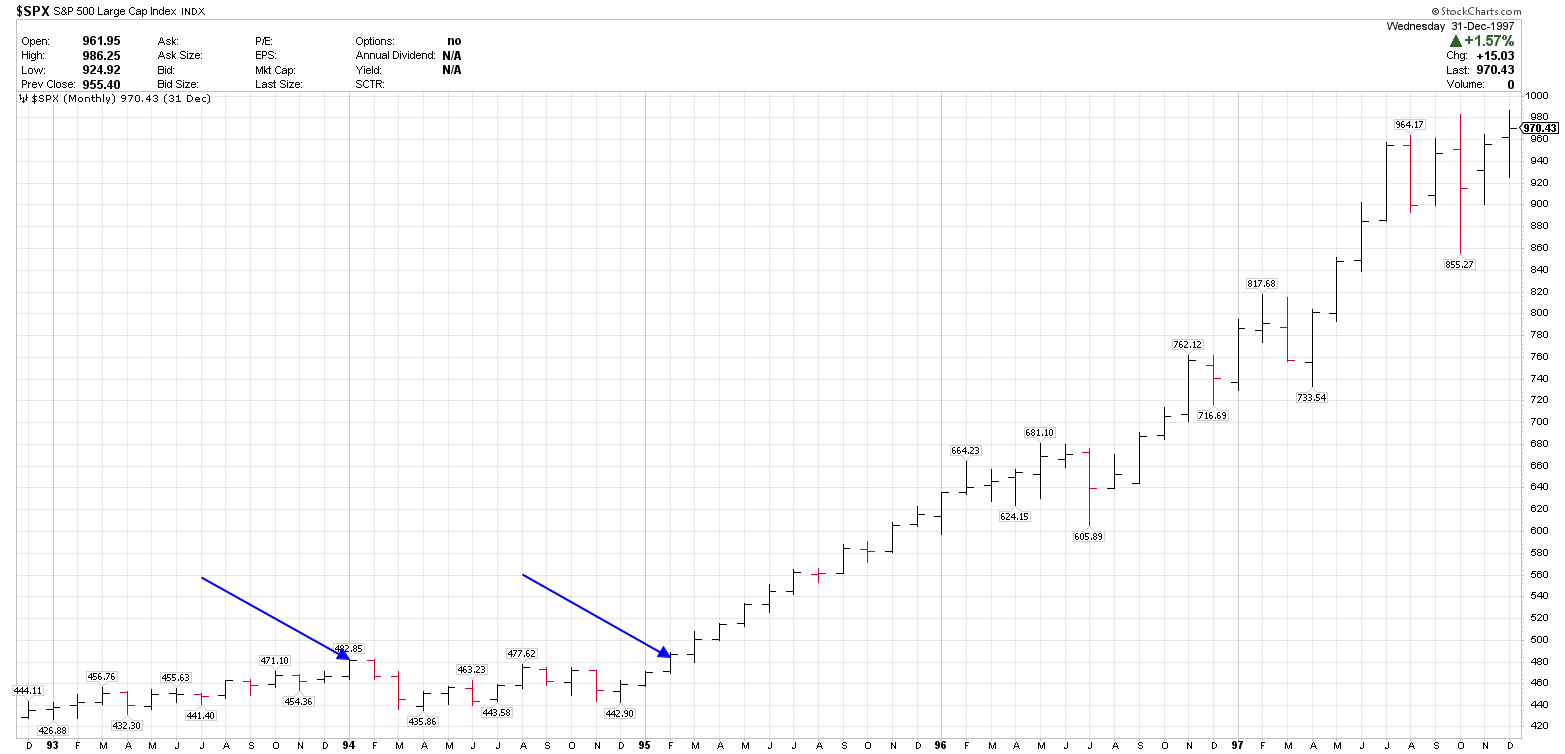
1994 RATE HIKES
2/4/94: 3.25%
2/1/95: 6.0%
7 hikes.
SPX start: 480
SPX peak: 762
9% pullback Feb 1994.
+58%
To read the entire Members blog and video, along with our list of sectors to focus on and those to avoid, please join here: Blue Chip Daily Trend Report
FULL MEMBERS ONLY BLOG & VIDEO: Our View on the Fed Pivot – Blue Chip Daily Trend Report