– All of the position data and statistics in this post are taken exactly from our real time tracking spreadsheet on our website, as of the close of business on 7/31/20.
– Blue Chip Daily subscribers have full 24/7 access to this information and tracking sheet.
– All account activity is updated, posted, and reported in real time.
– Our reporting account is a real money brokerage account with actual positions as posted – this is not a paper trading account or a simulated account.
SUMMARY
19 Open Positions
Oldest position, 3/26/20
17 (currently profitable) green
2 (currently unprofitable) red
Average of the 19 Positions is +29.87%
Best +81.1%
Worst -3.3%
5 closed winners at +9.8% average
3 stops hit at -12%, 15%, 15% each
Each stop is within pre-defined limits.
3 closed breakeven positions
– We have scaled partial gains in some positions on the way up and moved up the stops.
Position performance data taken from our 24/7 tracking spreadsheet on the Members Website
– As of close of business 7/31/20
– This is a limited version of the actual tracking sheet on the website, which tracks:
– entry date
– price
– stop risk levels
– adjusted stops
– position size/weighting
– position volatility
– open risk
– scaled exits
– final exits.
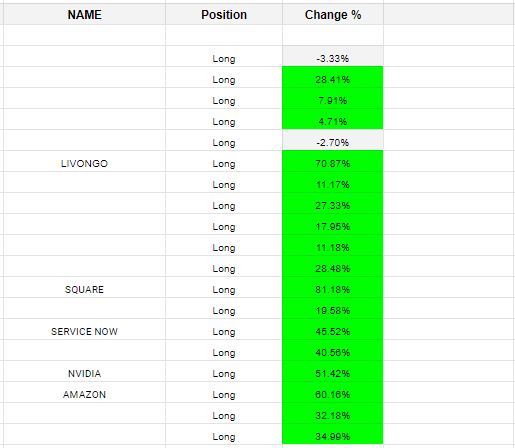
TOP 5 PERFORMING OPEN POSITIONS
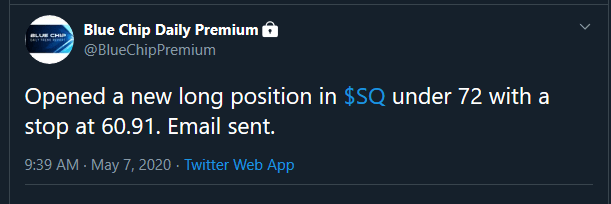
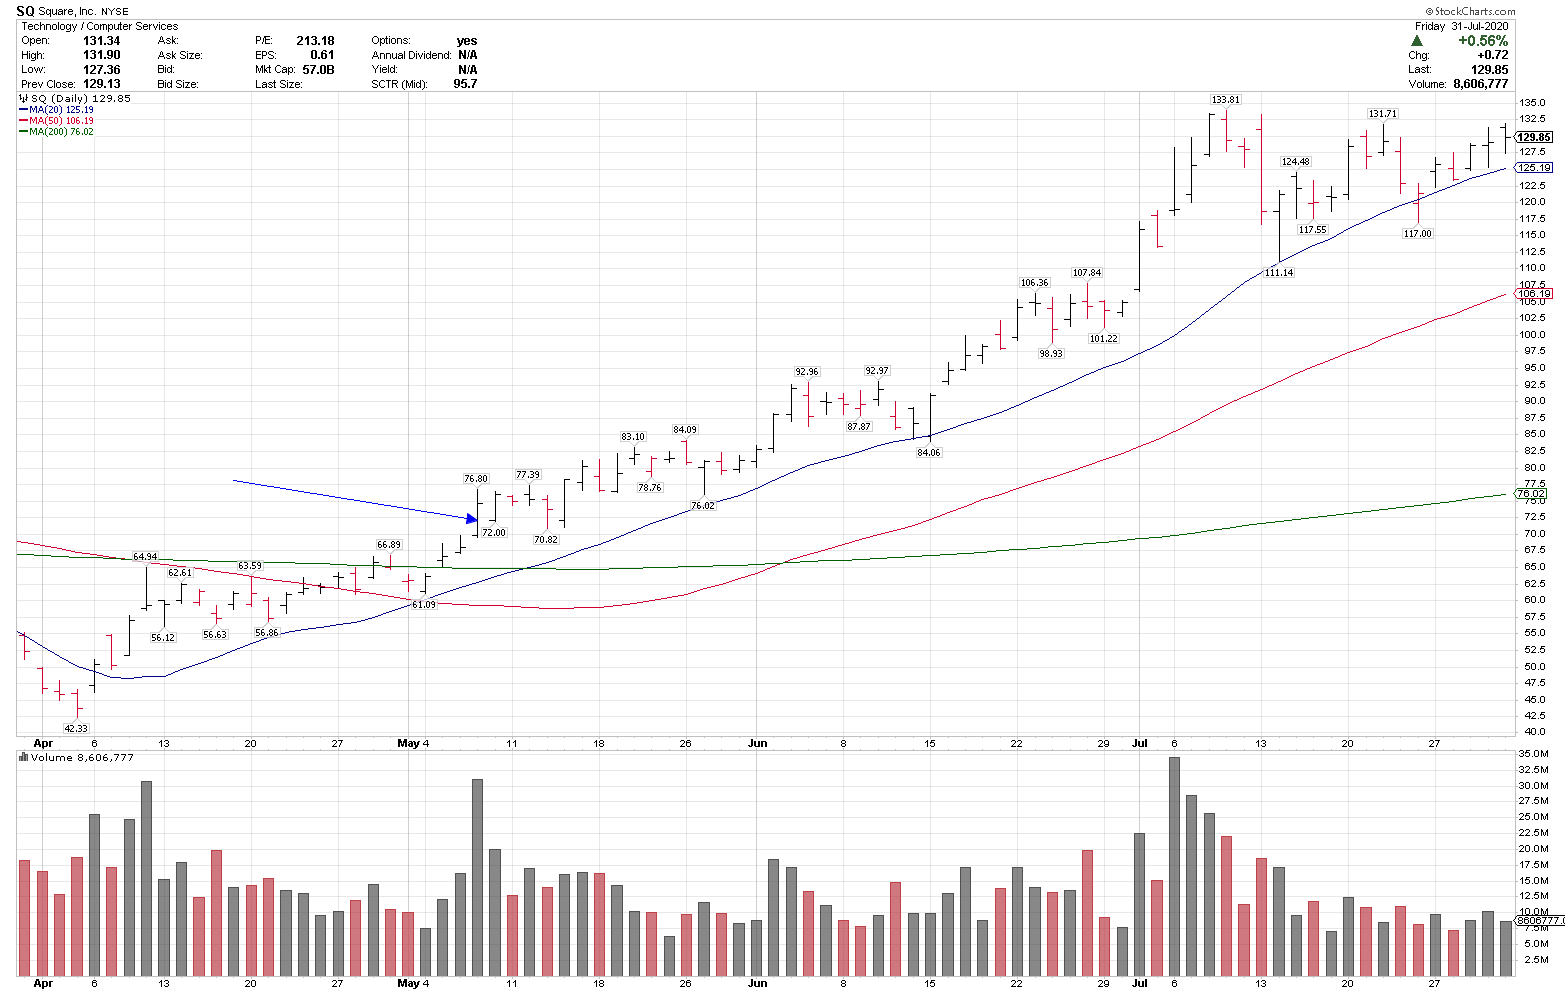
1. Square, SQ, +81%
5/07/20
$71.67
7/31/20
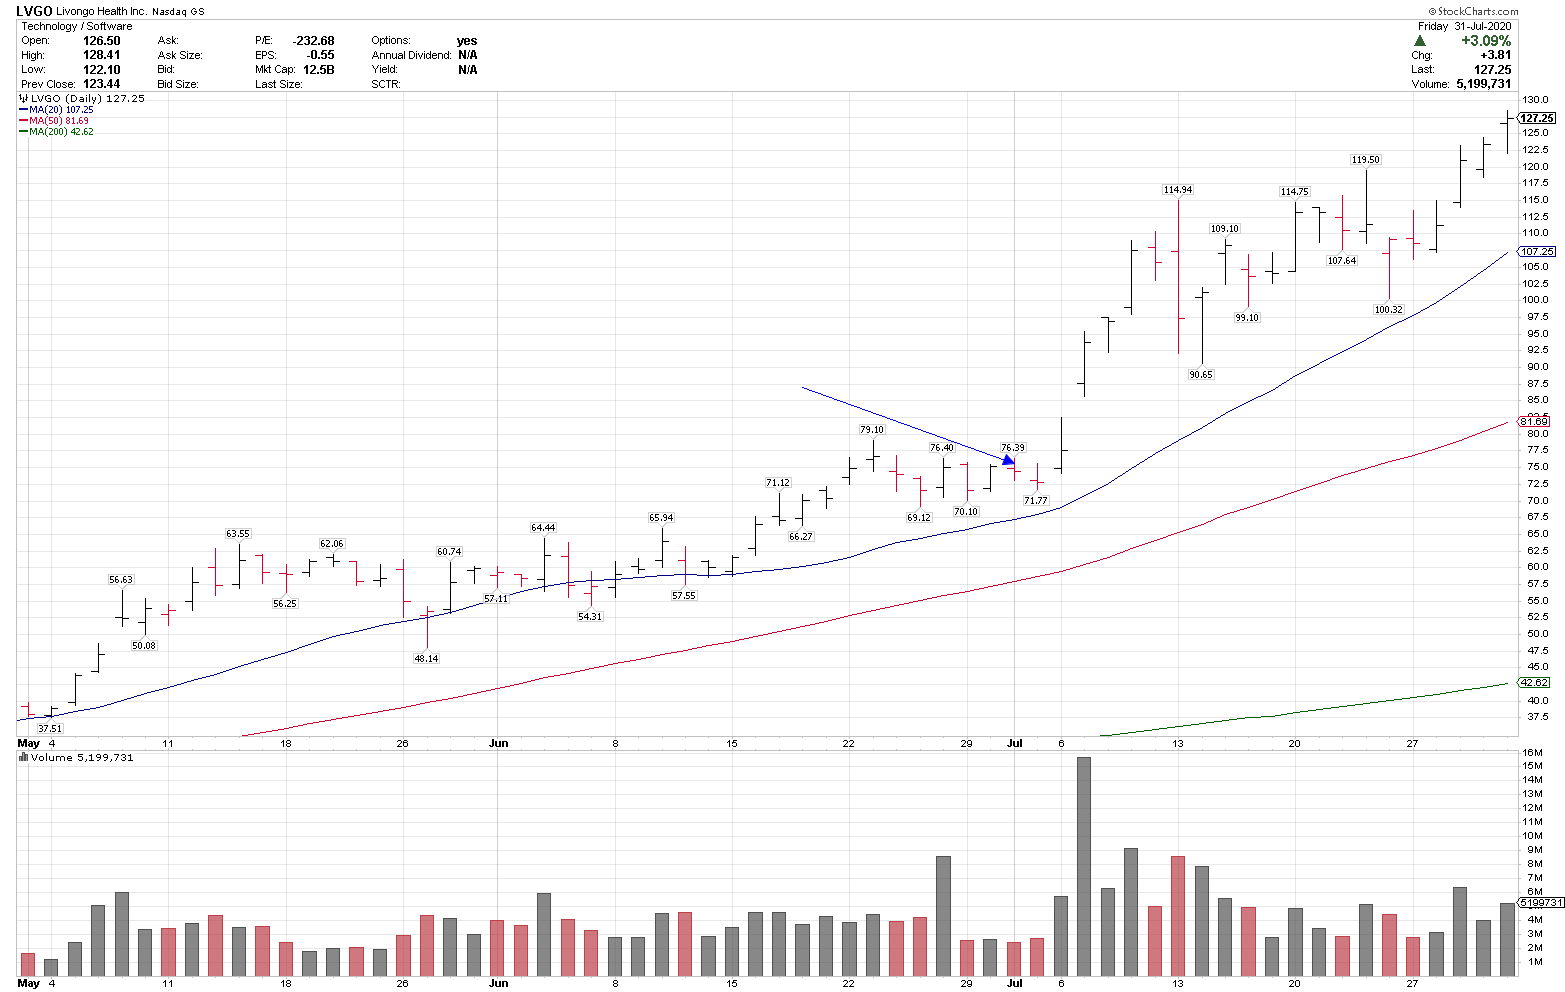
2. Livongo, LVGO +70%
7/01/20
$74.47
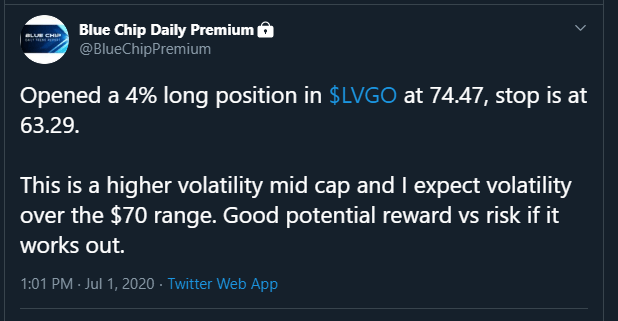
7/31/20
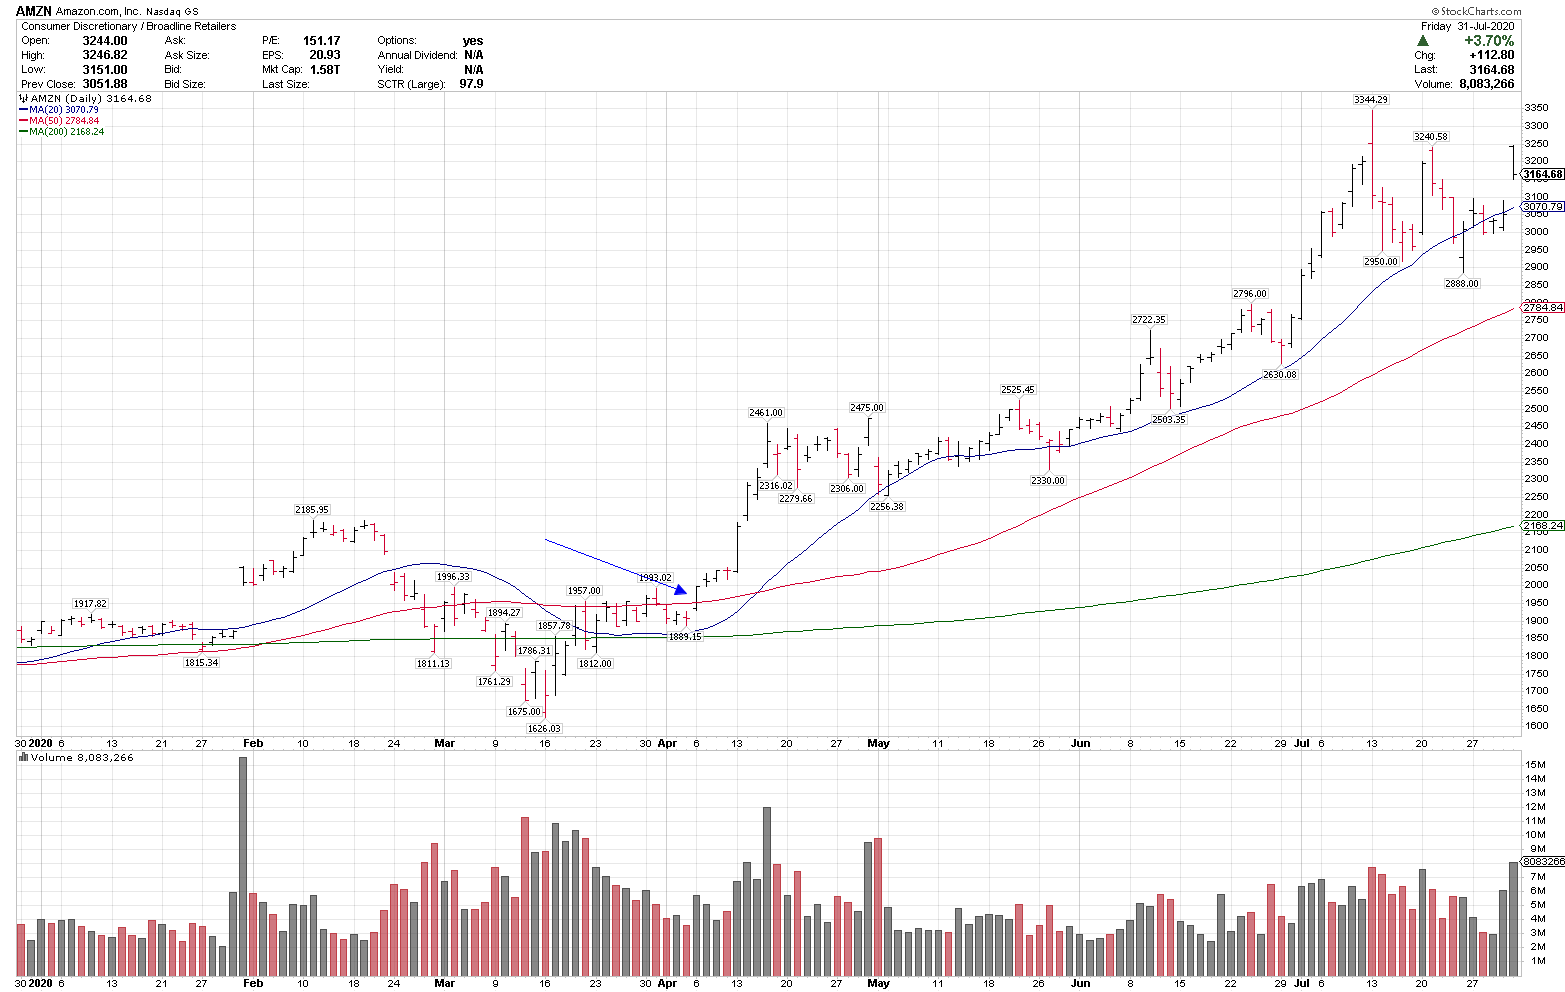
3. Amazon, AMZN, +60%
4/06/20
$1975.98
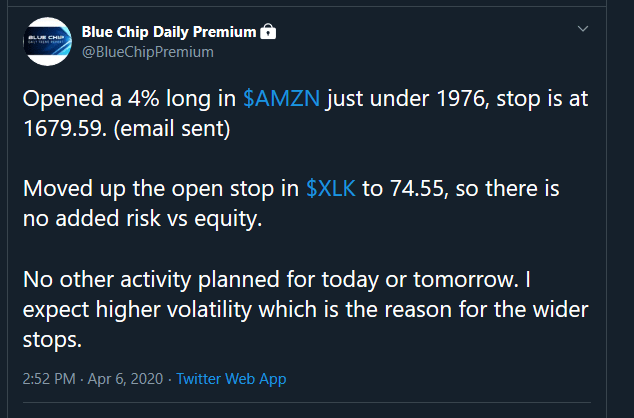
7/31/20
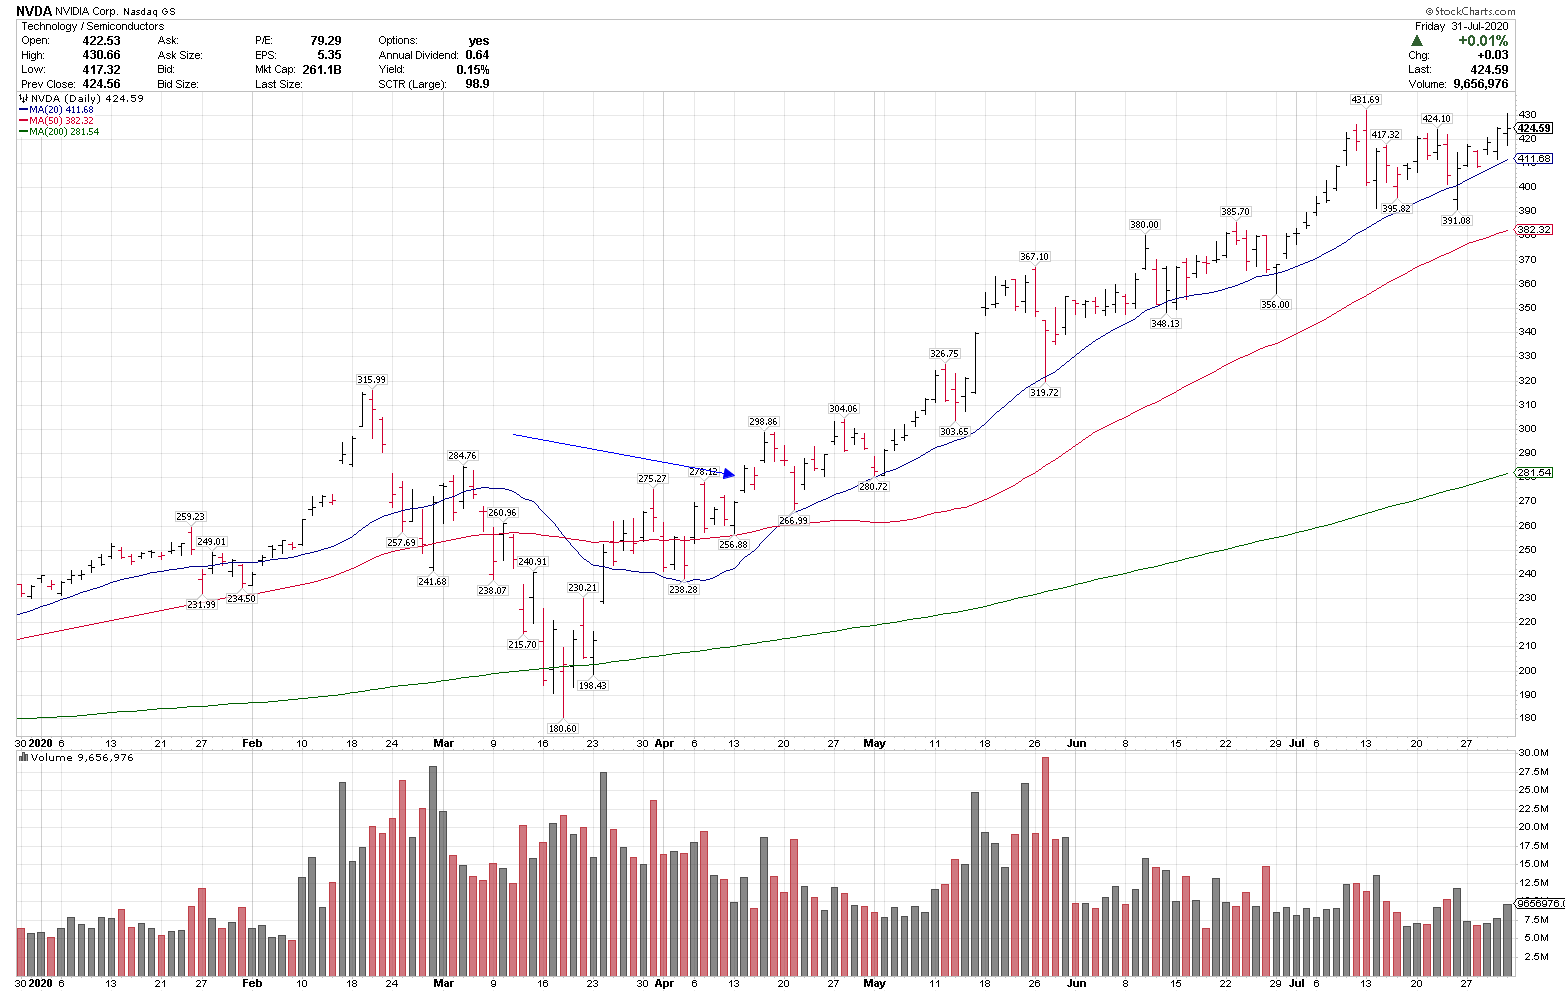
4. Nvidia, NVDA, +51%
4/14/20
$280.41
7/31/20
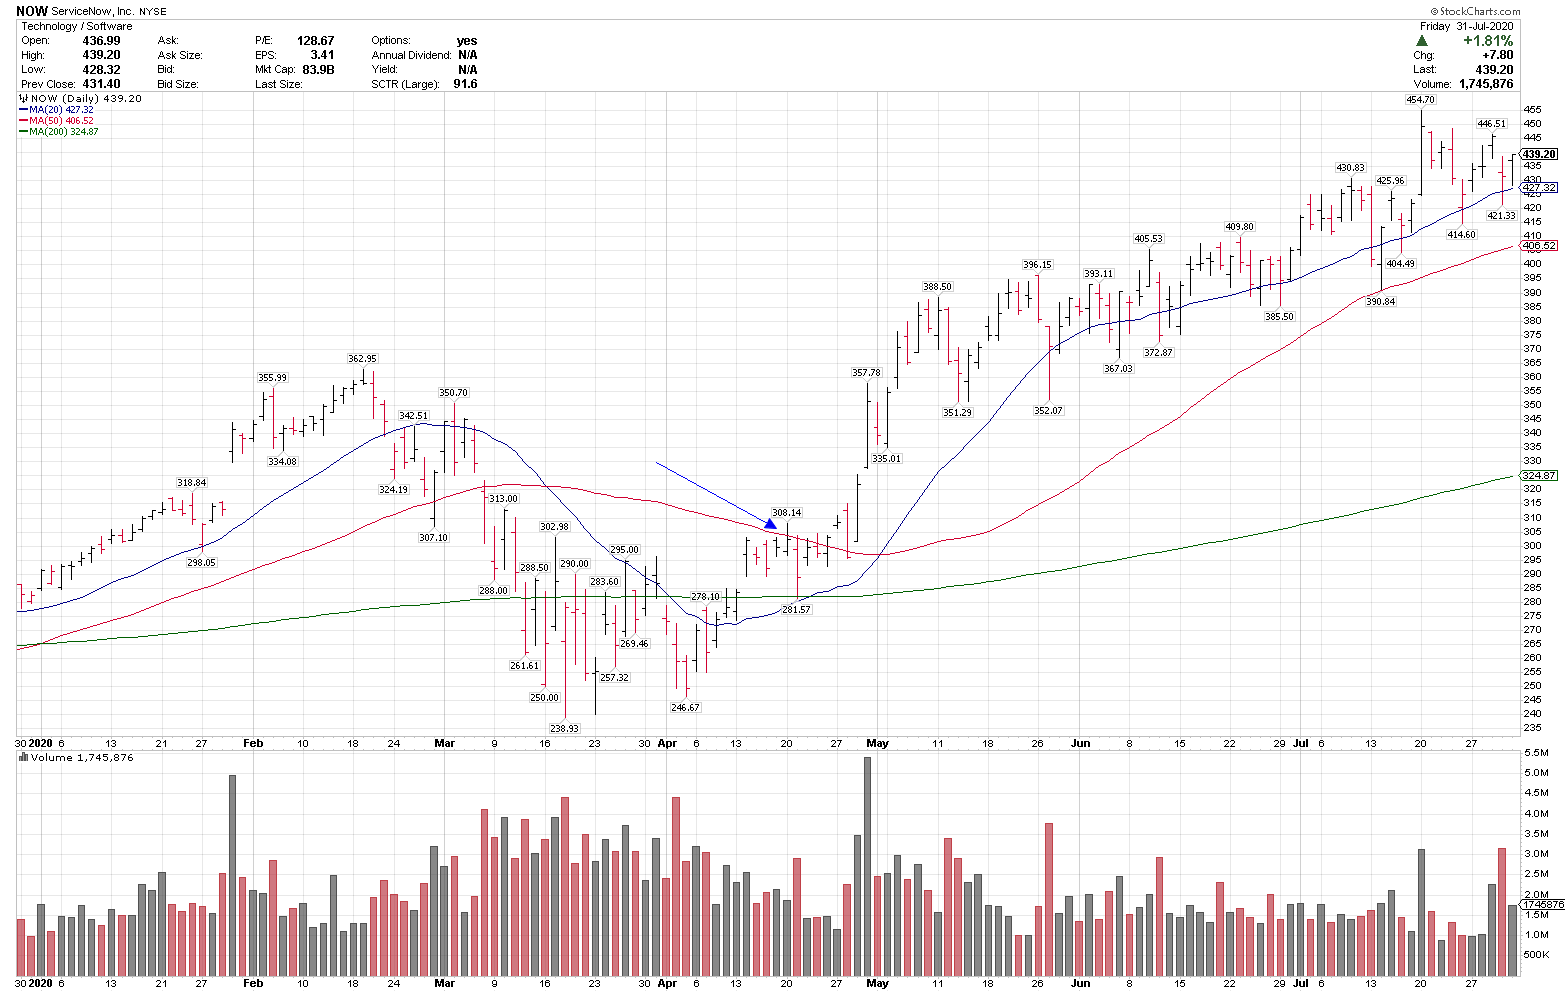
5. Service Now, NOW, +45%
4/20/20
$301.81
7/31/20