There has been alot of concern in the markets and the media over the last few weeks, especially last week, about rising inflation, rising bond yields and the effect on stocks overall. In the post below, I will outline a few points:
1. Inflation is already in the system, (please see the Commodity/Asset prices chart below) and is not necessarily a negative for stocks at all. As with most market cycles, there will be sector and stock winners & losers. We will cover the expected winners below.
OUR TOP 20 INFLATION IDEAS: https://bluechipdaily.com/our-best-inflation-ideas-may-2021/
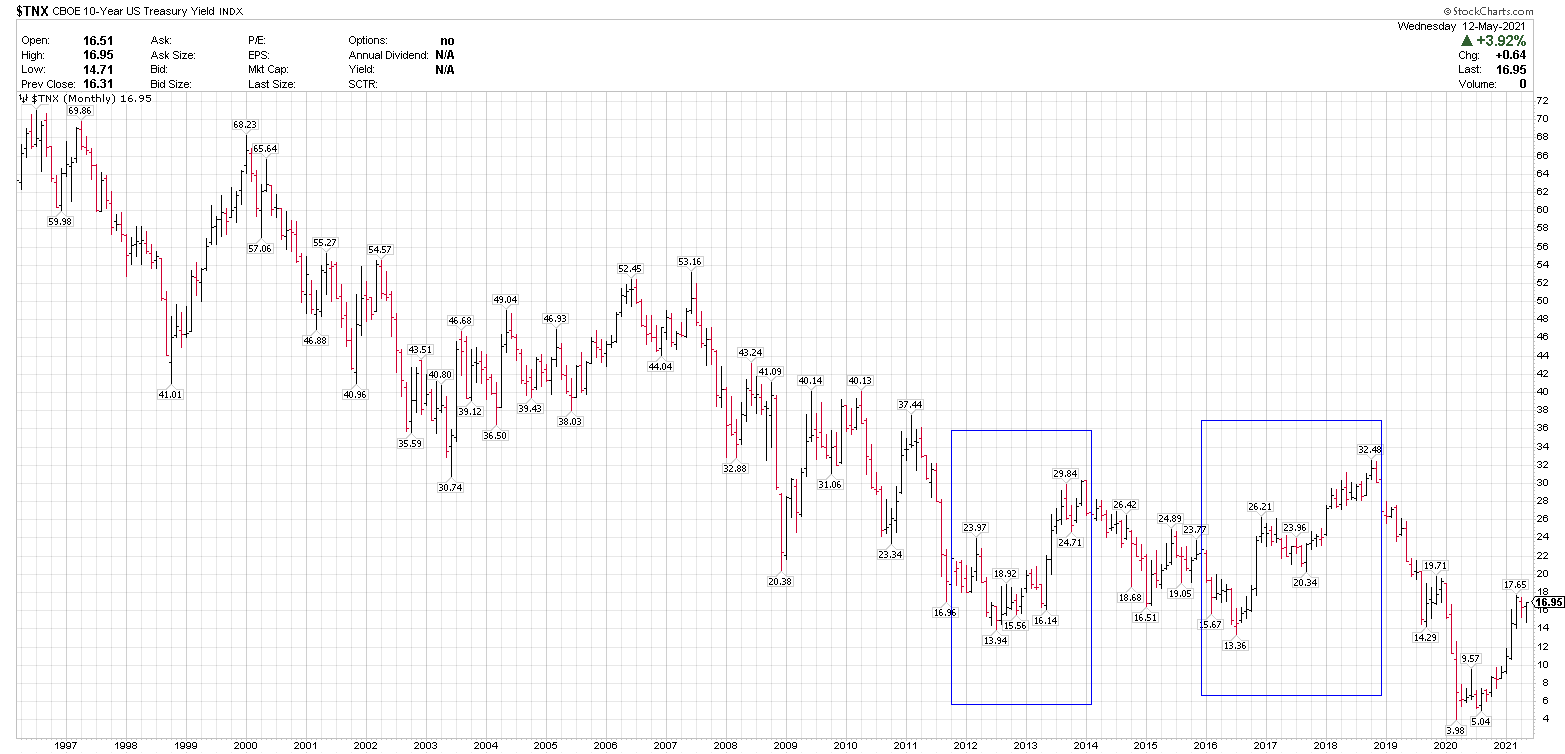
2.Prior to this current cycle, there have been two instances over the last 10 years where 10-year UST yields (TNX) have doubled, (please see the TNX Monthly chart below).
2012-2013 1.394 to 2.984
2016 1.336 to 2.621 & 2016 – 2018 1.336 to 3.248
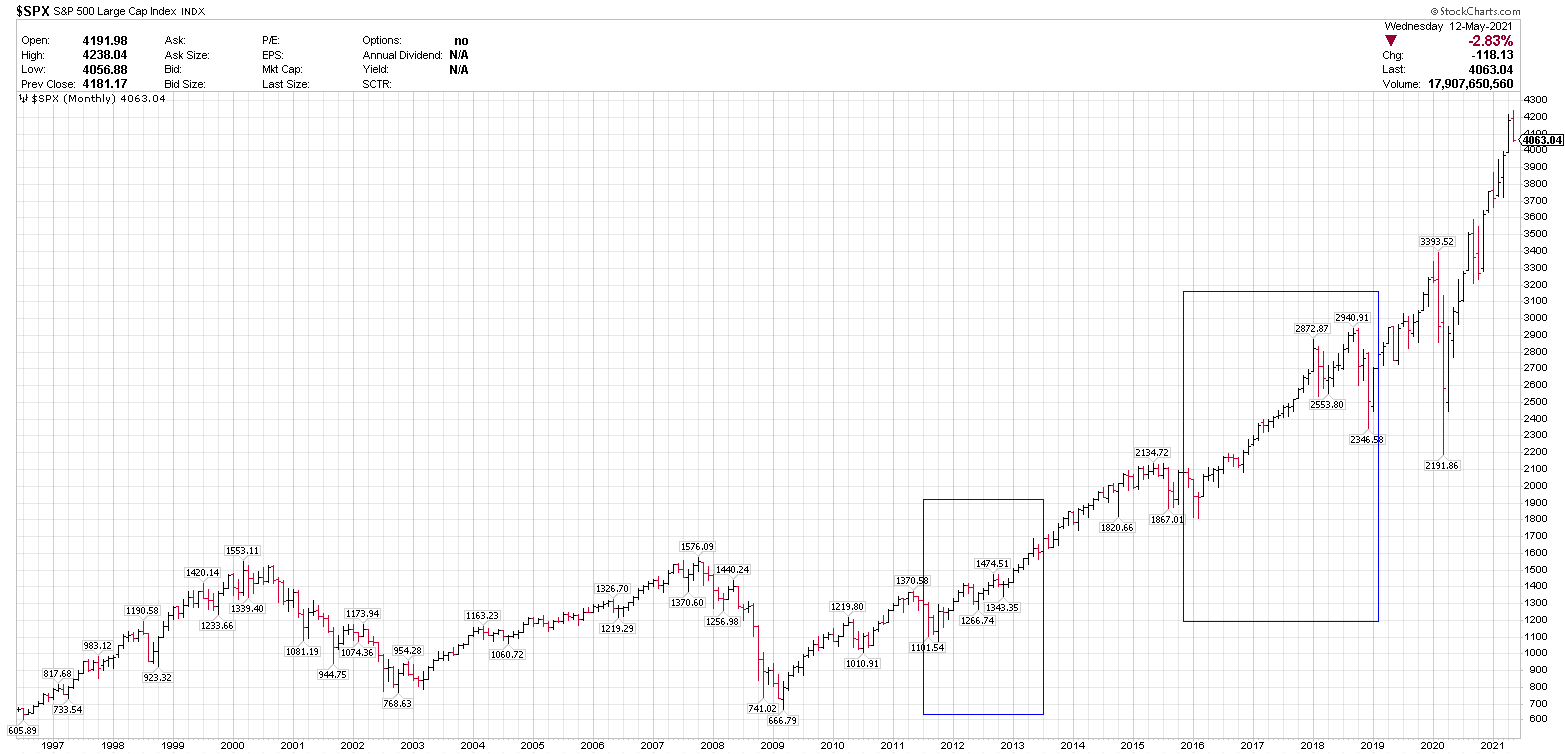
3. In both instances, stocks as measured by the S&P 500 (SPX) moved higher both times, (please see the SPX Monthly Chart below).
TNX vs SPX Levels 2012-2013
July 2012: TNX 1.394 SPX 1340
March 2013: TNX 2.086 SPX 1570
Sep. 2013: TNX 2.984 SPX 1720
TNX VS SPX Levels 2016 – 2018
July 2016: TNX 1.336 SPX 2200
Nov. 2016: TNX 2.621 SPX 2083
Sep. 2018: TNX 3.248 SPX 2940
4. It is very important to understand that none of this data is a prediction, or inference of any future performance. What happened in the past will not necessarily repeat in the future. It does show however, that bond yields have risen sharply in the recent past and stocks have moved higher as well.
TNX MONTHLY
SPX MONTHLY