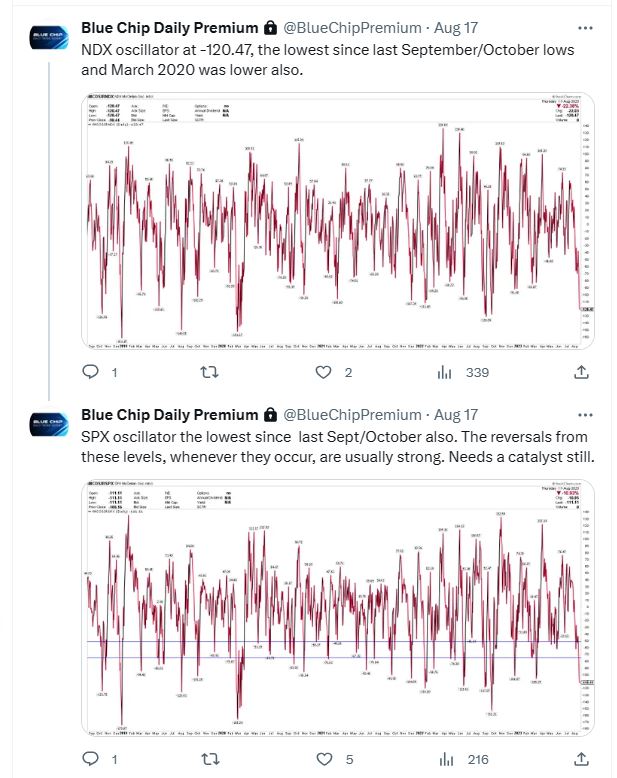
On August 17 we informed our subscribers that the major indices were at the most oversold levels since last September/October and to expect a sharp reversal.
The indices (SPX) (NDX) made their recent low the next morning.
<Full details below of how we managed our long positions and made buys near the recent lows>.
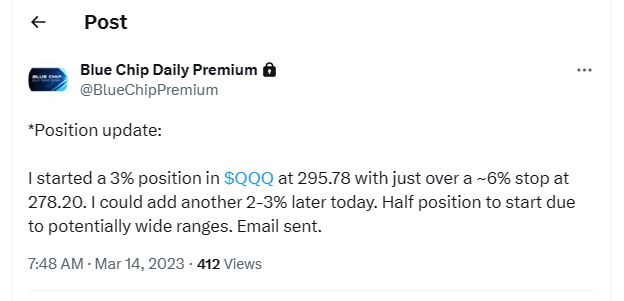
We started building a long position in Nasdaq 100 ETF (QQQ) on March 14, 2023, near the lows of the regional bank led market selloff.
(QQQ) gained +31.1% over the next 5 months.
We have booked partial gains and we are still holding a core position.
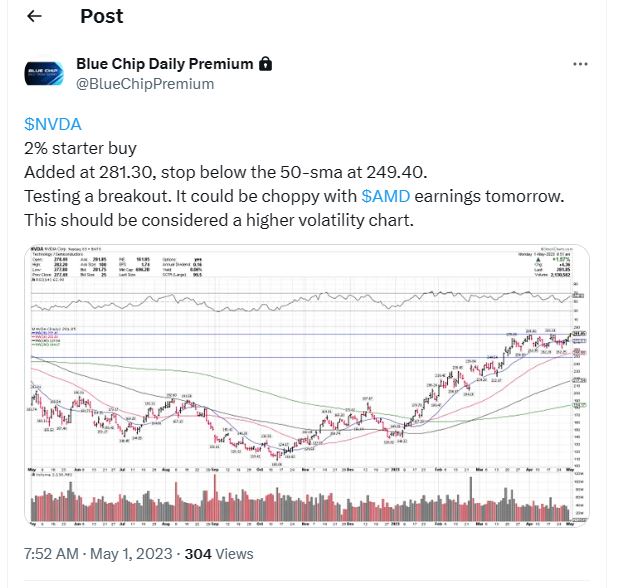
 We started buying Nvidia (NVDA) on May 1, 2023 at 281.30.
(NVDA) gained +78.6% over the next 4 months.
We have booked partial gains and we are still holding a core position.
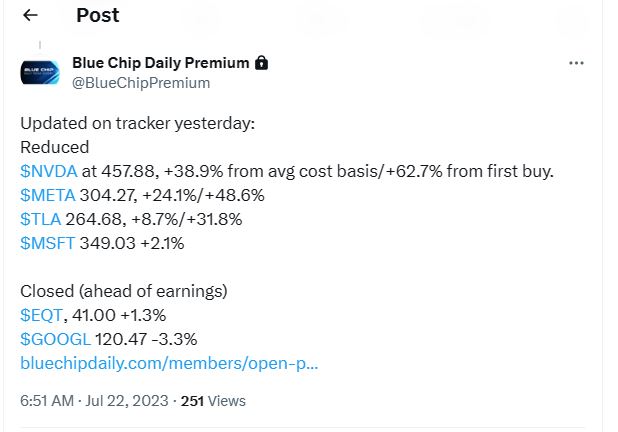
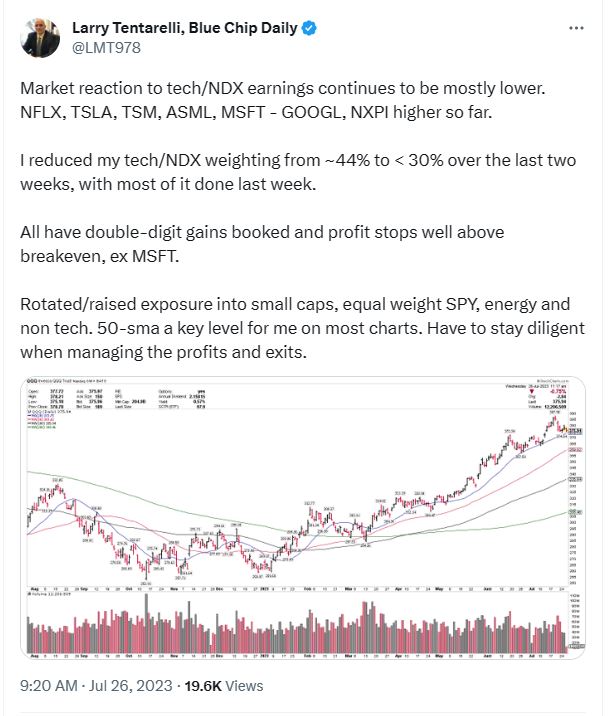
On July 20 and July 21 we started to book partial gains across the board in many of our Nasdaq 100 related positions, that we had been buying actively from March through June 2023.
We are able to lock in gains in many positions before 5-20% drawdown in many (NDX) majors over the next 30 days.
 On August 17 we informed our subscribers that the major indices were at the most oversold levels since last September/October and to expect a sharp reversal.
The indices (SPX) (NDX) made their recent low the next morning.
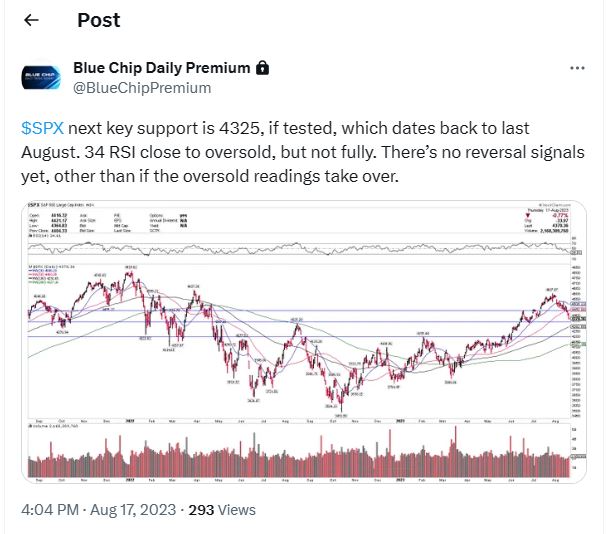
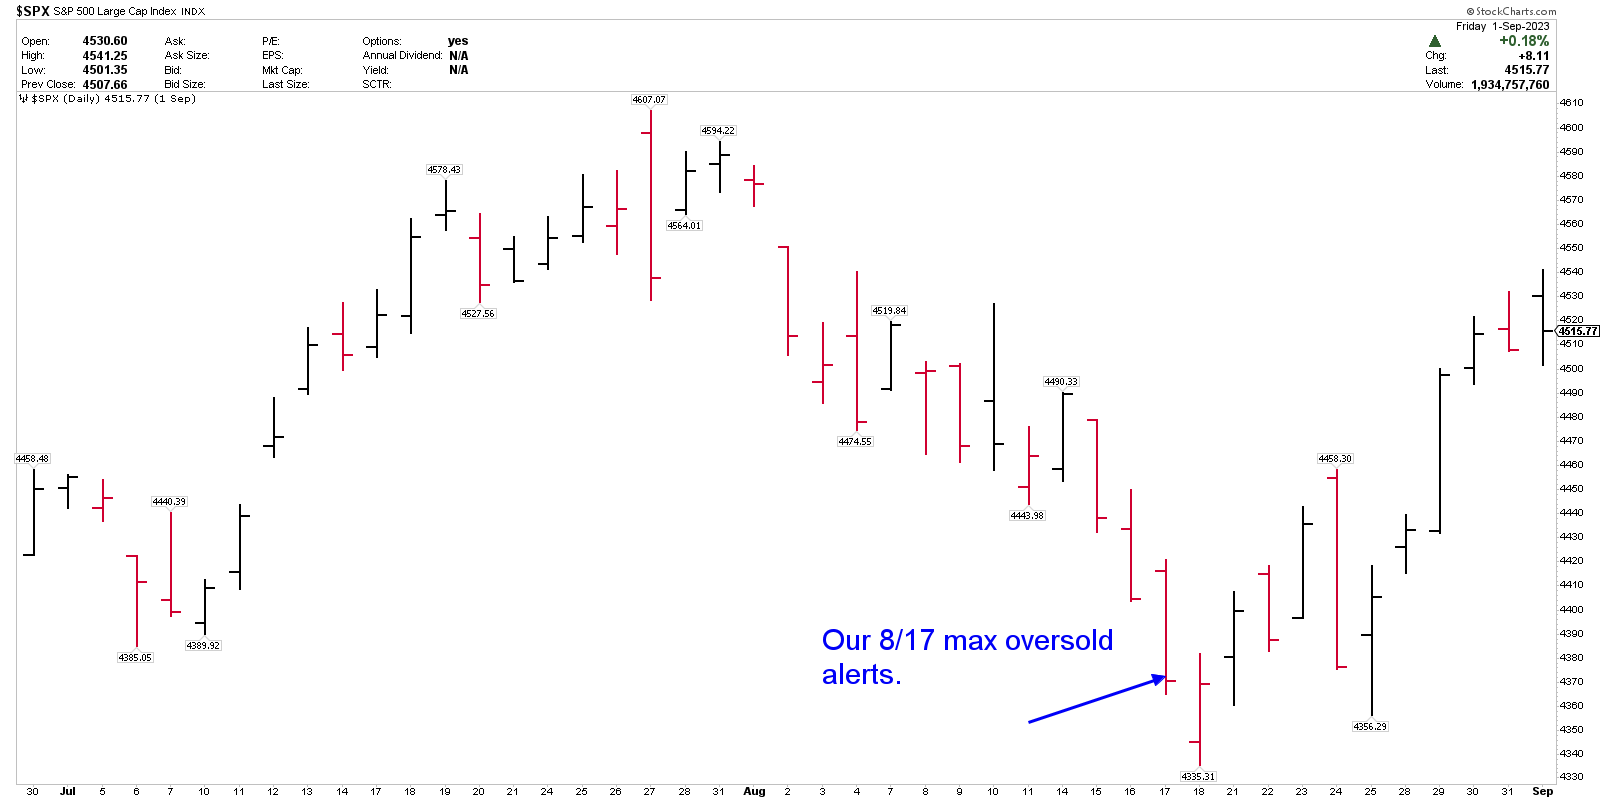 On August 17, at (SPX) 4370, we informed subscribers that (SPX) 4325 was a key support level.
The low was the next day at 4335.
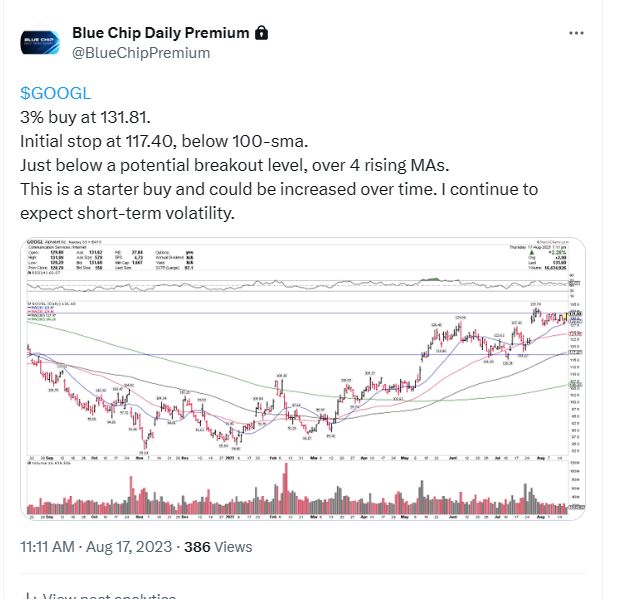
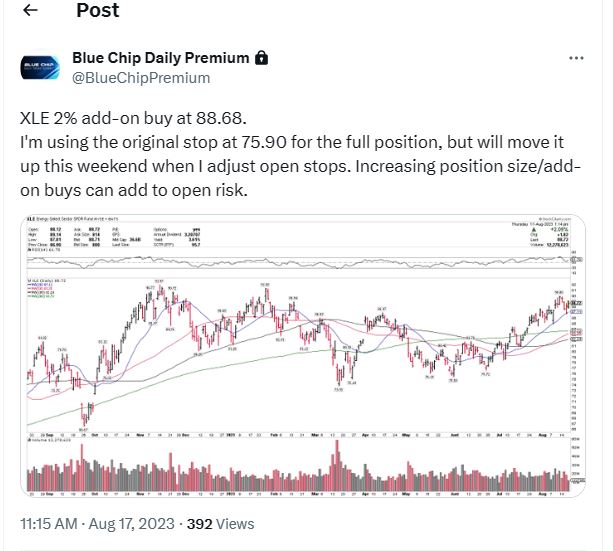
August 17, near the index lows, we started to buy Alphabet (GOOGL) and added to or Energy Sector ETF position (XLE).
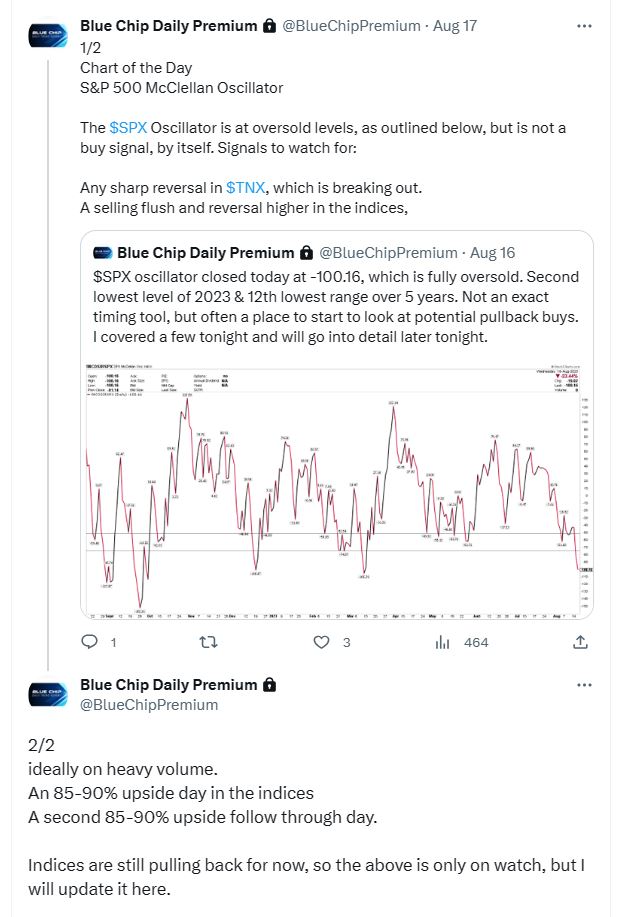
August 17, we informed Members that reversal signs we would like to see:
Any sharp reversal in (TNX) <bond yields> which is breaking out. <This occurred on 8/23/23>.
A selling flush and reversal higher in the indices, ideally on heavy volume. <This occurred on 8/18/23>.
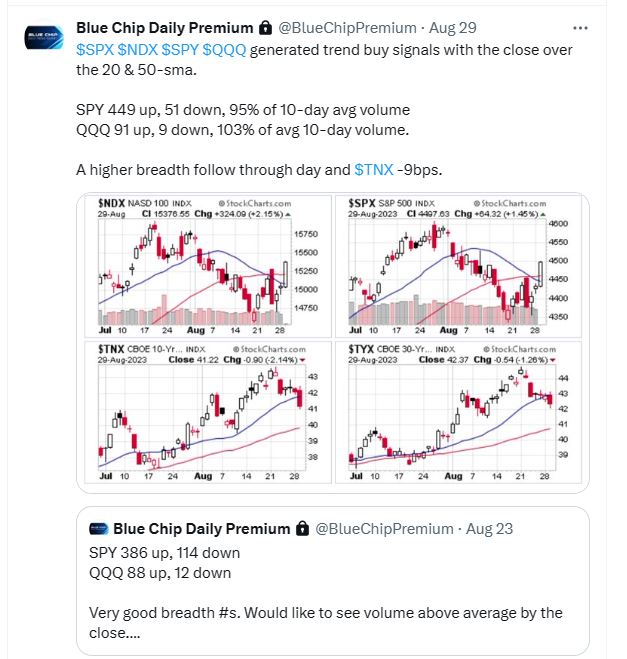
An 85-90% upside day in the indices. <This occurred on 8/23/23>.
A second 85-90% upside follow through day. <This occurred on 8/29/23>.
 80%+ higher upside days within 4 trading days of each other.