TODAY’S VIDEO: https://bit.ly/BCDVideo4523
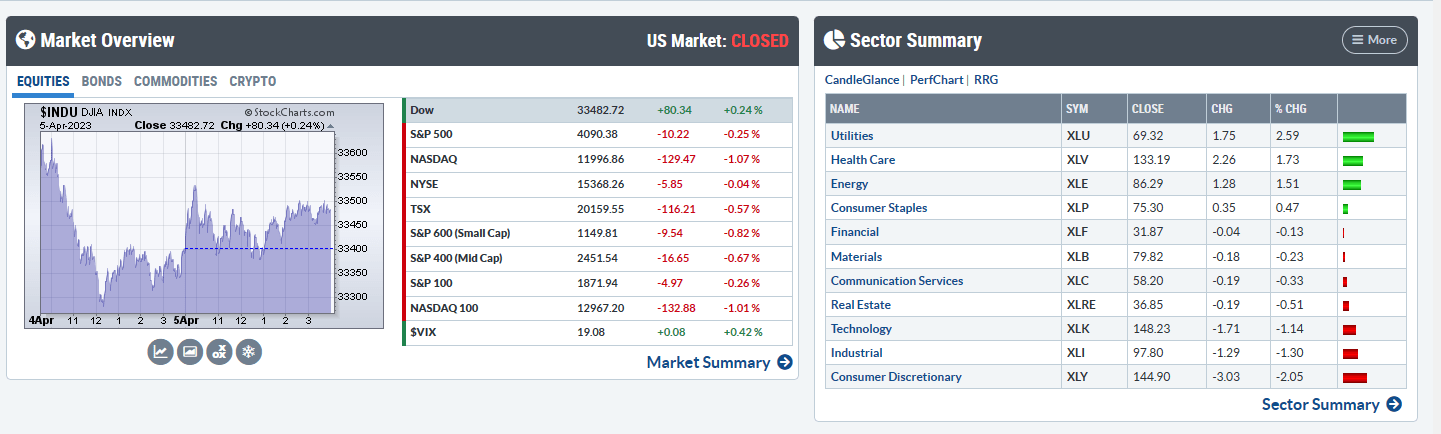
Major Indices and S&P Sector Performance
NEW HIGHS/NEW LOWS:
Large cap new highs: 21
Large cap new lows: 2
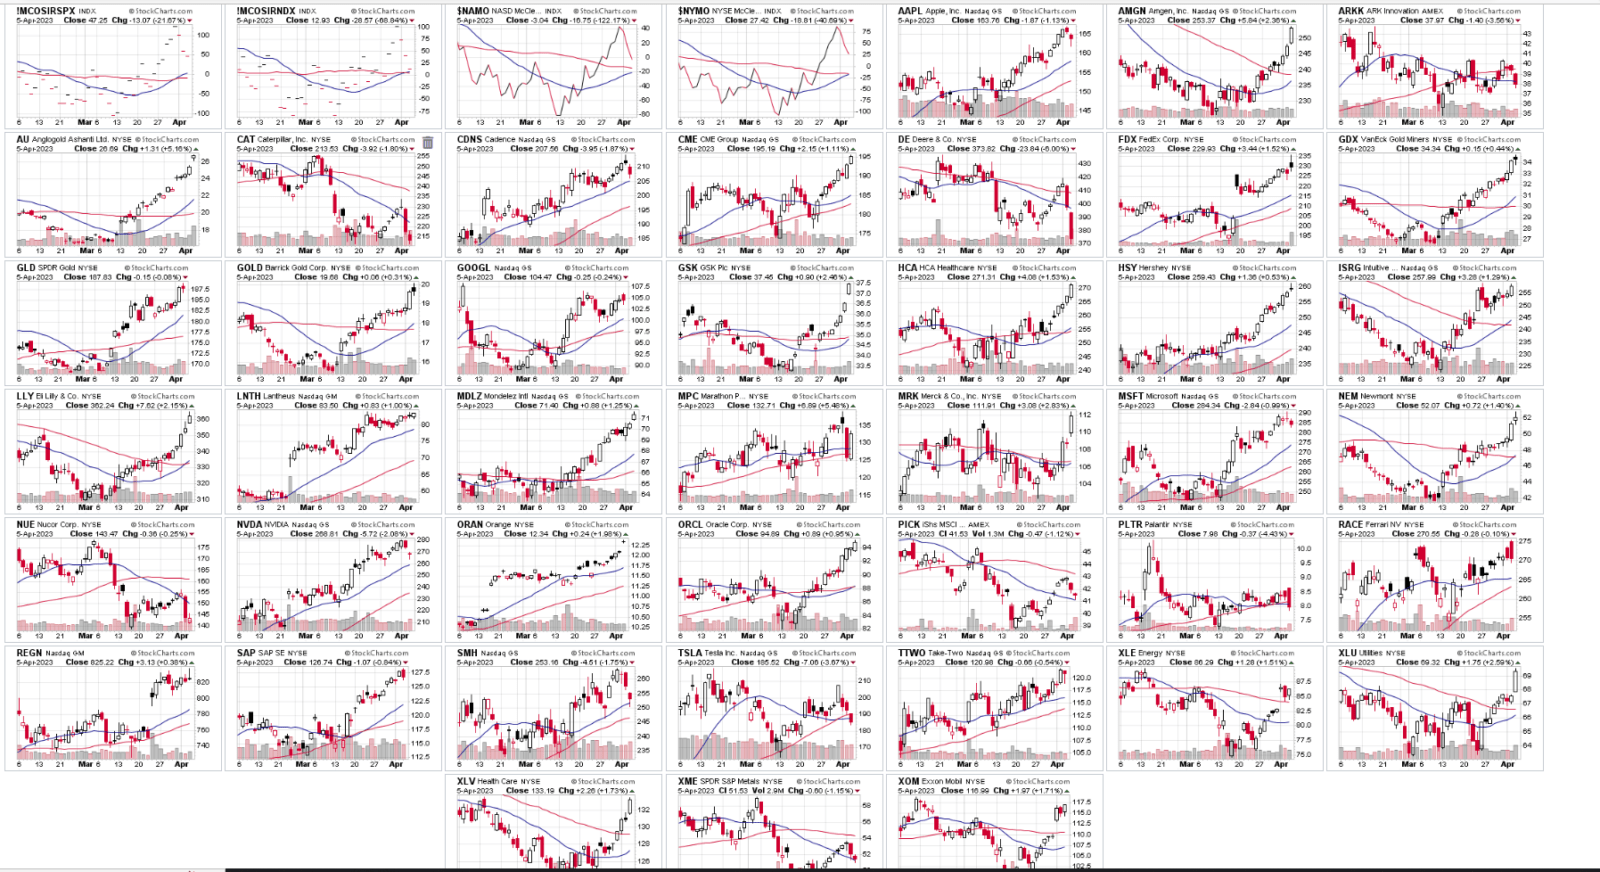
NEW HIGHS:
Open positions: NA
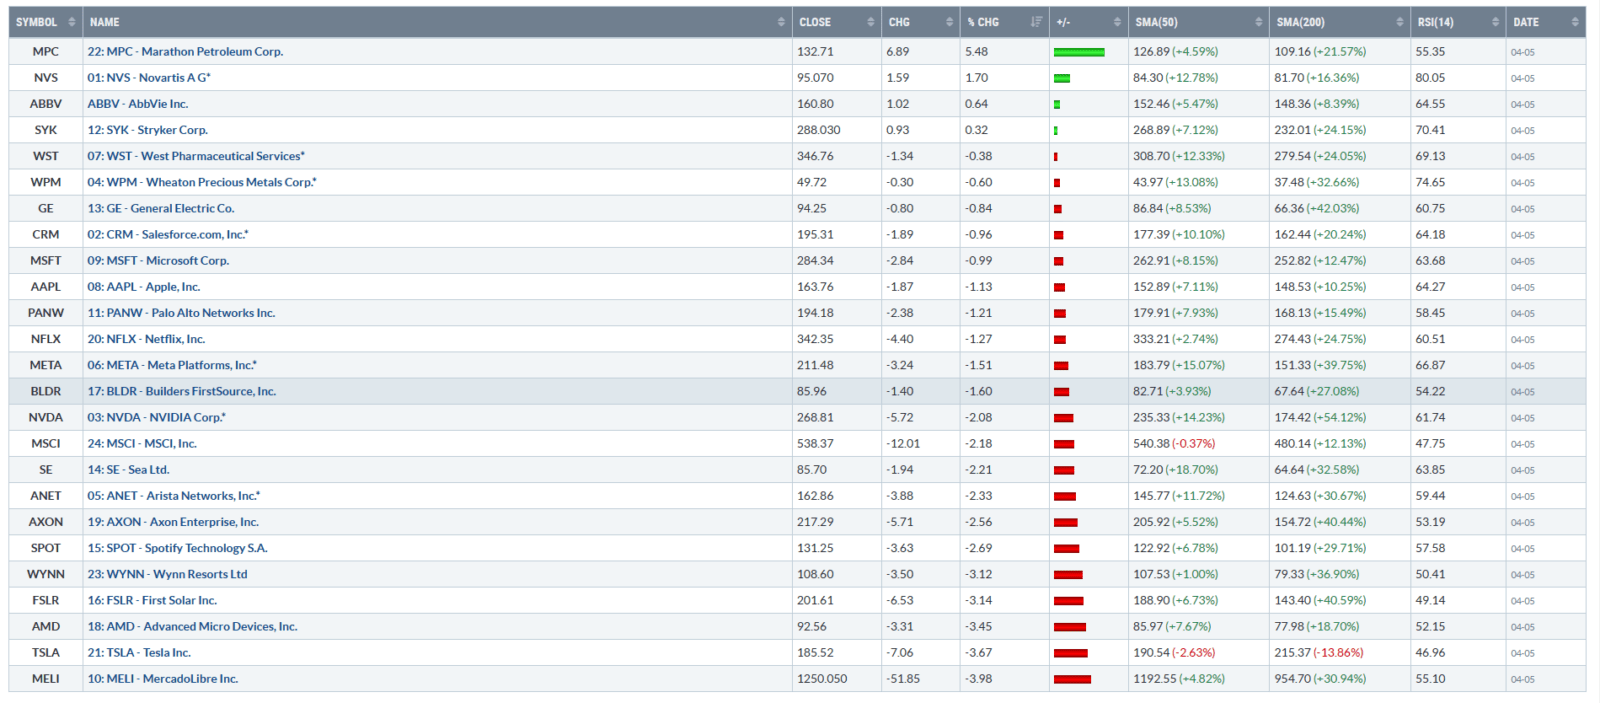
Top 25 list: NVS
Select large-caps (by market cap): ORCL, AZN, SAP, REGN, PGR, RACE, AU
Lower Volatility List: BSX, HSY, MDLZ, ORAN, RELX
High Beta List: NA
TRACKING ETFs:
Top performing tracking ETFs: XLU, XLV, XLE, SPLV, TLT
Bottom performing tracking ETFs: ARKK, TAN, KWEB, XRT, XLY
200-DAY MOVING AVERAGE RECLAIMS
Select large caps (listed by market cap): AMGN, LNG
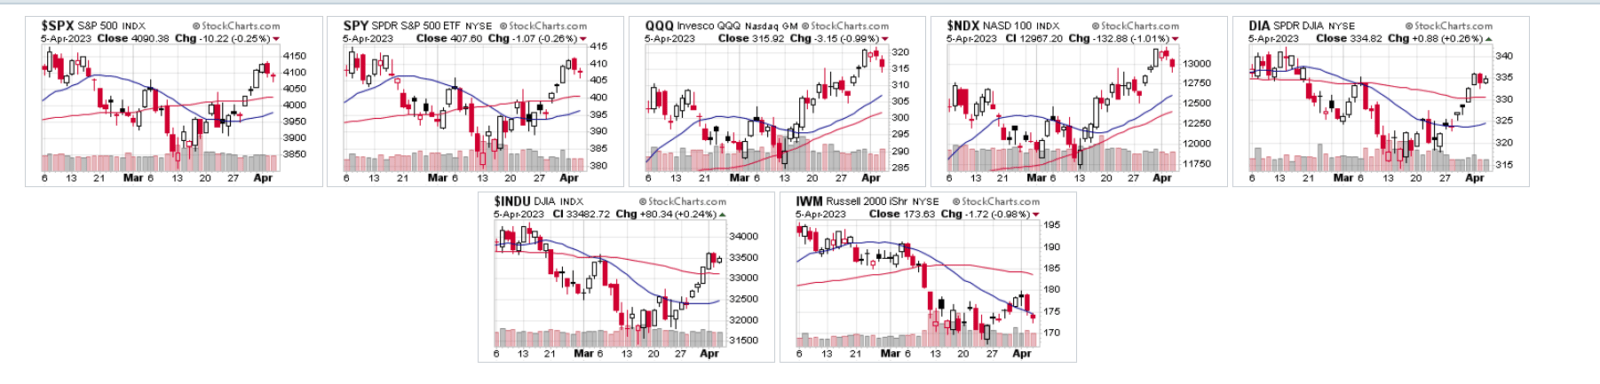
EQUITY INDICES
- S&P 500 index today (per Finviz.com): 224 up/ 277 down
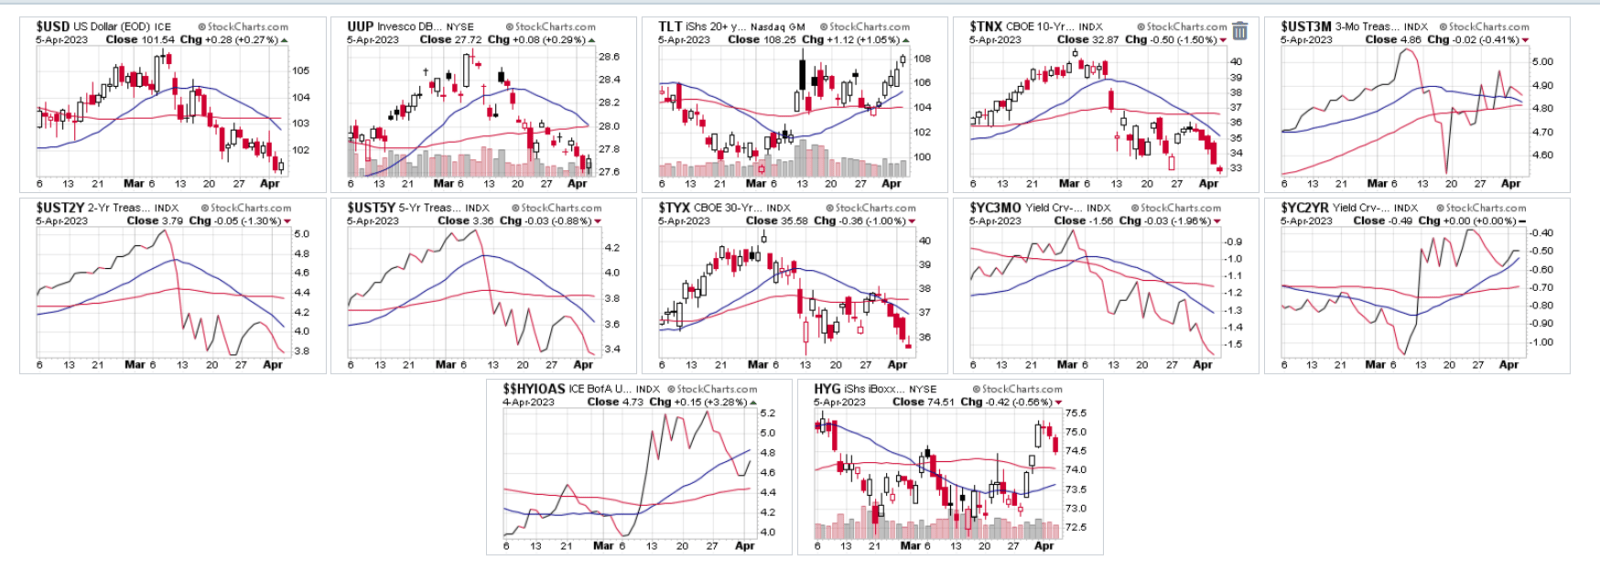
 BOND MARKET
- 10-year UST yields (TNX), -5.0 basis points, 3.287.
- 3.25, 3.40, 3.90 and 4.00 are key technical levels on (TNX).
- 2/10-yield curve closing price, -0.49
- Fed Funds current rate: 475-500.
- Cleveland Federal Reserve March CPI real-time forecast: 5.22.
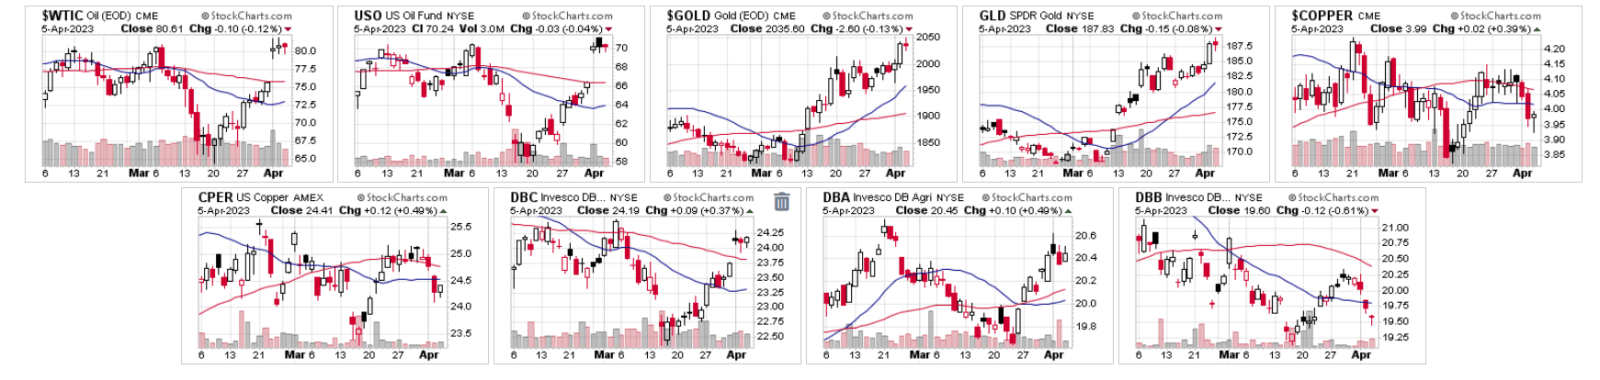
MAJOR COMMODITIES
- WTI Crude oil: 80.61 (-0.12%).
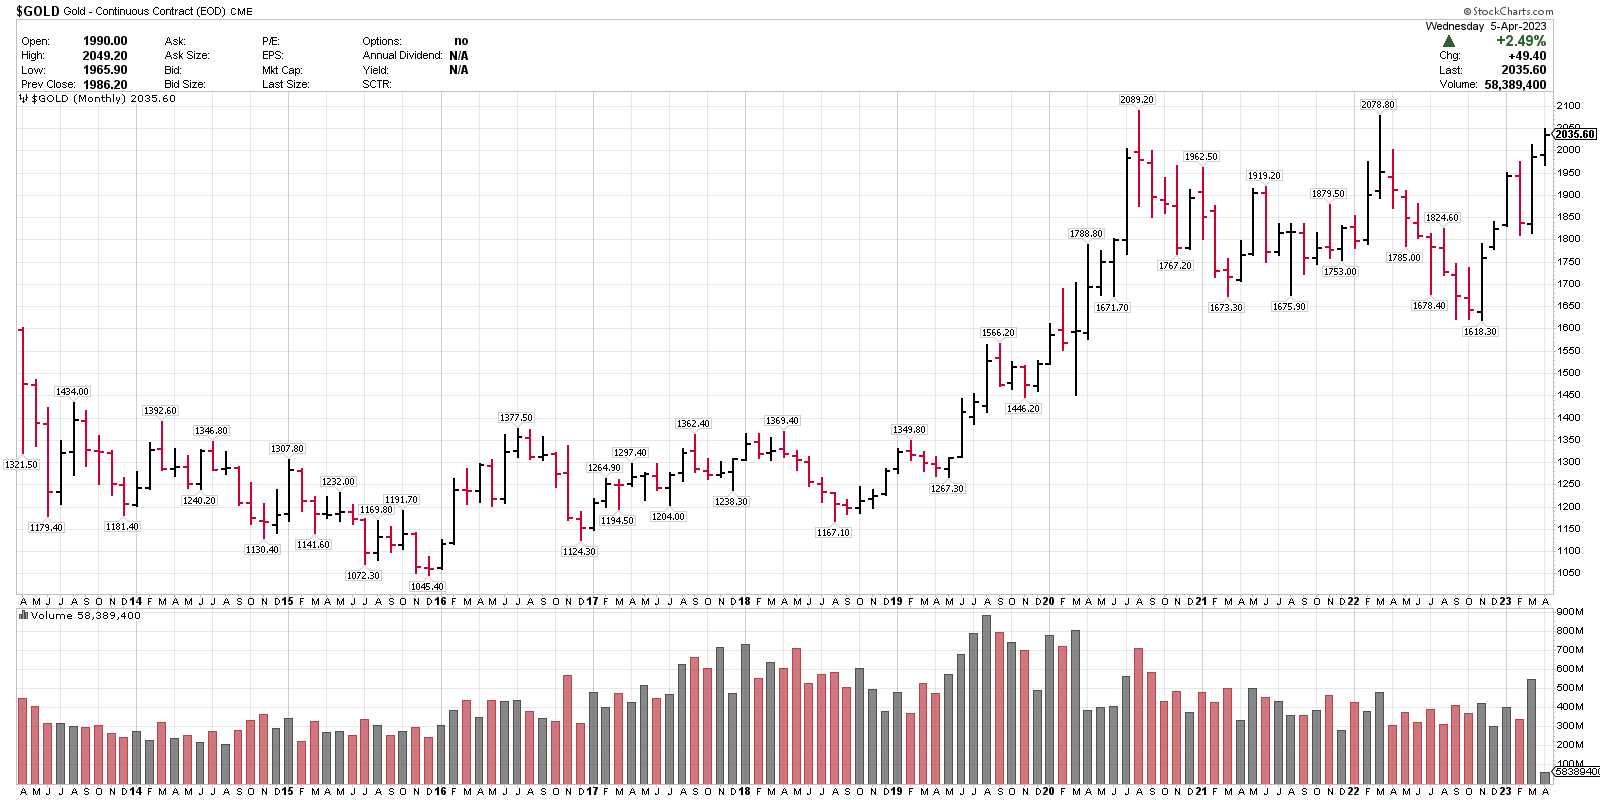
- Spot Gold: 2035.50 (-0.13%)
- Copper: 3.99 (+0.39%)
RECAP:
- The major indices were mixed with DJIA leading, along with defensive sectors utilities and healthcare.
- Weaker than expected economic data came in for the ADP employment report, U.S. Services PMI and ISM services index.
- This led to a pullback in bond yields and high beta stocks, with a move higher in bonds and defensive sectors.
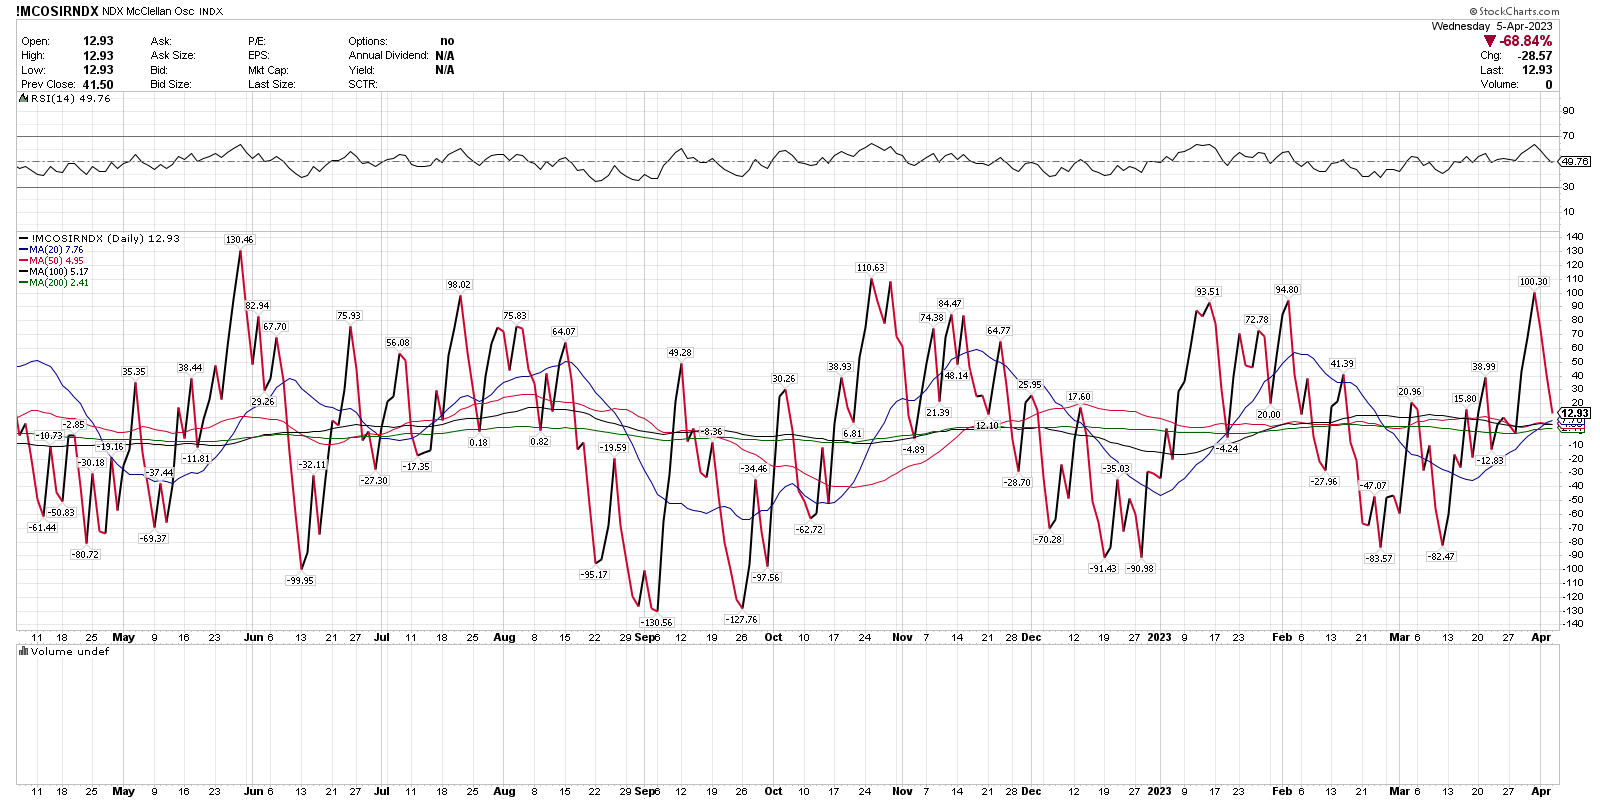
- Both (SPX) and (NDX) have had quiet pullbacks so far this week, to work off the recent overbought oscillators.
- (NDX) oscillator closed at 12.93, almost neutral and well off of the weekend overbought reading of 100.30. This doesn’t rule out more consolidation, but it has taken a lot of excess out of that index currently.
- Cyclicals sectors continue to underperform and we are avoiding those groups currently.
- Healthcare has moved onto the top-ranked lower volatility groups, below, and (XLV) onto the ETF focus list. This sector has had a strong recovery move over the last few weeks and leaders like Eli Lilly (LLY) are over a 70 daily RSI, so I have the group on watch for now, but it is improving.
- Spot Gold closed over 2000 this week, which is a level that it has failed at twice. The long-term trend is improving and Gold is still on the focus list, here or on any pullbacks. Like most markets, it can be choppy and news-driven in the near-term.
- Many consumer staples stocks are over 70 daily RSI with Hershey (HSY) at an 80-daily RSI, in overbought territory near-term.
- Gold miners ETF (GDX) at 74.64 daily RSI could be getting extended near-term. Price trends can continue through overbought or oversold readings, just something to be aware of.
— - Top 5 tracking ETFs, by daily RSI: Silver (SLV), Gold miners (GLD), Consumer staples (XLP), Healthcare (XLV), Gold (GLD)
- Top ranked lower-volatility groups: Gold, US Treasury bonds, and Europe. Healthcare sector added today.
- Top ranked higher-volatility groups: Technology, communications services and Gold miners.
- For the S&P 500 Index (SPX), 3900 (key trend support).
POSITION ADJUSTMENTS
- No position activity today.
Best Regards,
Larry Tentarelli
President, Blue Chip Daily Trend Report
OPEN POSITIONS:
~83% cash.
Due to our time-frame, the minimum baseline target is 5 open positions and 80% cash maximum.
Target allocation over the next 4-6 weeks is in the 50-60% range, based on market conditions.
WEEKLY TOP 25 LIST:
Note: The number preceding the symbol indicates its RSI ranking in the group as of Sunday’s Weekly Video.
AbbVie(ABBV) replaced MarketAxxess Holding (MKTX) on the list today.
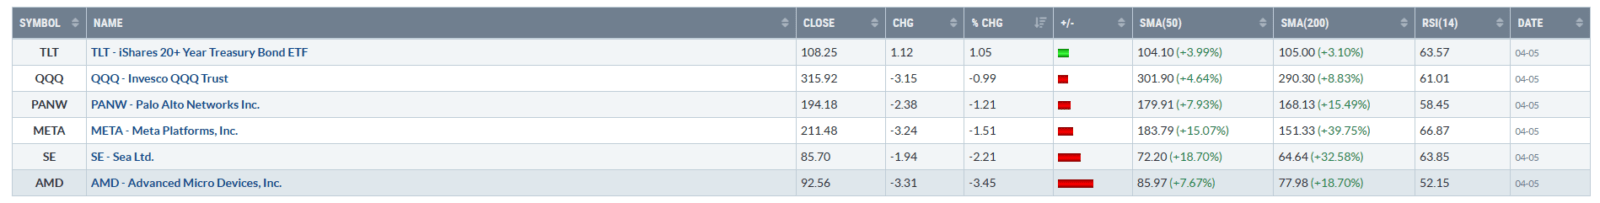
FEATURED CHARTS IN TONIGHT’S VIDEO: