Chart Study: Breakouts
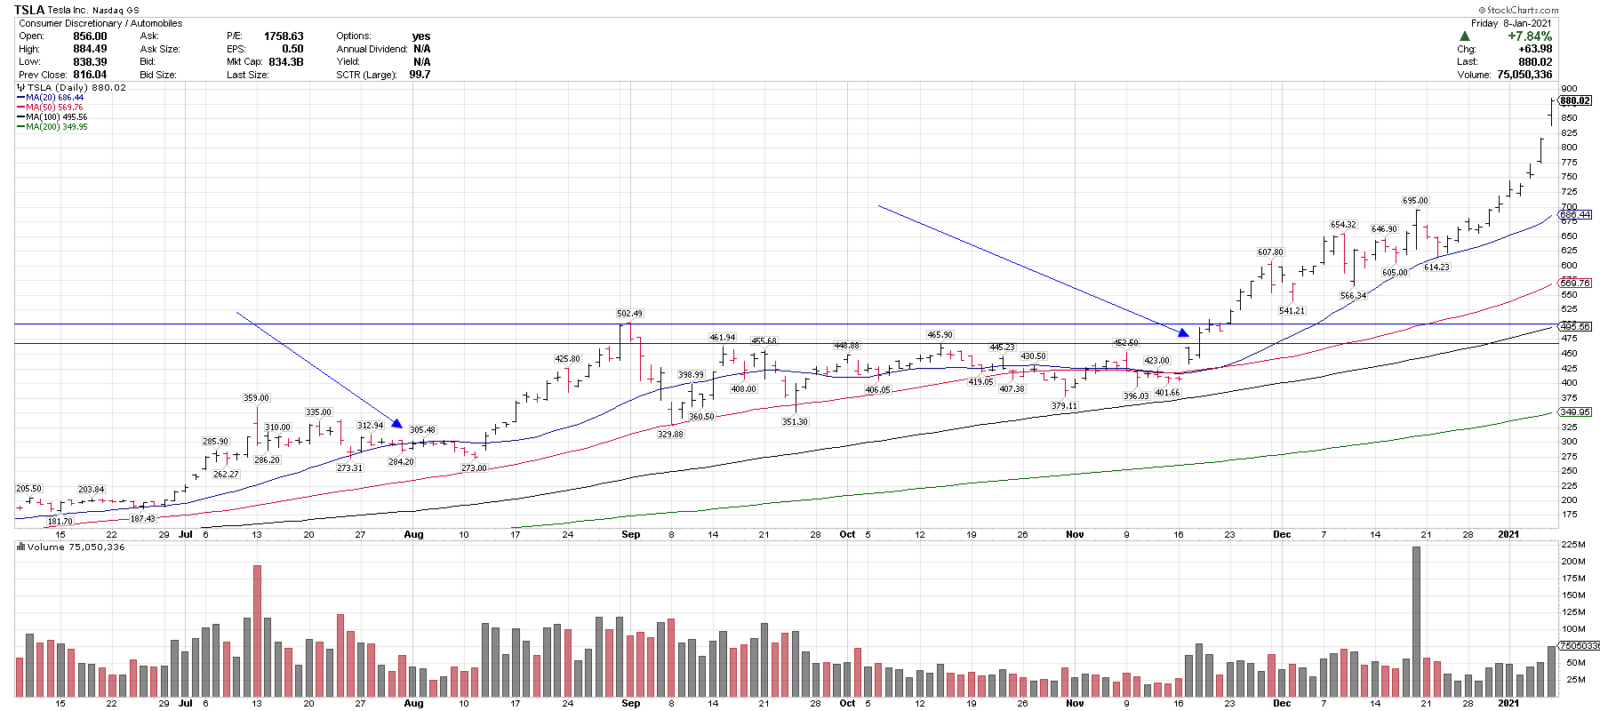
TSLA failed to close > $460 5 times in 60 days. The morning that it broke out, I indicated $460 as the key breakout level for higher. Once it cleared $500, that became a key support level to manage risk against More chart study:
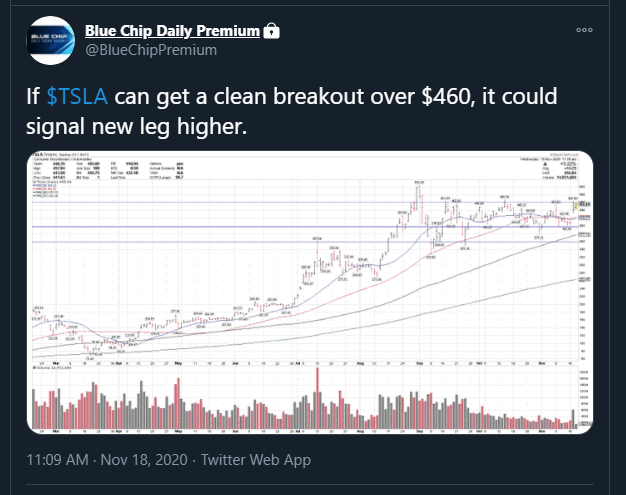
11/18/20
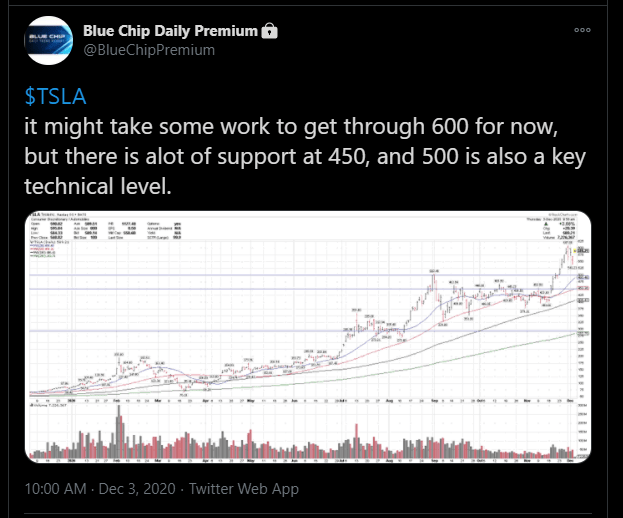
12/03/20
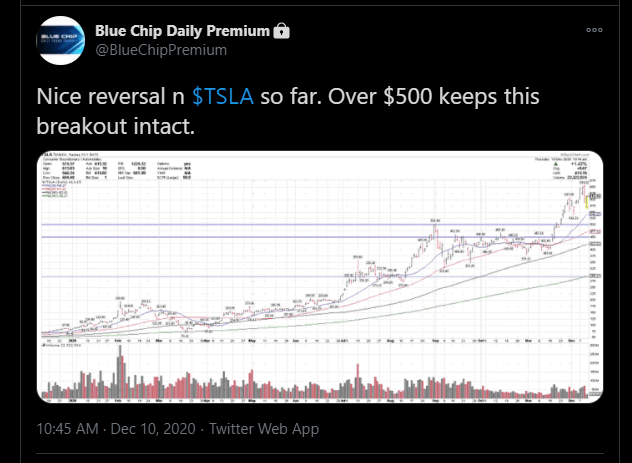
12/10/20
DISCLOSURE: I am long TSLA from 7/31/20 – split adjusted price of $295.99.
SEE MORE CHART STUDY HERE: https://bluechipdaily.com/chart-study/
TSLA CHART