NVIDIA Corp. (NVDA) is today’s Blue Chip Daily Chart of the Week.
(NVDA) is an industry leader in semiconductors and also the major market cap leader in the shift to AI.
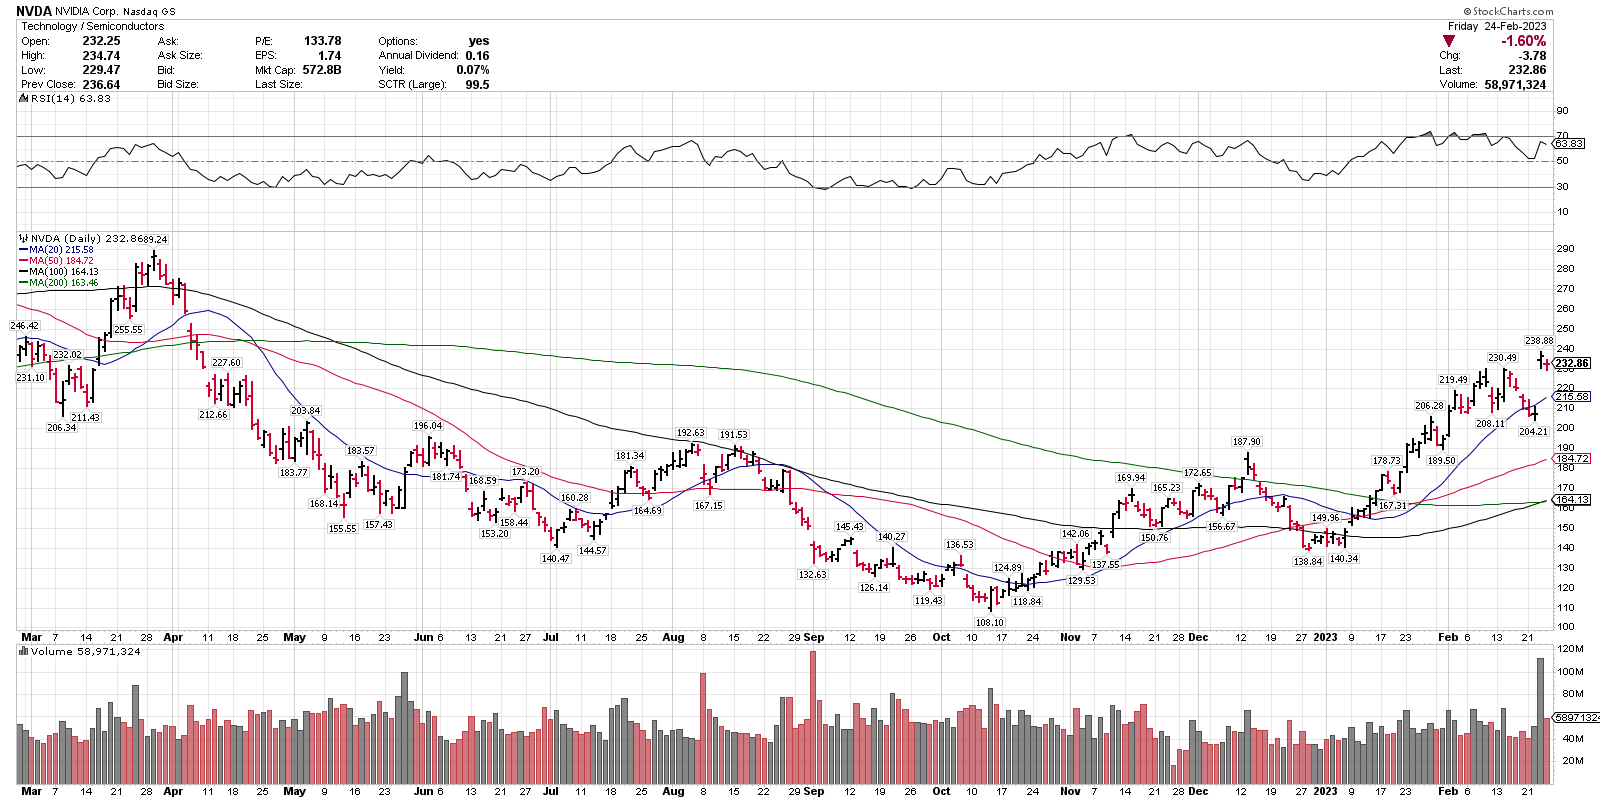
- Weekly closing price: 232.86
- Support levels: 210, 200 and 190
- 50-dma: 184.72
- Suggest stop-loss levels are based on time frame.
- 209.40 is a roughly 10% stop.
- 198.40 is below the $200 support level.
- The 50-sma trend following stop, for longer time frames, would be below 184.72 currently, but trail up.
- **The S&P 500 Index (SPX) is currently in a pullback phase. Most stocks could follow the index, in either direction.
- If the index starts to stabilize or turn up, we expect (NVDA) to lead.
- **Some of our Members research ideas at the market, others often develop a watch-list.
(NVDA) has been on our Sunday Best Ideas List for members for the last 7 weeks, dating back to 1/15/23, first posted at $168.99.