Below is a public view archive of our Daily Chart of the Day Buy List, posted on our premium Twitter page and sent to Members every morning by 9:00am.
We only post ONE Chart of the Day idea on every market day.
Every idea is recorded and tracked on our website tracking sheet 24/7, for our Members to view at any time.
100% TRANSPARENCY & ACCOUNTABILITY
******We encourage you to compare our Chart of the Day Buy List prices to today’s current prices, to gain a perspective of the Blue Chip Daily value added.******
To preserve the value for our Members, this page will have at least a 30 day lag period before the ideas are posted for Public View.
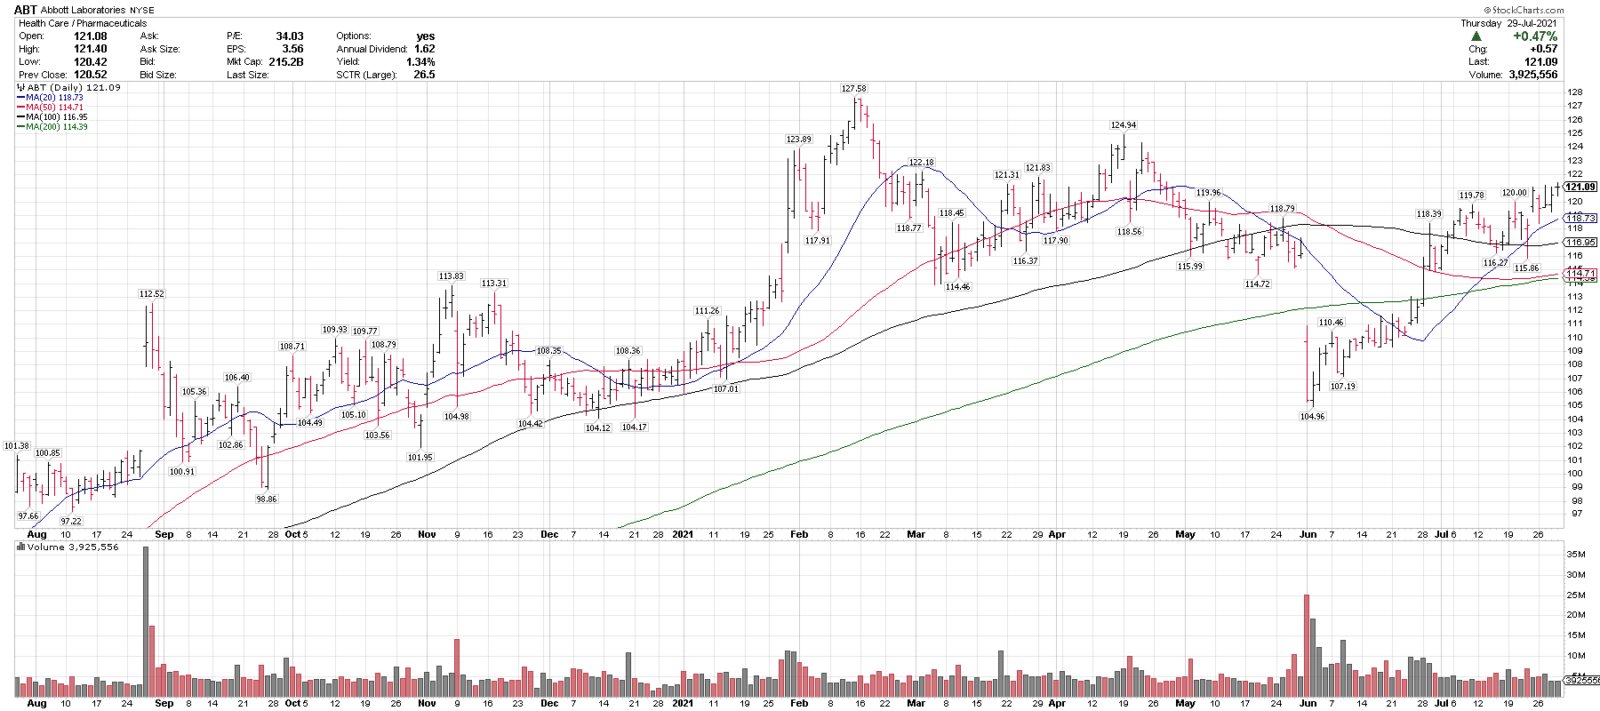
7/30/21
Abbott Labs, ABT
Close: 121.09
Pre: 121.27
Stop: 102.92
ABT is trading above 4 rising MAs and closed at a 90-day high yesterday, starting to break out. There is a wide support base in the 116-120 range.
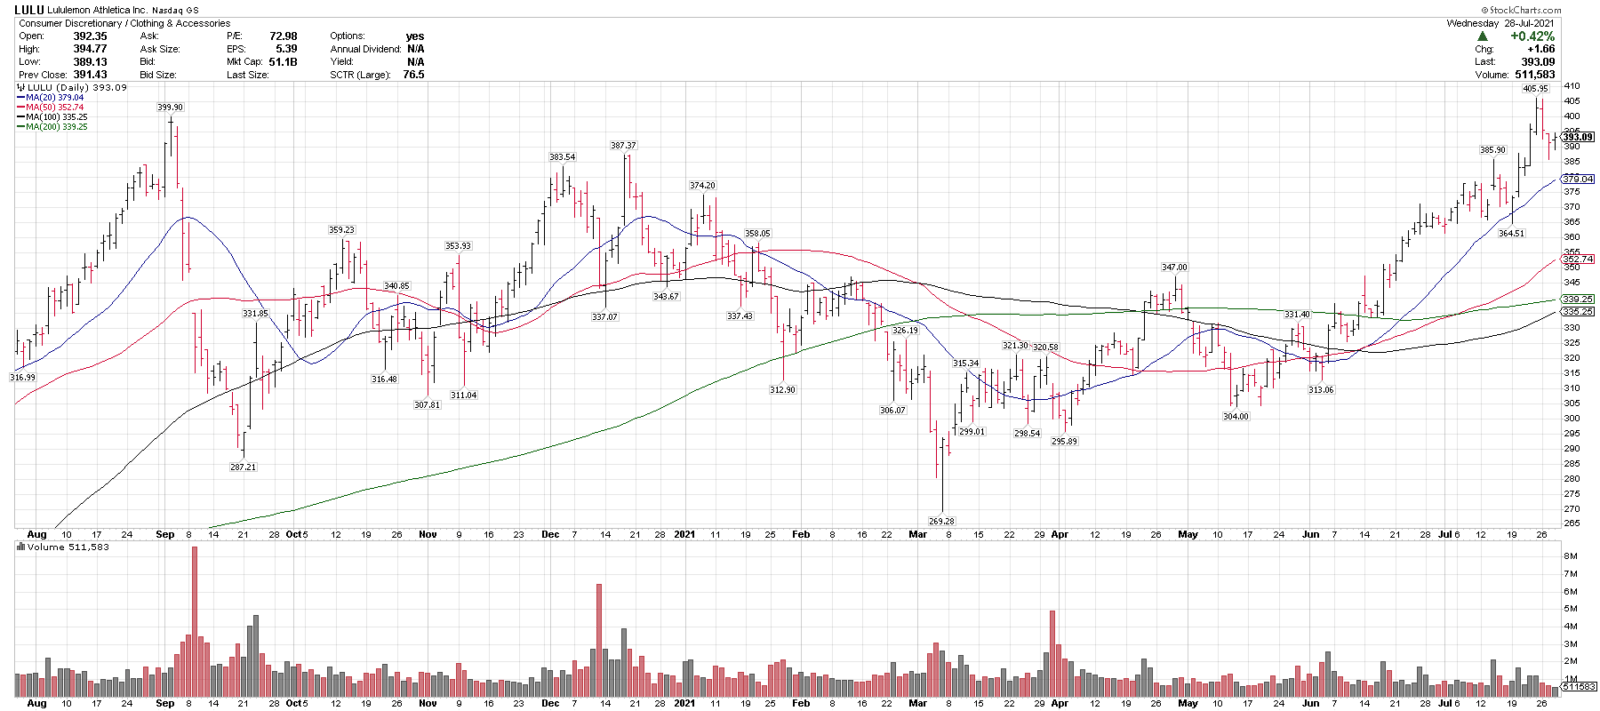
7/29/21
Lululemon, LULU
Close: 393.09
Pre: 394.01
Stop: 334.12
LULU is in an uptrend above 4 rising MAs, and recently pulled back 4.9% off of new highs. 380 & 365 are support levels and over 410 could signal a breakout higher. On this week’s Top 25 list.
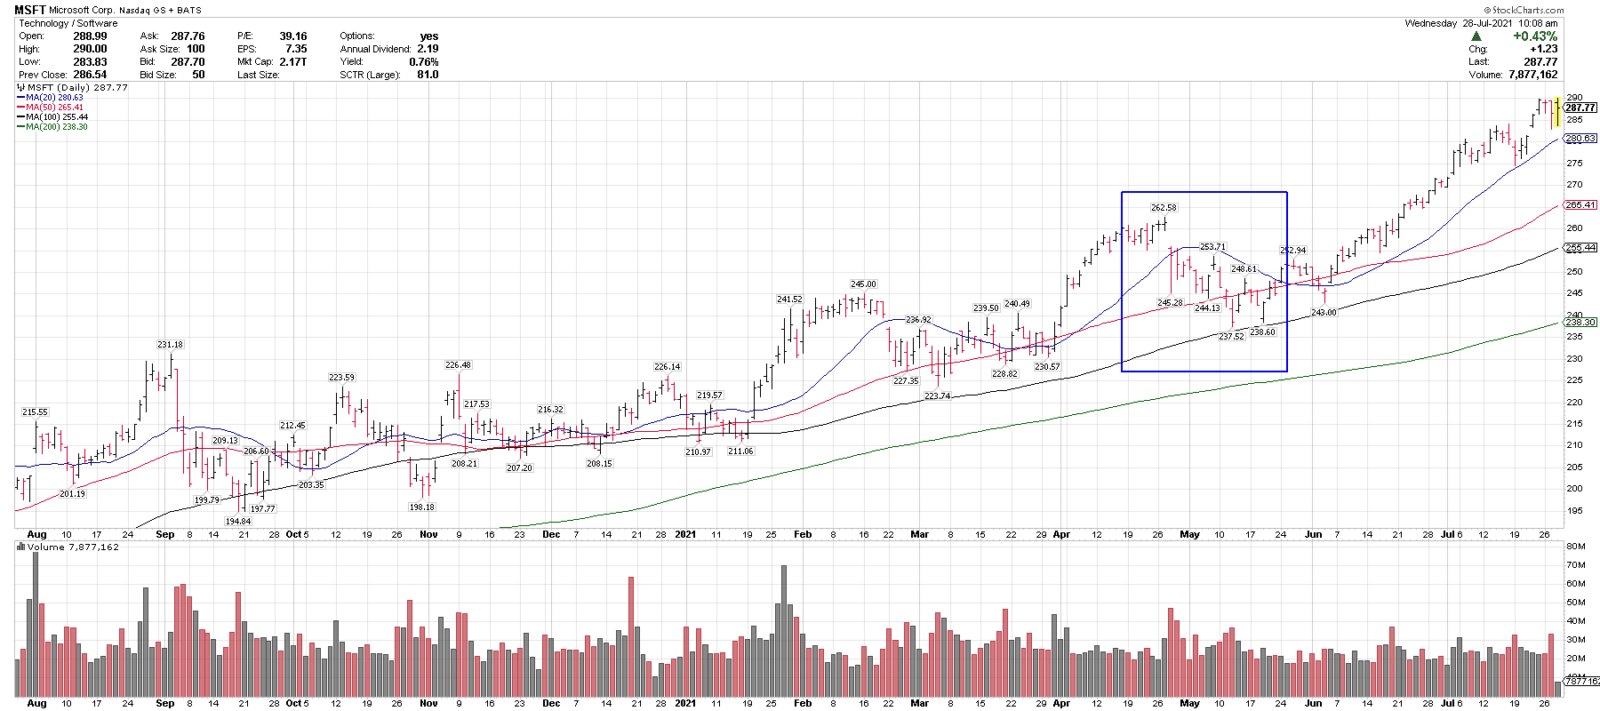
7/28/21
Microsoft, MSFT
Close: 286.54
Pre: 290.64 (+1.43%)
Stop: 243.55
MSFT is in an uptrend over 4 rising MAs & testing new highs after earnings. The day after earnings can be volatile, but any pullbacks over the rising 50-sma keep the uptrend intact. 275 is near term support. I don’t often put charts on the list the day after earnings, due to normal volatility, so some follow through into the day would help.
7/27/21
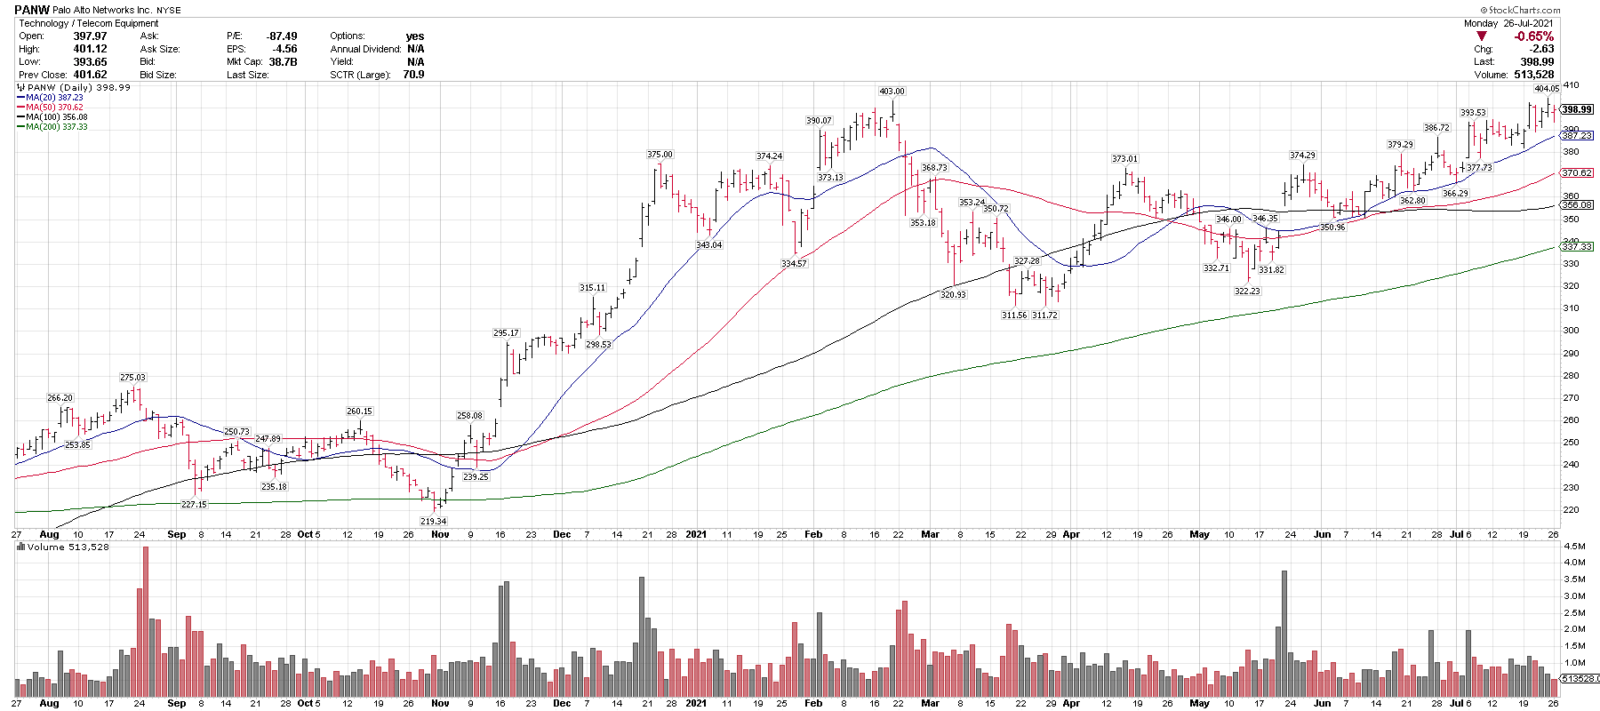
Palo Alto Networks, PANW
Close/Pre: 398.99
Stop: 336.80 (under the 200-sma)
PANW is in an uptrend above 4 rising MAs and recently made new highs. 360-380 is a key support range on any pullbacks. 405-410 is a potential breakout level. On the last two top 25 lists.
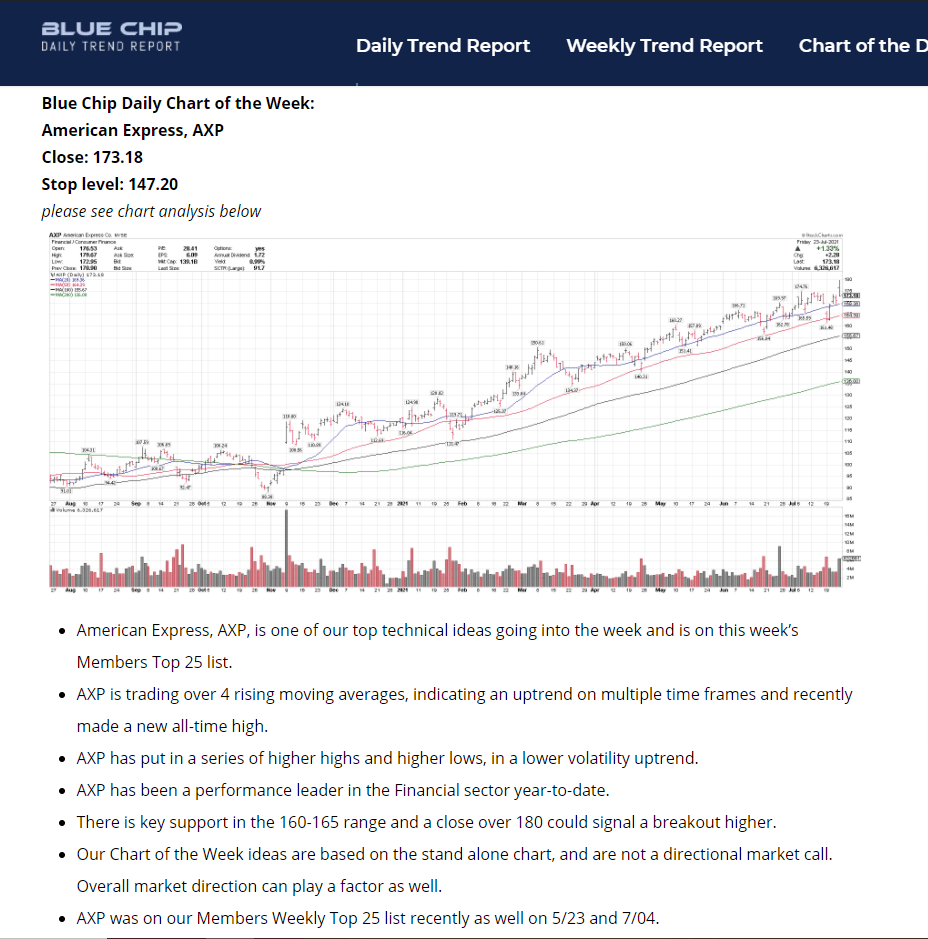
7/26/21
American Express, AXP
(Also this week’s Chart of the Week)
Close: 173.18
Pre: 172.80
Stop: 147.20
7/23/21
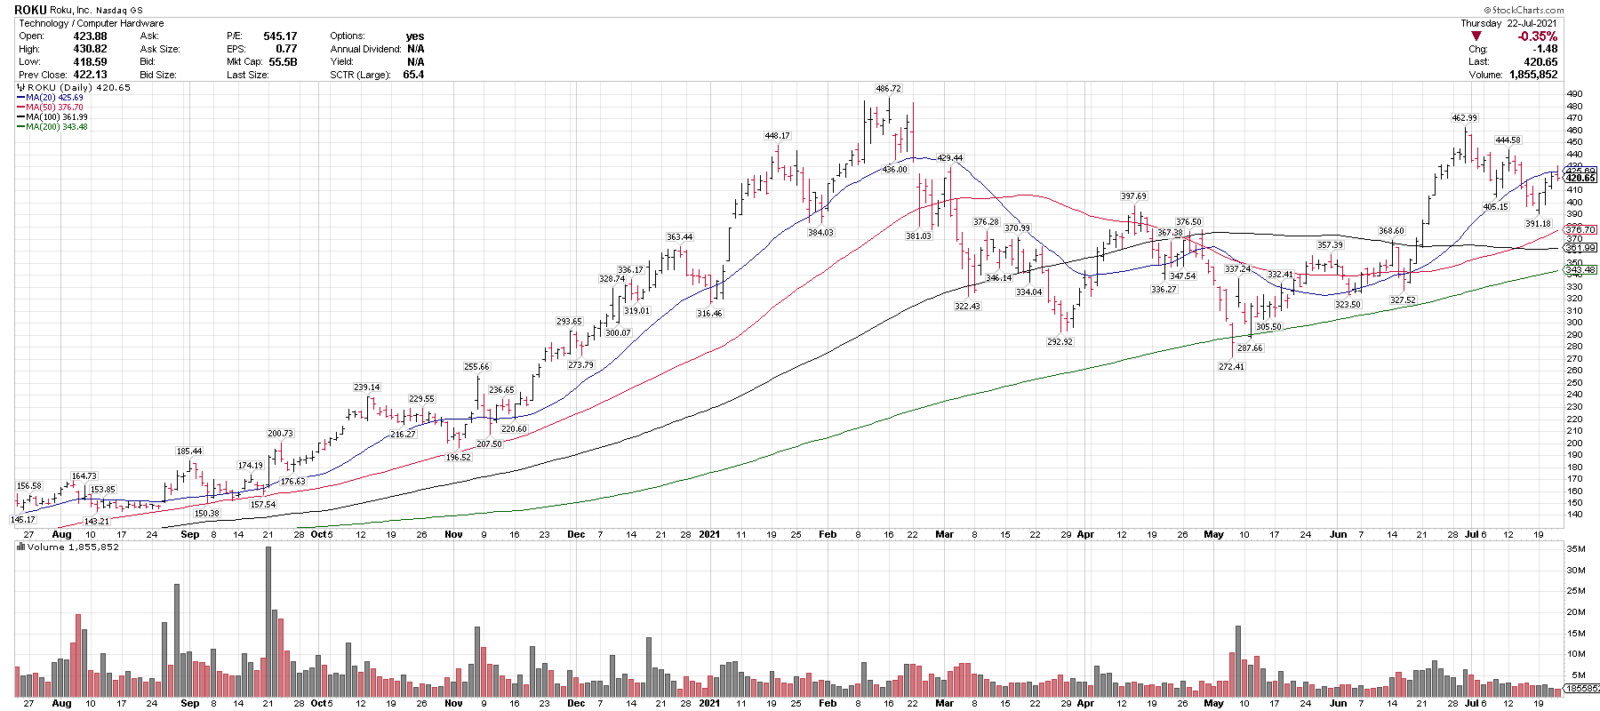
Roku, ROKU
Close: 420.65
Pre: 425.09 (+1.06%)
Stop: 342.40 (below 200-sma)
ROKU is in an uptrend above 3 rising MAs, recently pulled back 15.5% off of 4 month highs and held over the rising 50-sma. 390-400 is support. Also posted on Sunday’s High Beta list. This is a wider stop due to market and earnings volatility.
7/22/21
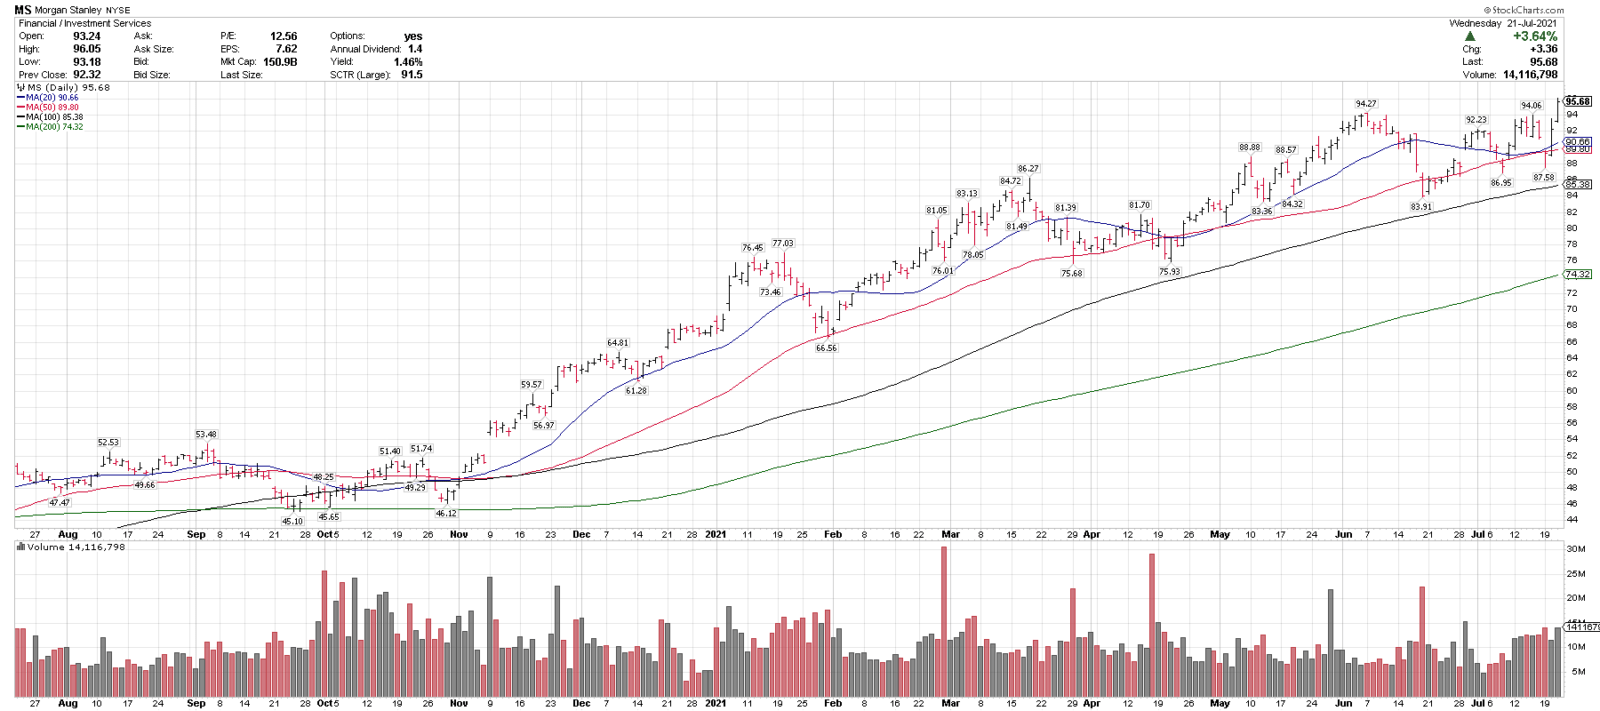
Morgan Stanley, MS
Close: 95.68
Pre: 94.81
Stop: 81.32
MS is in an uptrend above 4 rising MAs and made a new closing high yesterday. MS is our top ranked bank/broker chart here and is on this week’s Top 25 list. 86-90 is a key support level on any pullbacks. After yesterday’s new high, there could be some back and fill, but the overall trend is up here.
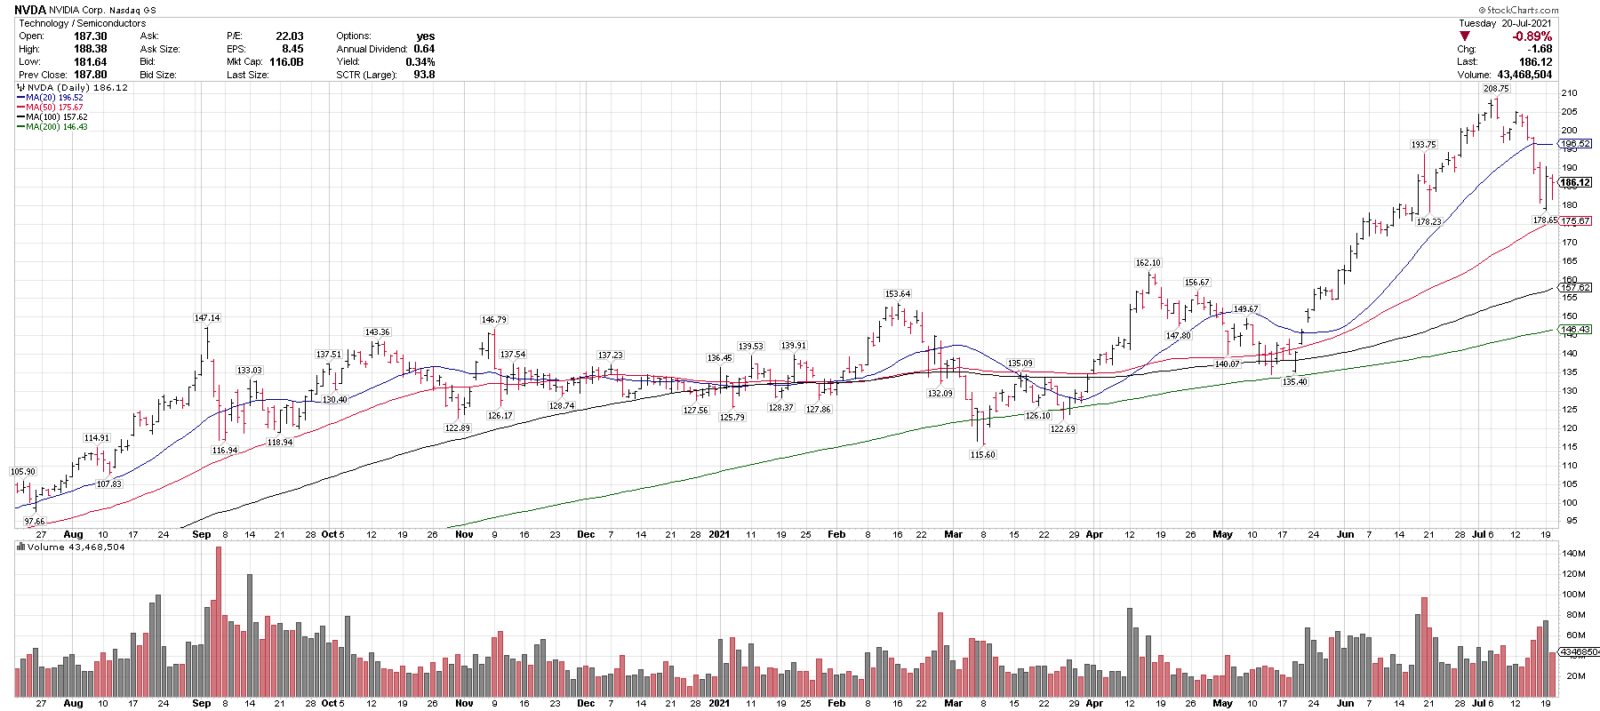
7/21/21
Nvidia, NVDA
Close: 186.12
Pre: 187.15
Stop: 157.40 (below 100-sma)
NVDA is in an uptrend above 3 rising MAs, and recently pulled back 14.4% off of all-time highs. 160 & 175 are support levels.
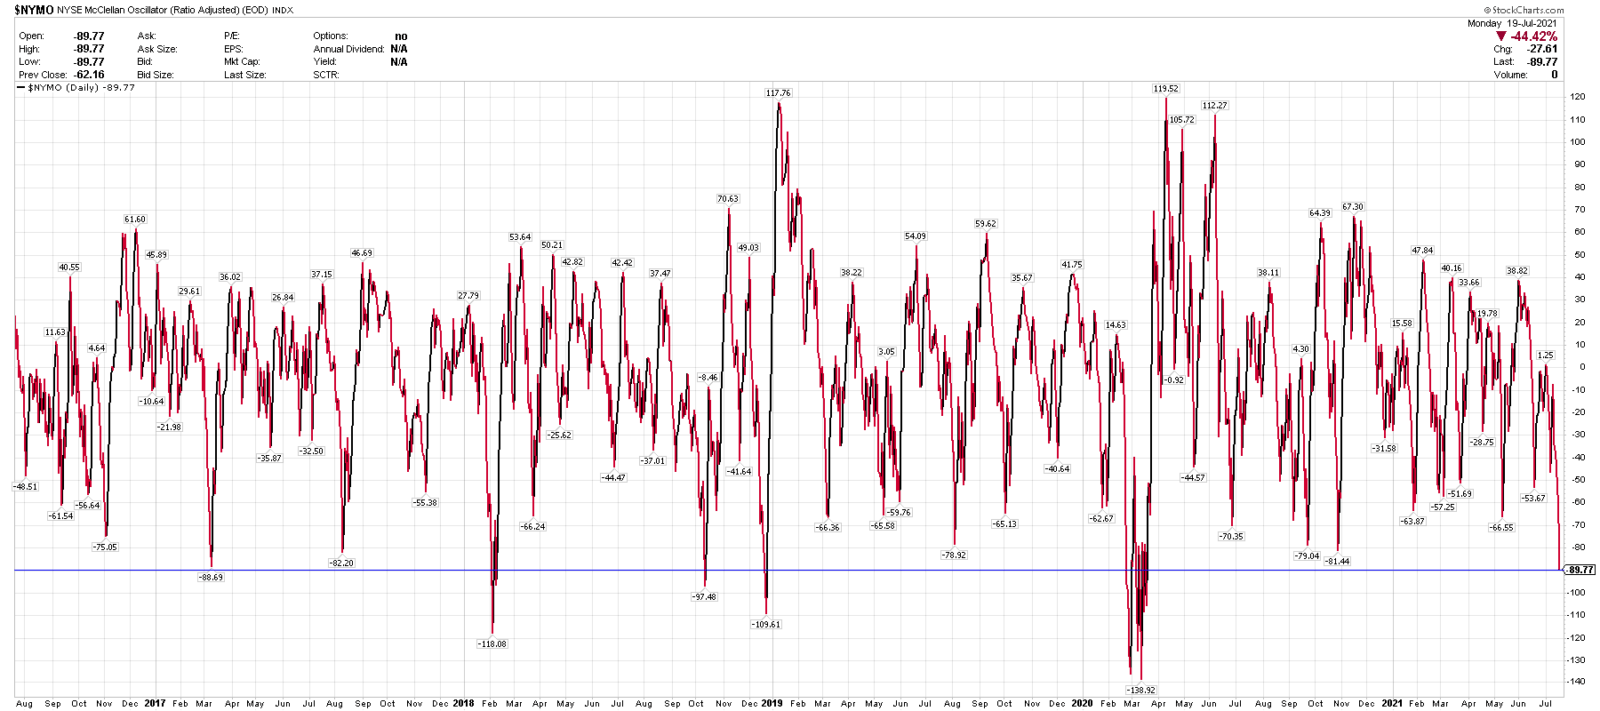
7/20/21
NYSE McClellan Oscillator, NYMO
Closed at 89.77, the lowest level since March 2020 and 5th lowest level in 5 years. Equity markets *often* reverse higher from this level or not far from it. Tech, healthcare and communication services are top ranked pullback sectors here.
7/19/21
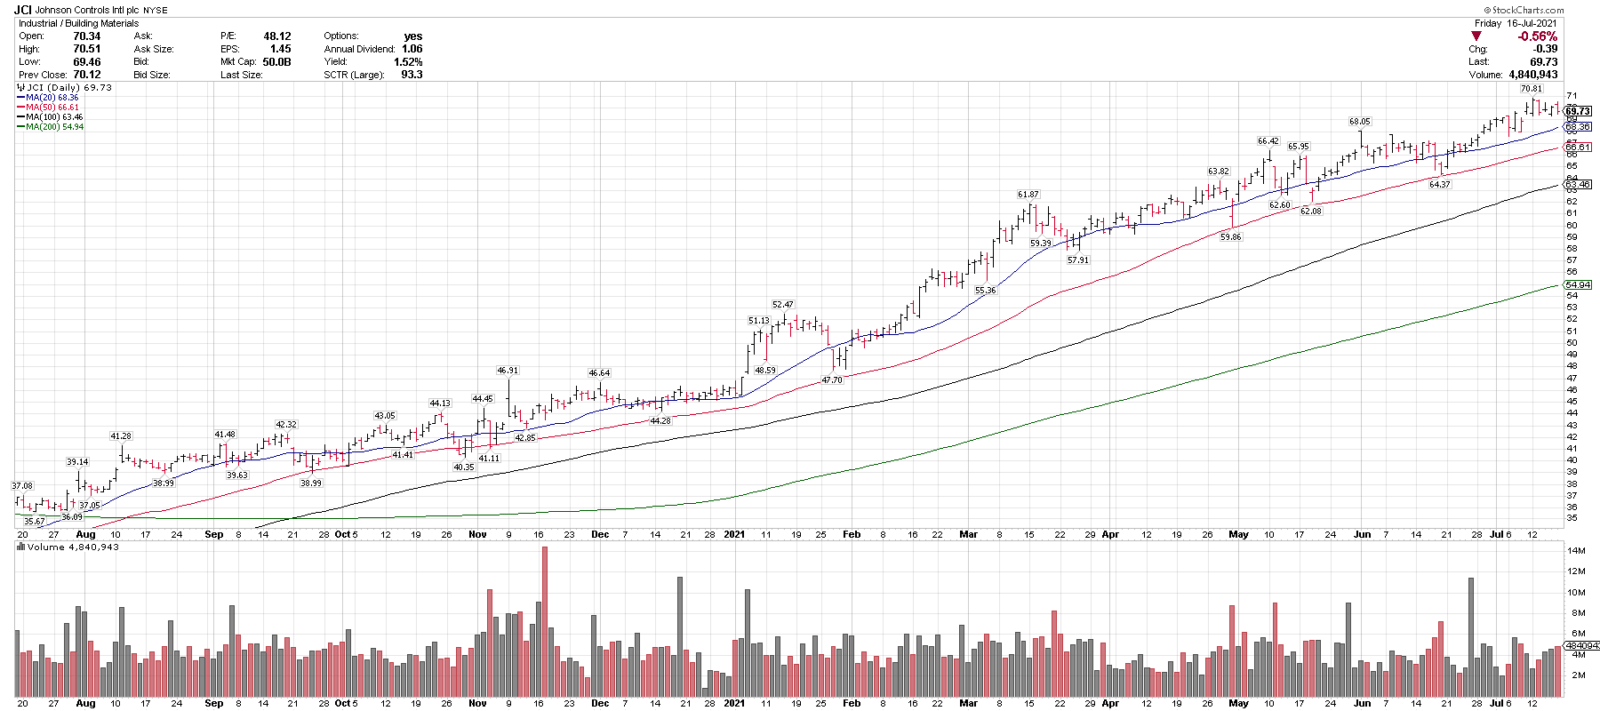
Johnson Controls, JCI
Close/Pre: 69.73
Stop: 59.27
JCI Is trading in a lower volatility uptrend above 4 rising MAs currently, and is consolidating off of recent new highs. 62-66 is a support range and over 71 could signal a breakout higher.
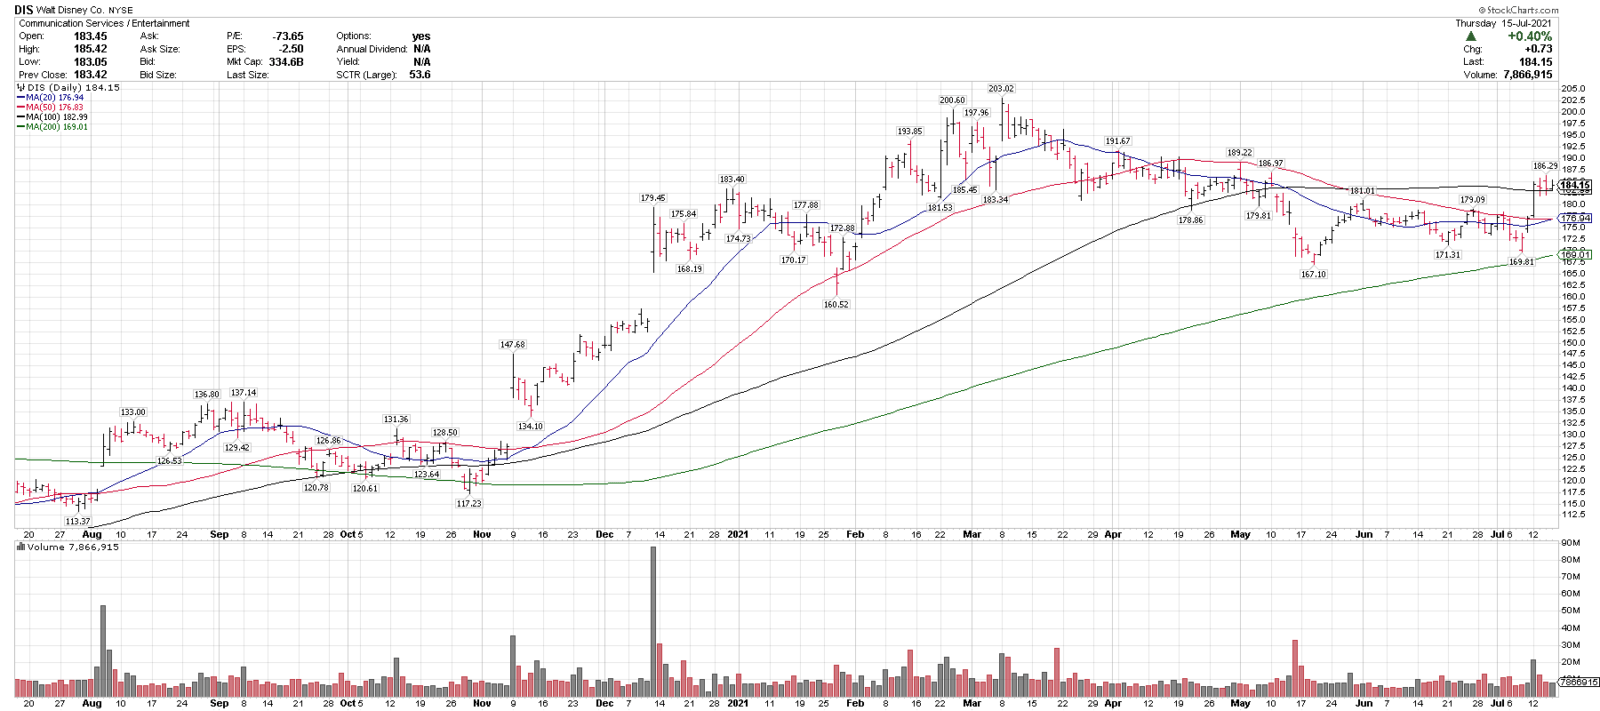
7/16/21
Walt Disney Co., DIS
Close: 184.15
Pre: 184.62
Stop: 161.95
DIS is trading over 4 MAs, w/rising 20 & 200-sma, flattening 50-sma & completed a bullish 20/50-sma cross yesterday. Pending the first major close over 10-week MA since March. Possible longer term trend reversal, so there could have some back and fill consolidation.
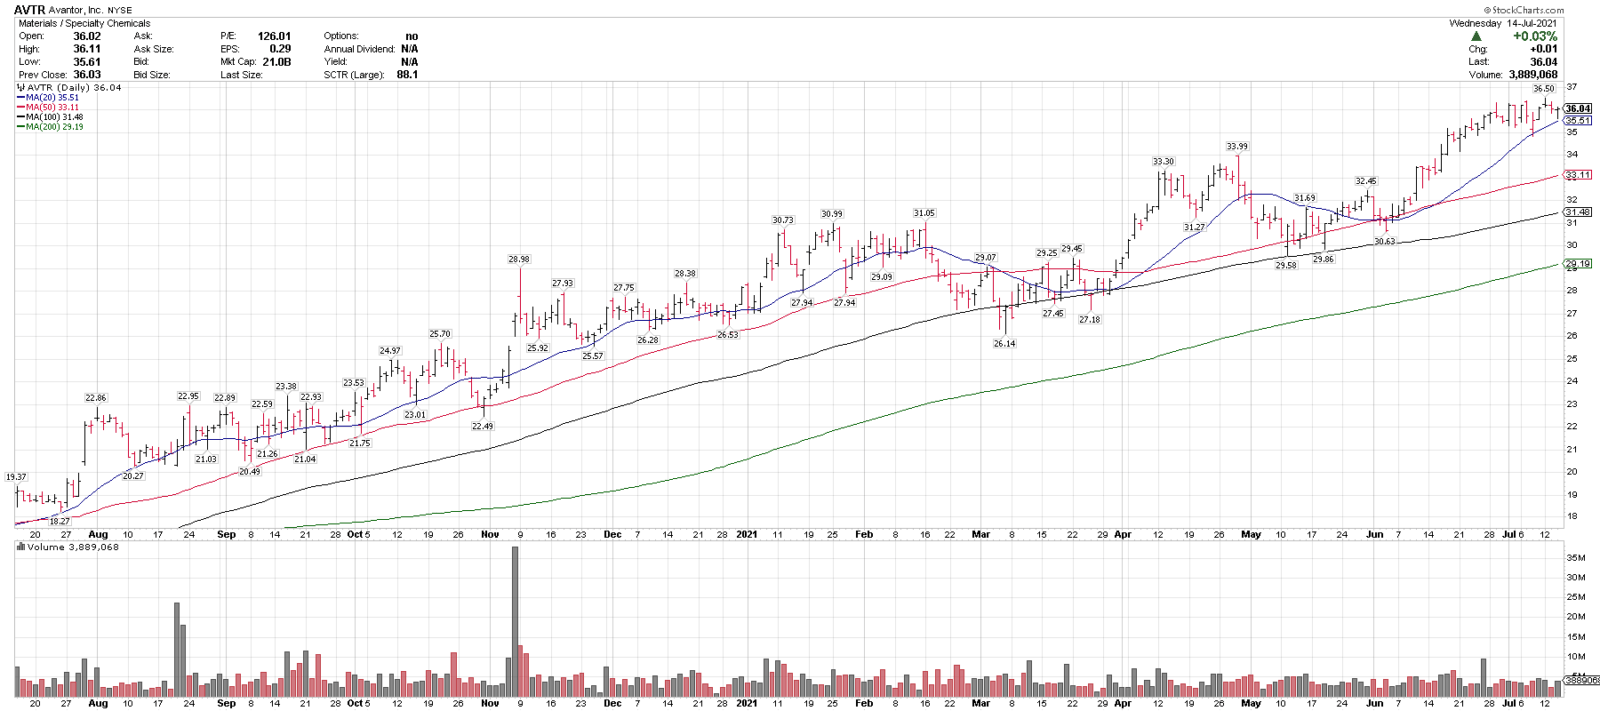
7/15/21
Avantor, AVTR
Close/pre: 36.04
Stop: 30.63
AVTR is trading in an uptrend above 4 rising MAs and is consolidating just under new highs. 33 is first support and over 37 could signal a breakout.
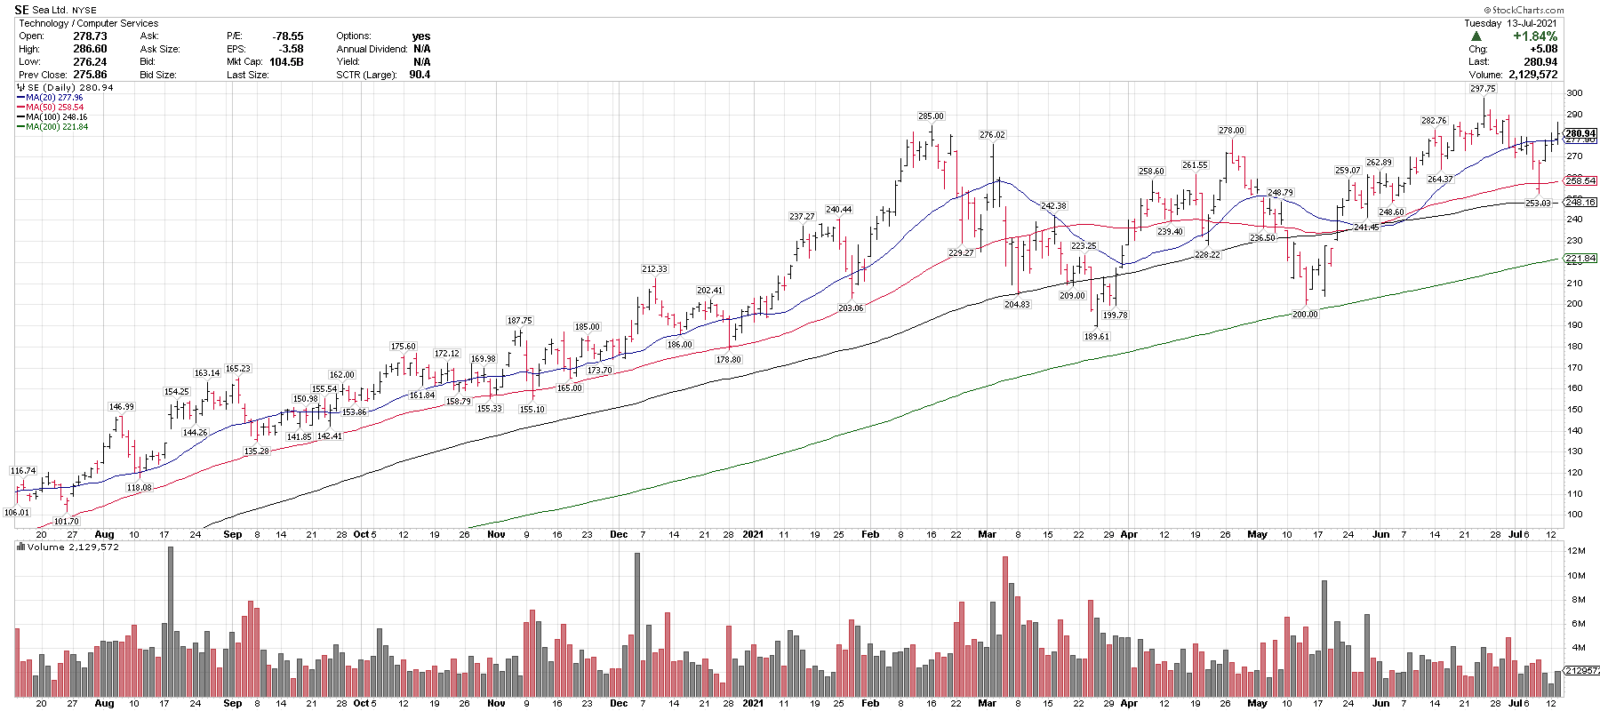
7/14/21
Sea Limited, SE
Close: 280.94
Pre: 284.32 (+1.20%)
Stop: 231.77
SE is in a longer-term uptrend above 4 MAs & rising 50 & 200-sma. It recently pulled back 15.0% off of new highs. 250-260 is near term support and over 300 could signal a breakout higher.
7/13/21
AstraZeneca, AZN
Close: 60.50
Pre: 60.03
Stop: 53.24
AZN is in an uptrend above 4 rising MAs and is testing 11 month highs. 55-57.50 is a near term support range.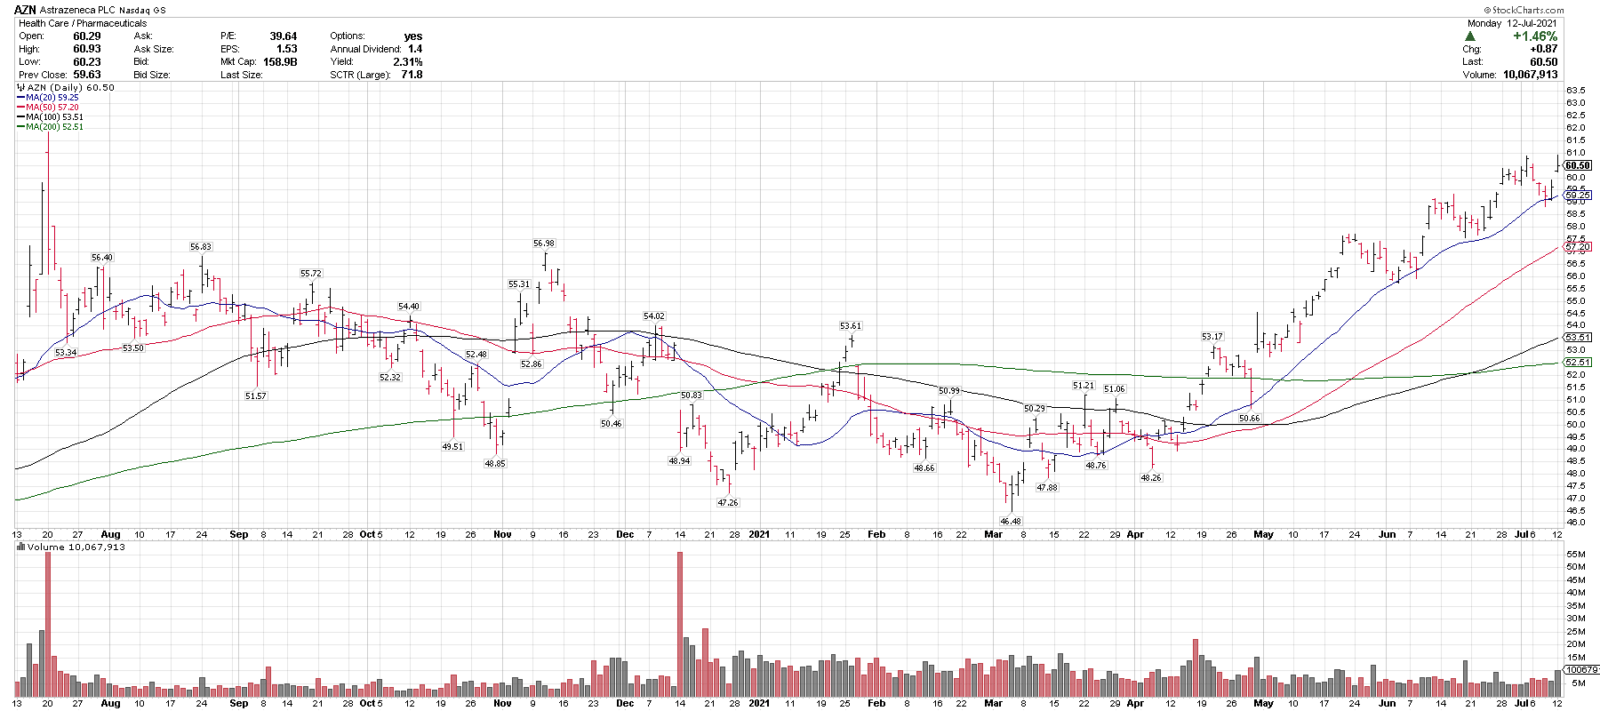
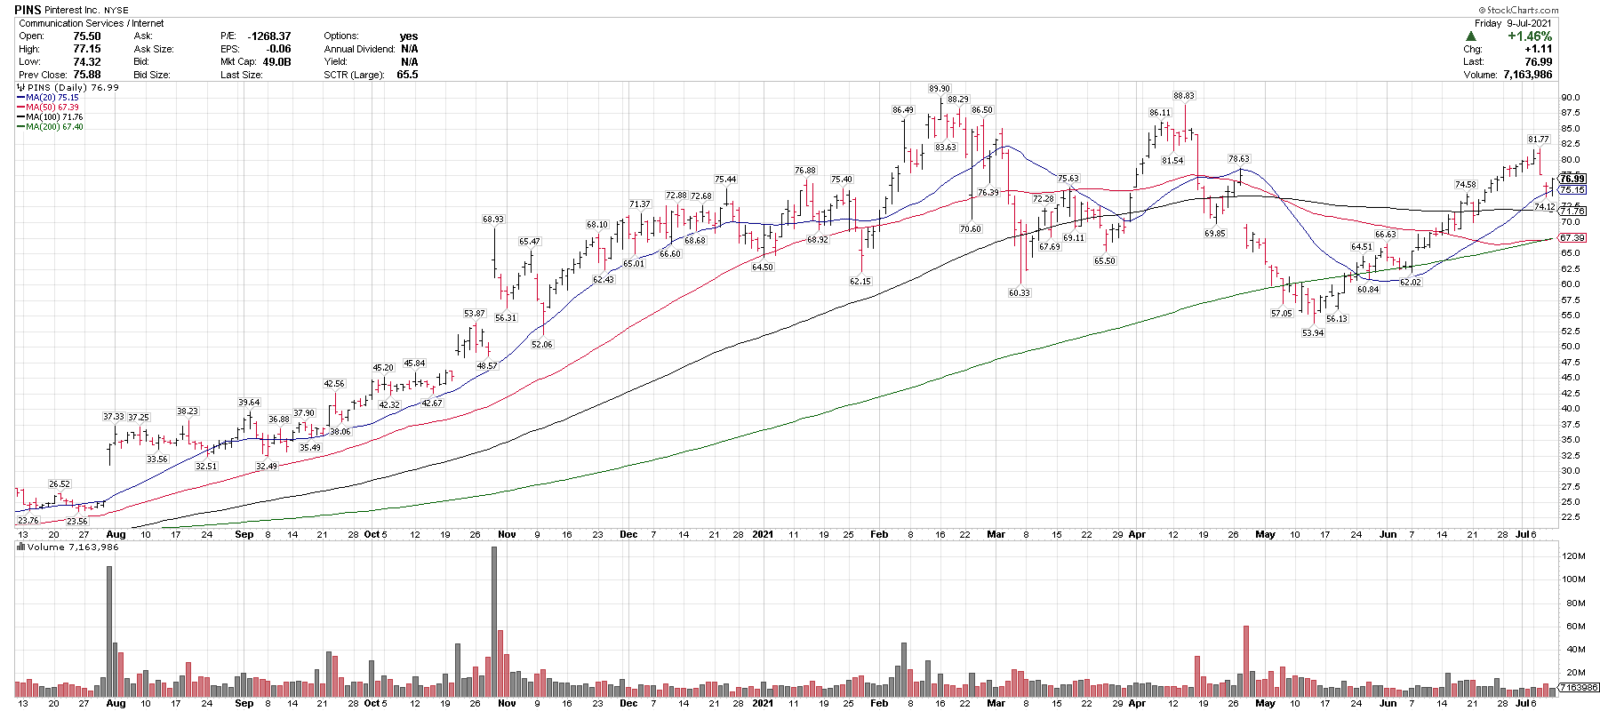
7/12/21
Pinterest, PINS
Close: 76.99
Pre: 77.31
Stop: 64.44
PINS is in an intermediate term uptrend above 3 rising MAs & recently pulled back 9.3% into the rising 20-sma. 70-72.50 is support, over 82.50 could signal a breakout.
7/9/21
ConocoPhillips, (COP)
Close: 59.21
Pre: 59.94
Stop: 49.82
COP is in an uptrend above 3 rising MAs & just pulled back 8.7% off 52-week highs into the rising 50-sma. 54-57 is support and over 64 could signal a breakout higher.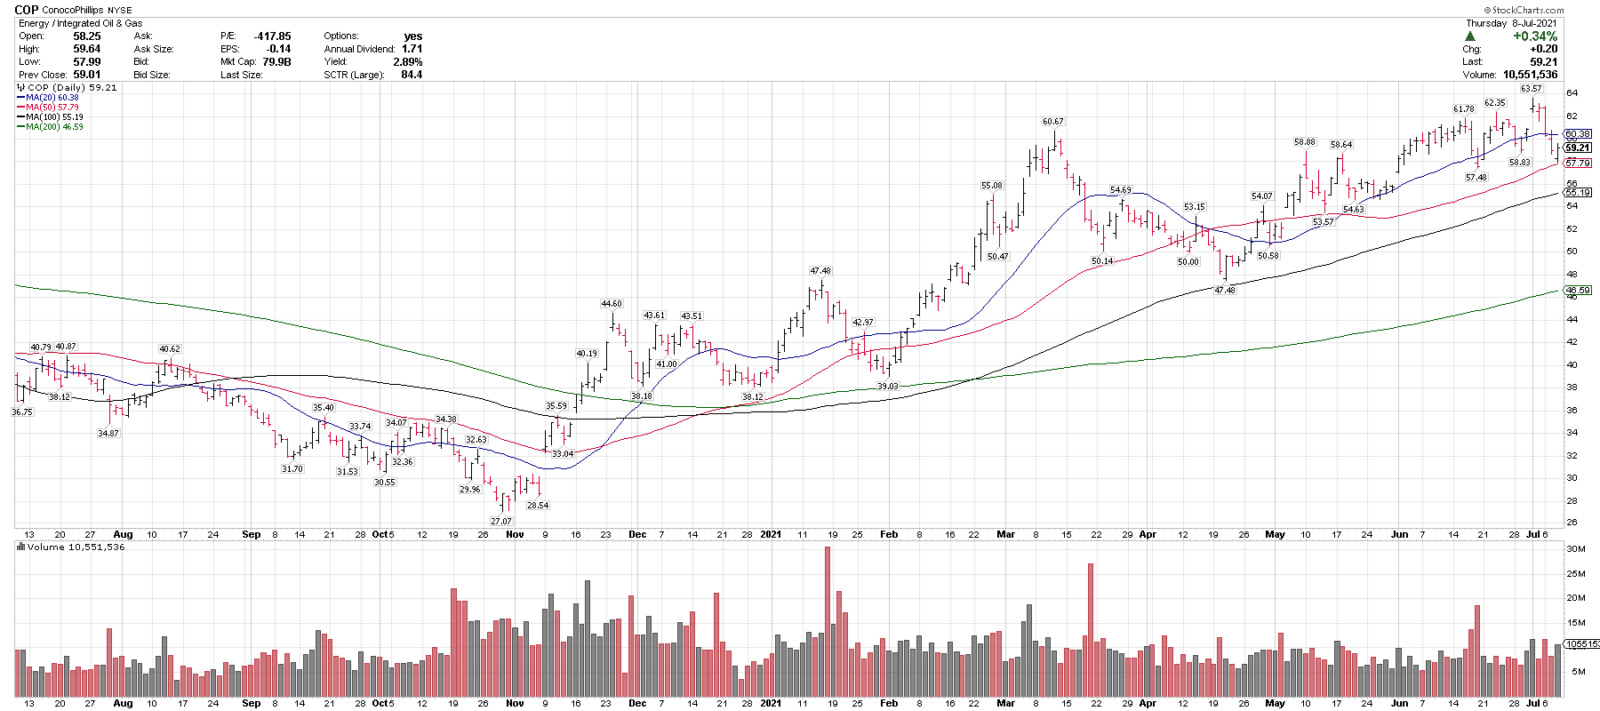
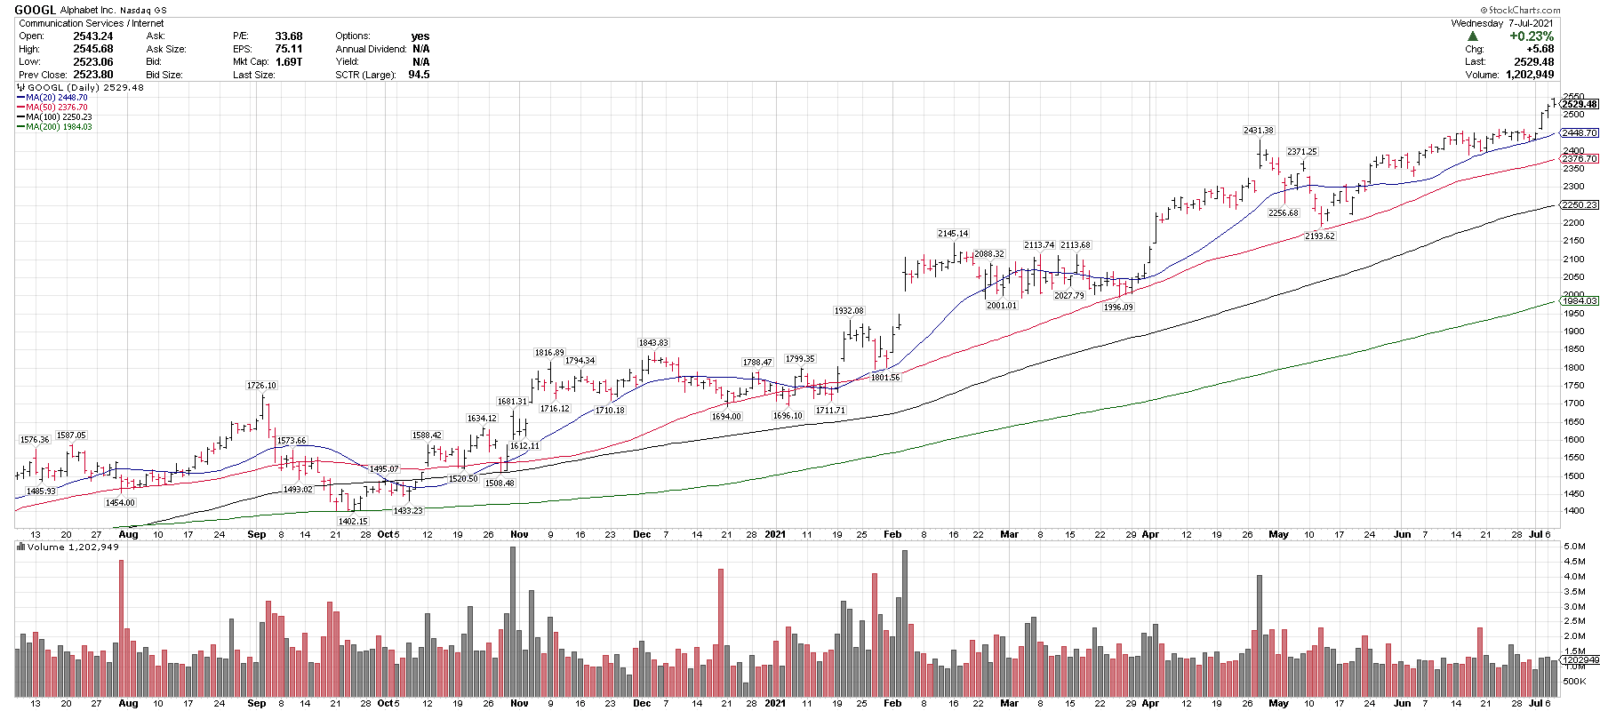
7/8/21
Alphabet, (GOOGL)
Close: 2529.48
Pre: 2492.01
Stop: 2139.40
GOOGL is in an uptrend above 4 rising MAs and recently made a new high. 2350-2450 is a near term support level. On this week’s Top 25 list.
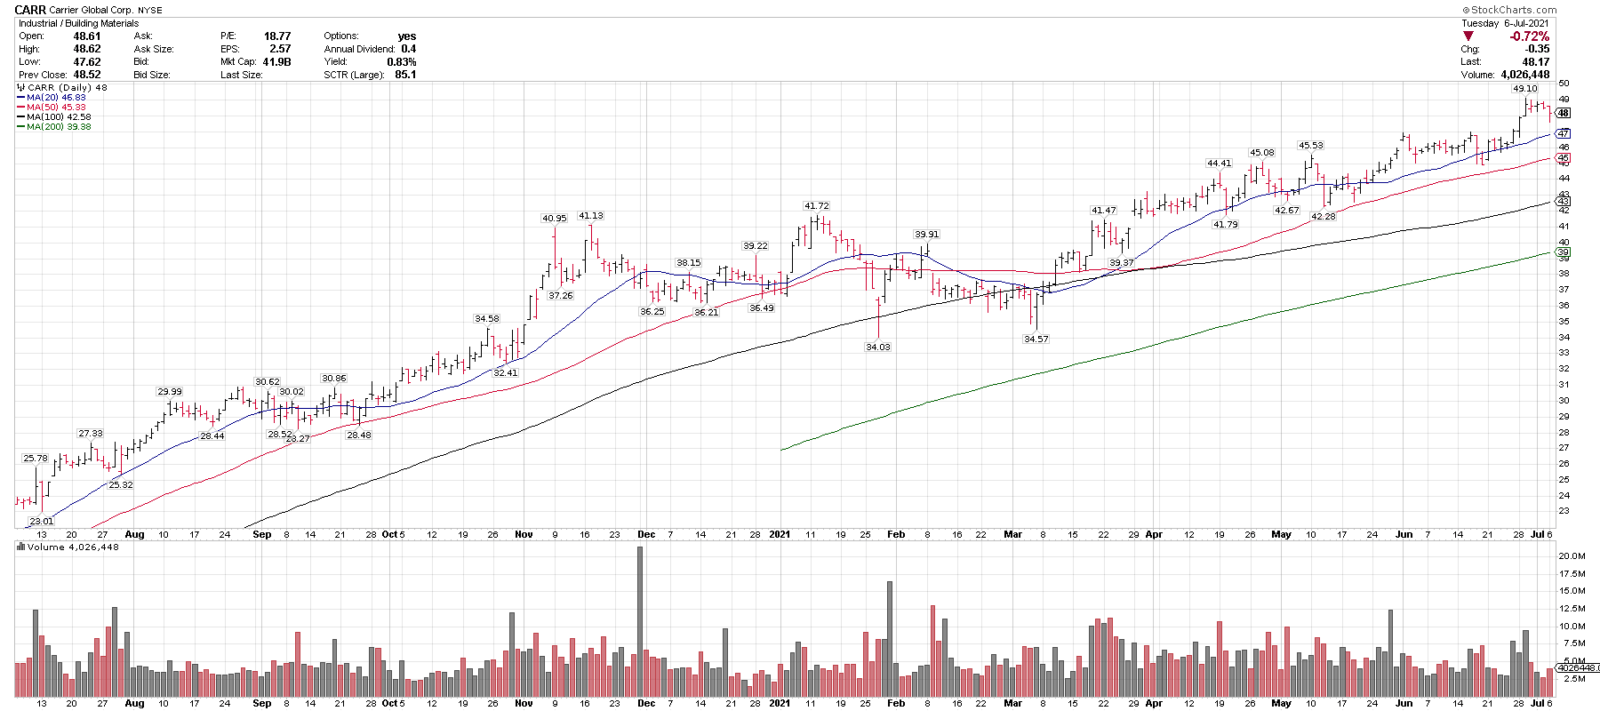
7/7/21
Carrier Global Corp. (CARR)
Close: 48.17
Pre: 48.70
Stop: 40.94
CARR is trading in an uptrend above 4 rising MAs and is consolidating off of recent highs. 45 is support and over 50 could signal a breakout higher. On this week’s Top 25 list.
7/6/21
Amazon, AMZN
Close: 3510.98
Pre: 3526.01 (+0.43%)
Stop: 2984.33
AMZN is trading in a wide range, over 4 rising MAs and made a new weekly closing high on Friday. Over 3600 could signal a breakout higher.

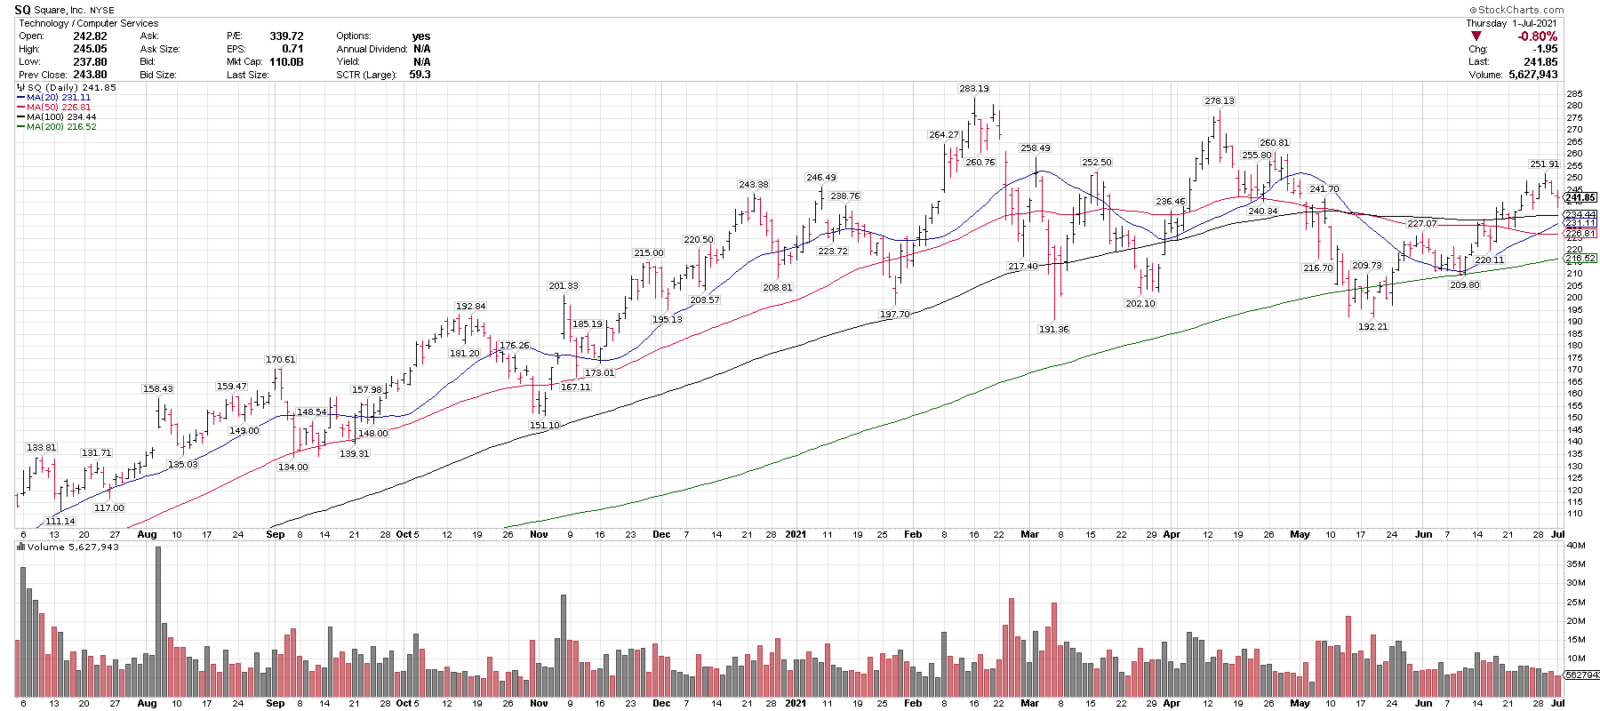
7/2/21
Square, SQ
Close: 241.85
Pre: 243.43 (+0.66%)
Stop: 204.42
SQ is in a near-term uptrend above 4 MAs and is consolidating from 60-day highs. SQ is trading over a wide support range and 250 & 260 are key overhead levels.
7/1/21 Best Ideas List – comparable to Chart of the Day
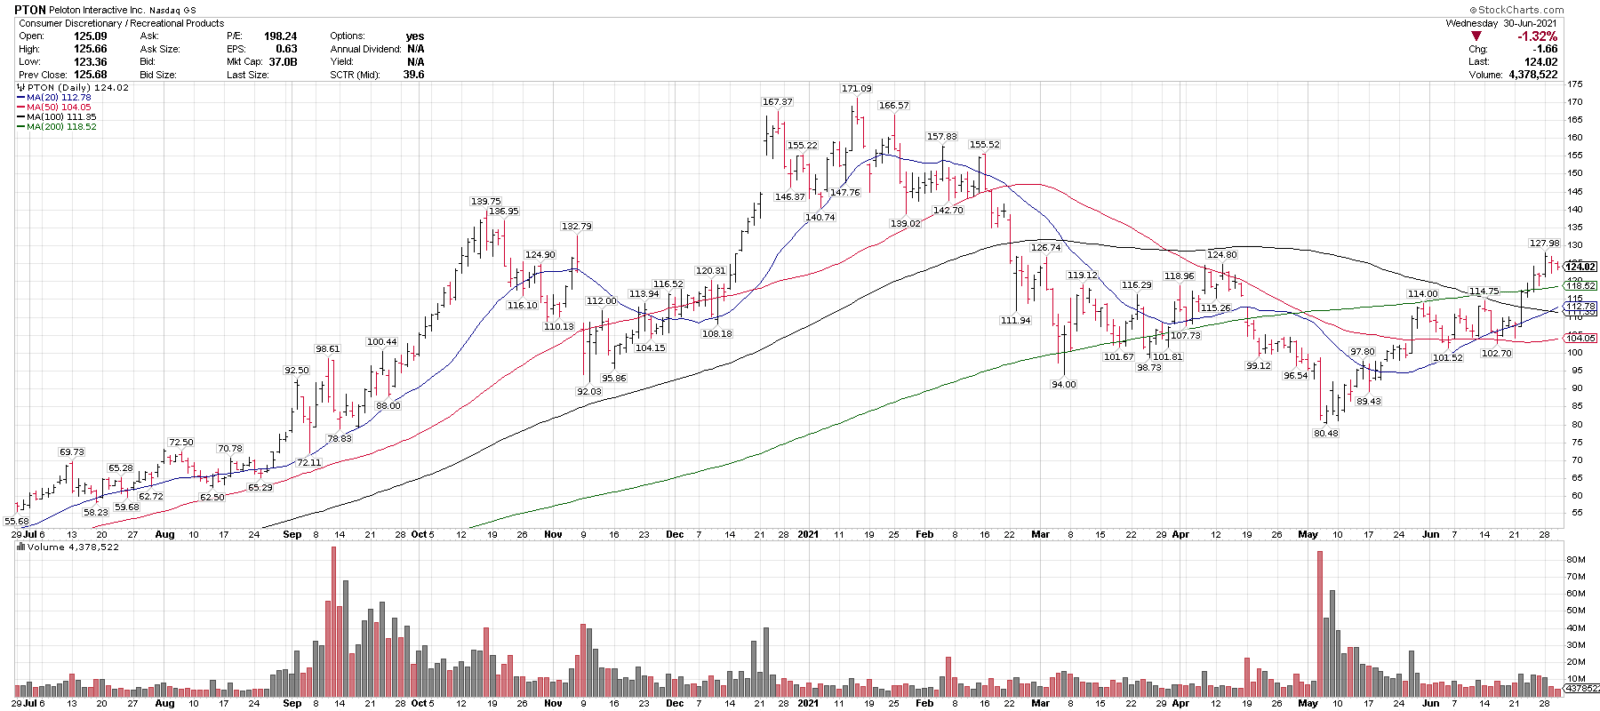
Peloton, PTON
Close: 124.02
Pre: 125.79
Stop: 102.93
PTON is trading above 4 MAs & recently reclaimed the 200-sma. It corrected 52.9% this year, but is trending higher here. 105-115 is a major support range. On this week’s Top 25 list.
7/1/21
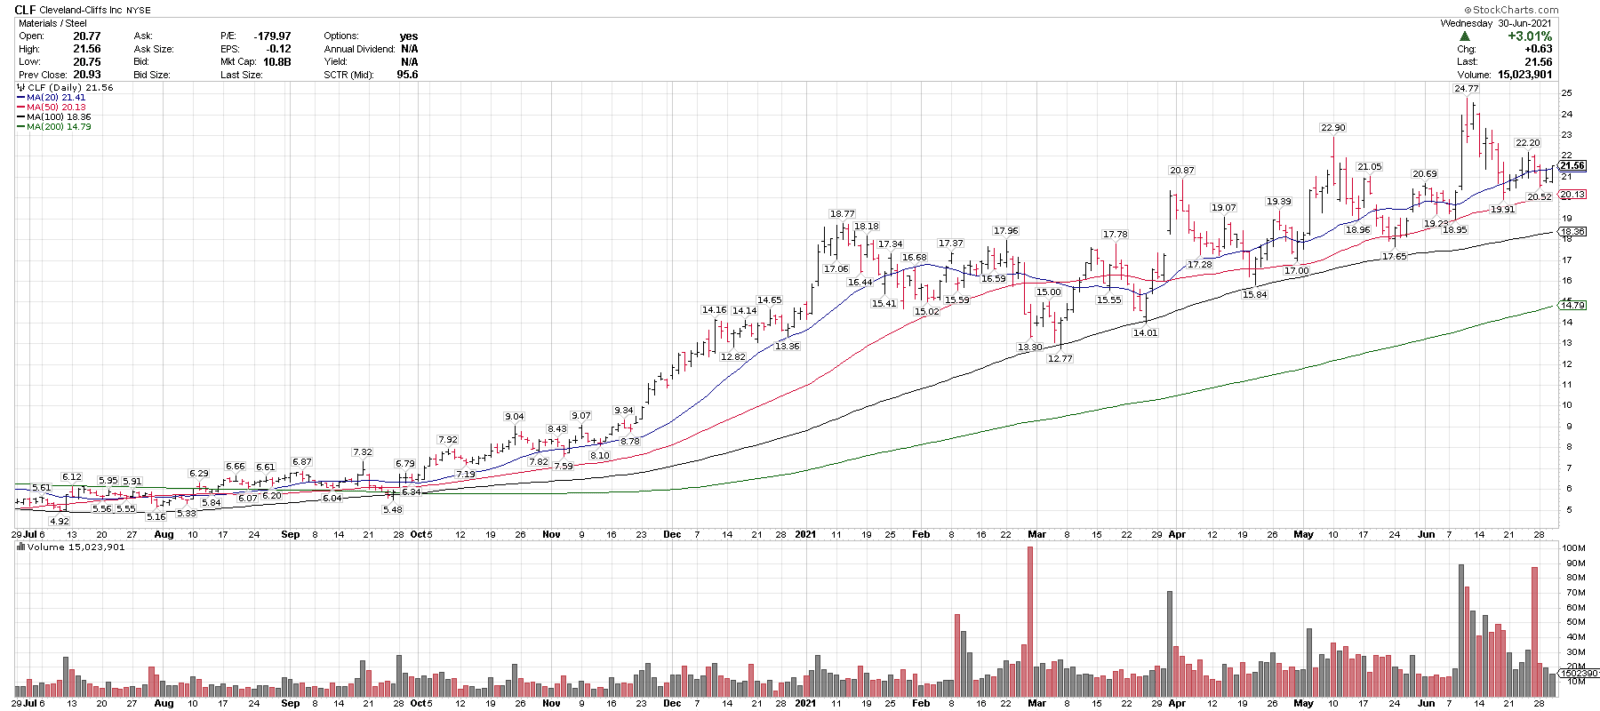
Cleveland Cliffs, CLF
Close: 21.56
Pre: 21.91
Stop: 17.89
CLF is trading in an uptrend above 4 rising MAs and recently pulled back 19.6% off multi-year highs into the rising 50-sma. The 100-sma ($18.36 currently) has held since Sept 2020. CLF is on this week’s Top 25 list.
6/30/21
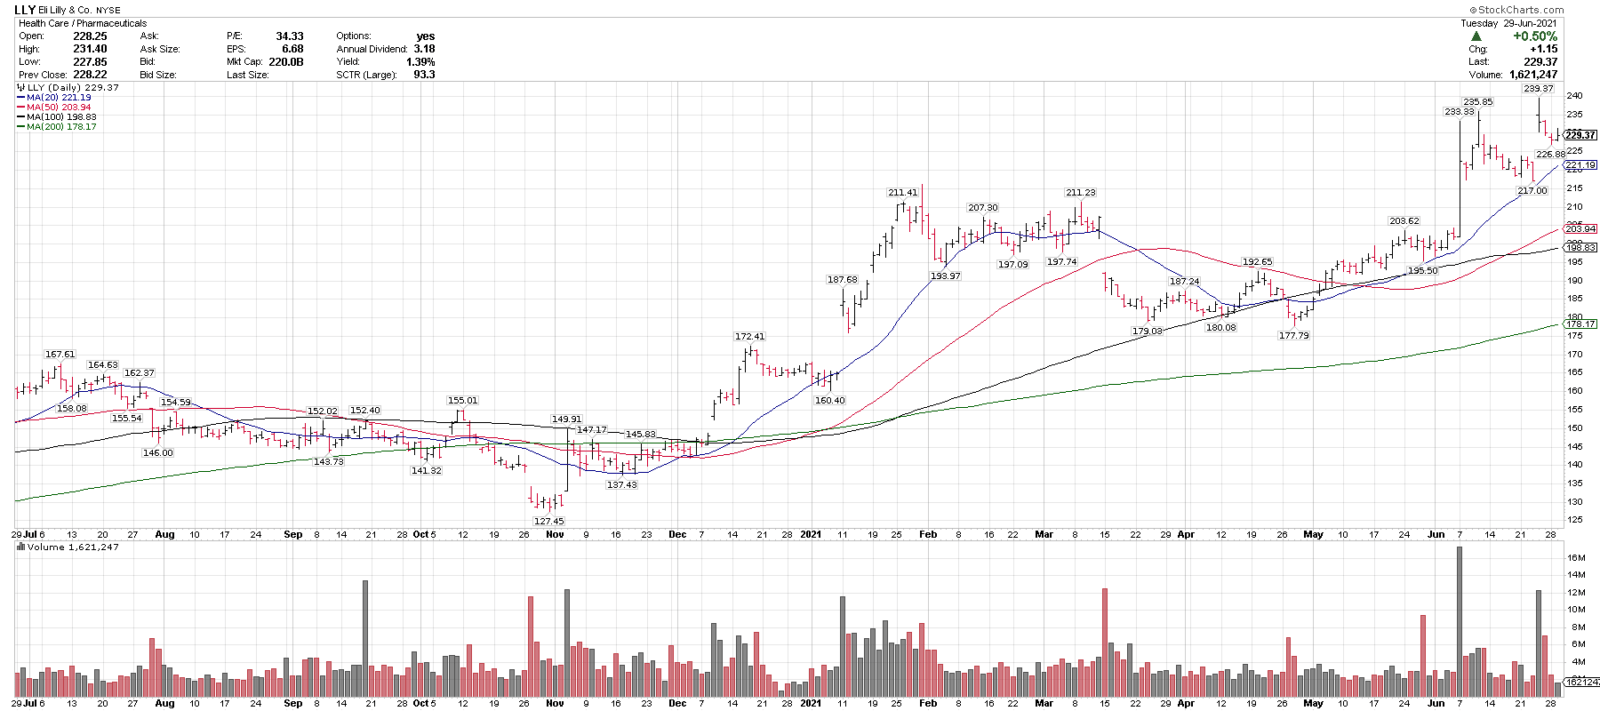
Eli Lilly, LLY
Close: 229.37
Pre: 230.00
Stop: 194.96
LLY is in an uptrend above 4 rising MAs and recently pulled back 5.1% off new highs. 215-225 is a support range and over 240 could signal a breakout higher. Is on this week’s Top 25 list.
6/29/21
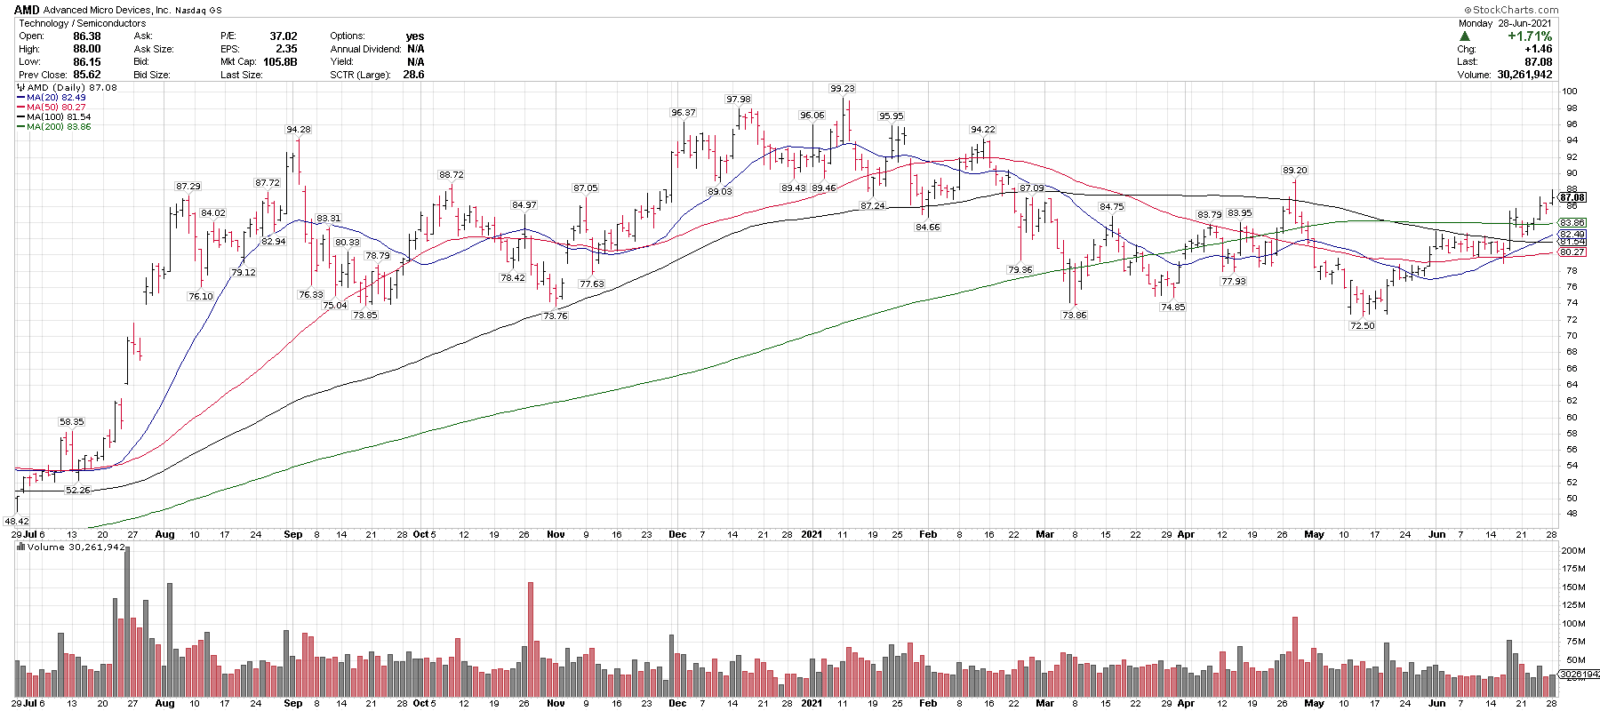
Advanced Micro Devices, AMD
Close: 87.08
Pre: 87.18
Stop: 73.80
AMD is trading > 4 MAs, rising 20 & 50-sma + rising 40-week sma. It closed at 4-month highs, w/improving relative strength, trading over a wide support range. On the last two Top 25 lists. 90 is a breakout level.
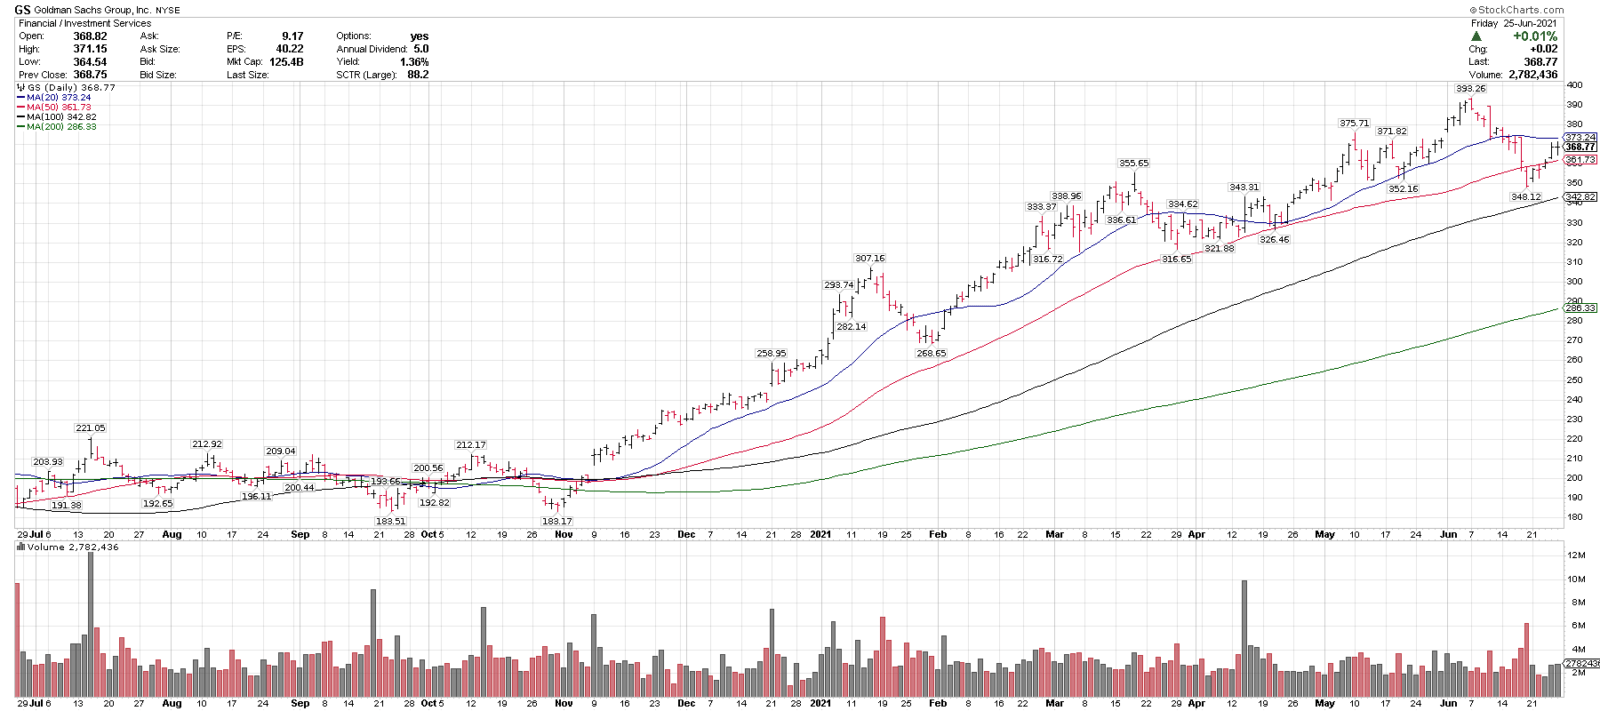
6/28/21
Goldman Sachs, GS
Close: 368.77
Pre: 367.90
Stop: 313.45
GS is trading in an uptrend above 3 rising MAs (50,100, 200) & recently pulled back 11.4% off new highs. 340-350 is key support and 380 and 400 are overhead breakout levels.
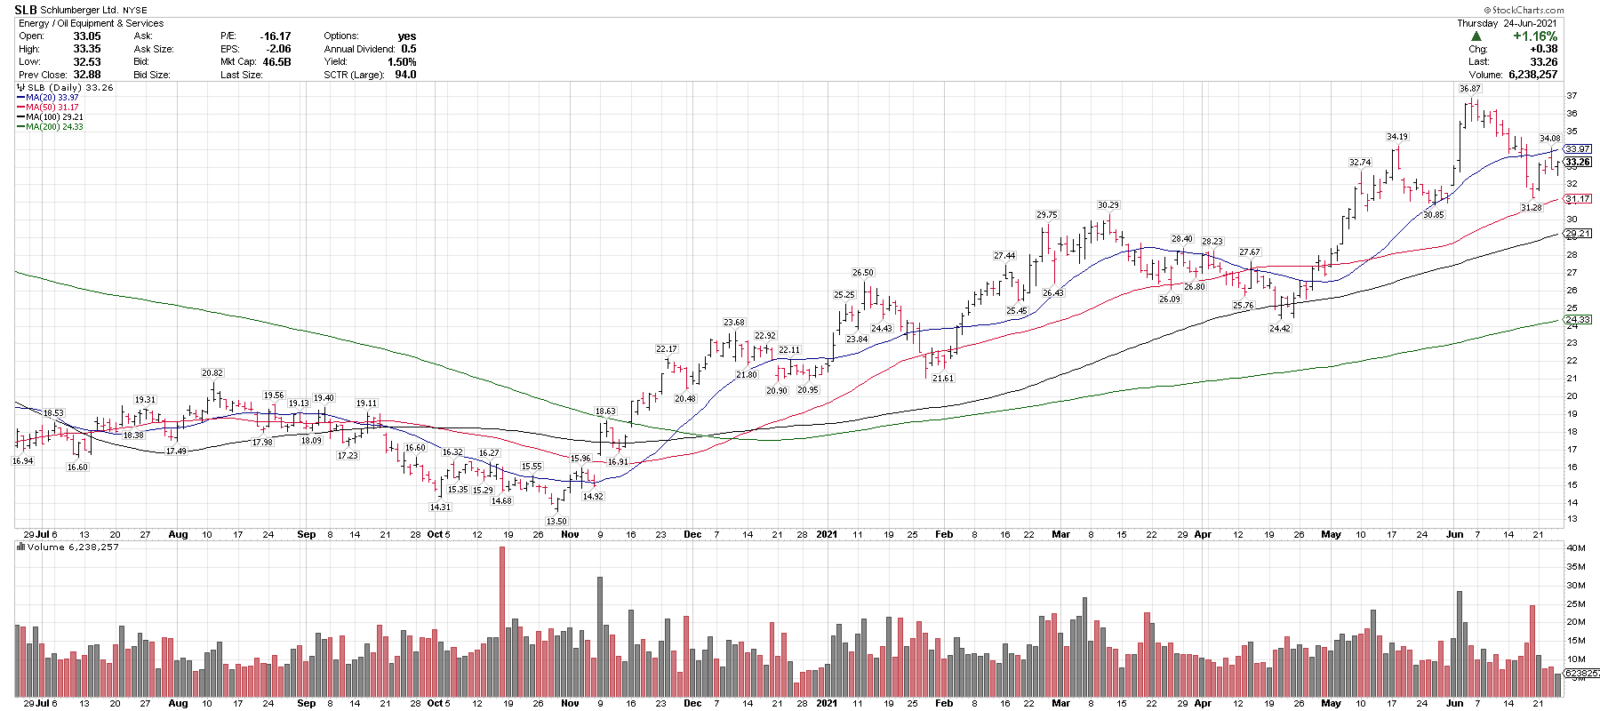
6/25/21
Schlumberger, SLB
Close: 33.26
Pre: 33.43
Stop: 28.27
SLB is in an uptrend above 3 rising MAs and recently pulled back 15.1% off a 52 week high, into the rising 50-sma. 30-31 is a support range and over 37 could signal a breakout.
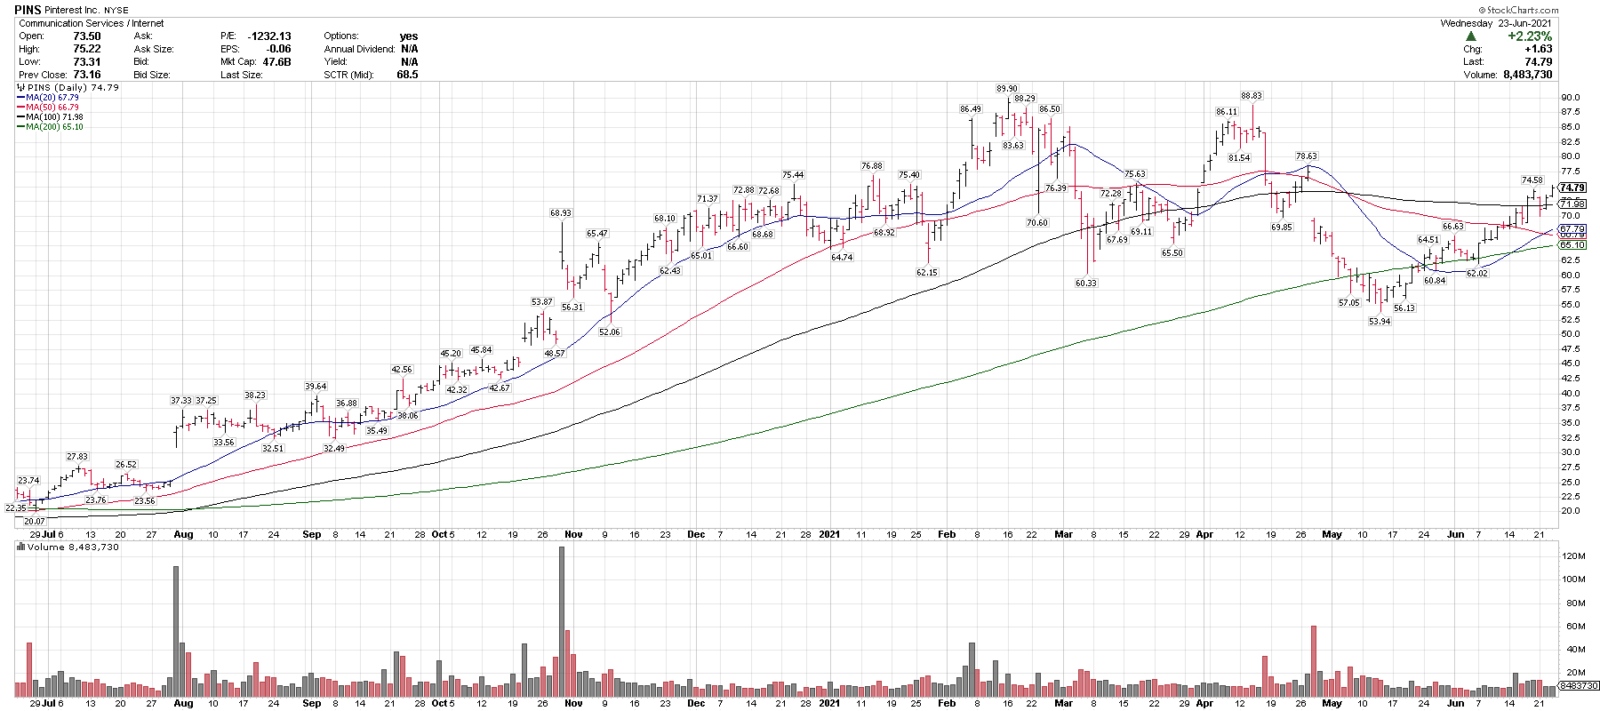
6/24/21
Pinterest, PINS
Close: 74.79
Pre: 75.59
Stop: 62.82
PINS is trading above 4 MAs, recently had a bullish 20/50-sma cross, and is trying to break out over 75 pre-market. There is key support in the 65-70 range. PINS is on this week’s Top 25 list.
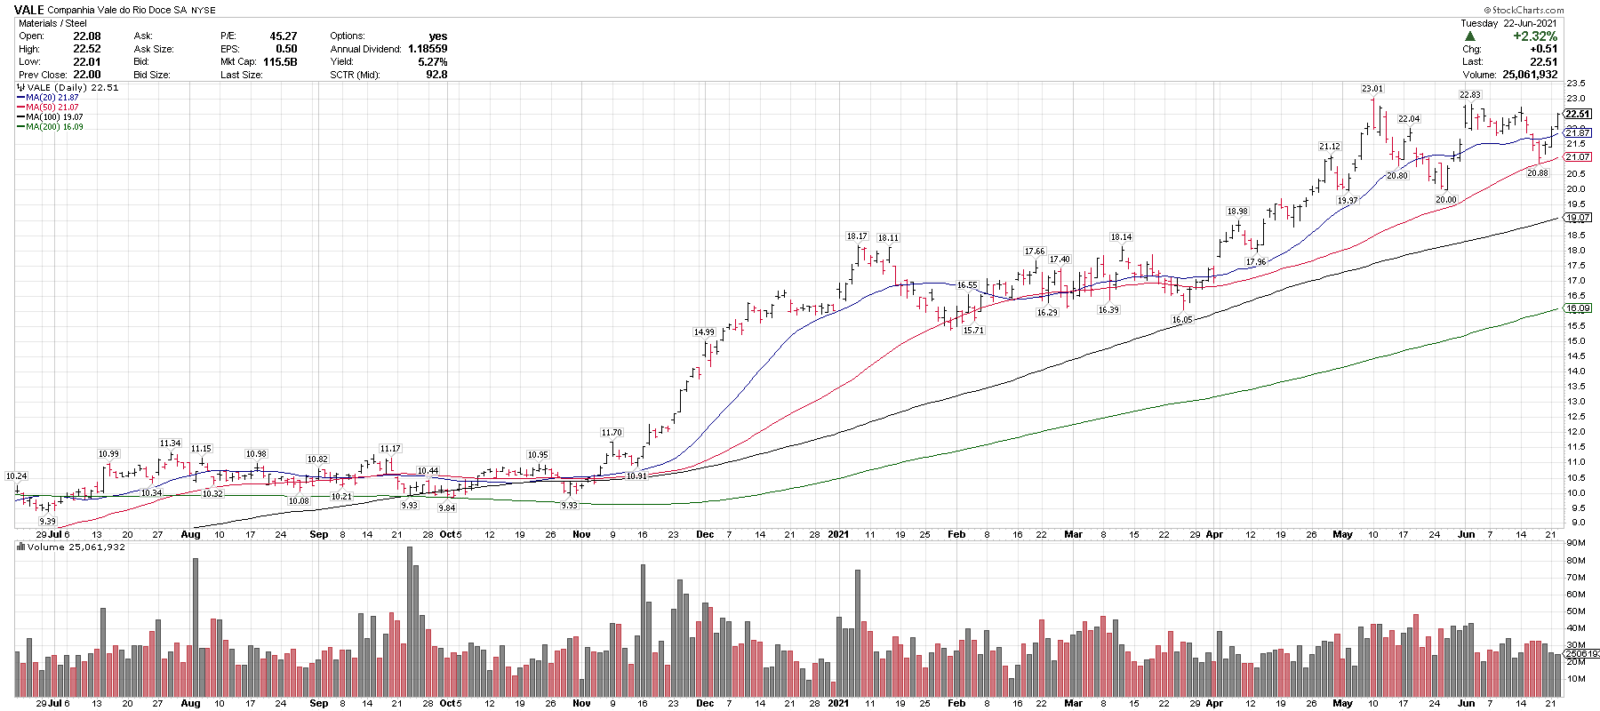
6/23/21
Vale, VALE
Close: 22.51
Pre: 22.59
Stop: 18.90
VALE is in an uptrend above 4 rising MAs & recently corrected 8.5% into the rising 50-sma. 20 is a key support level and over 23.50 could signal a breakout.
6/22/21
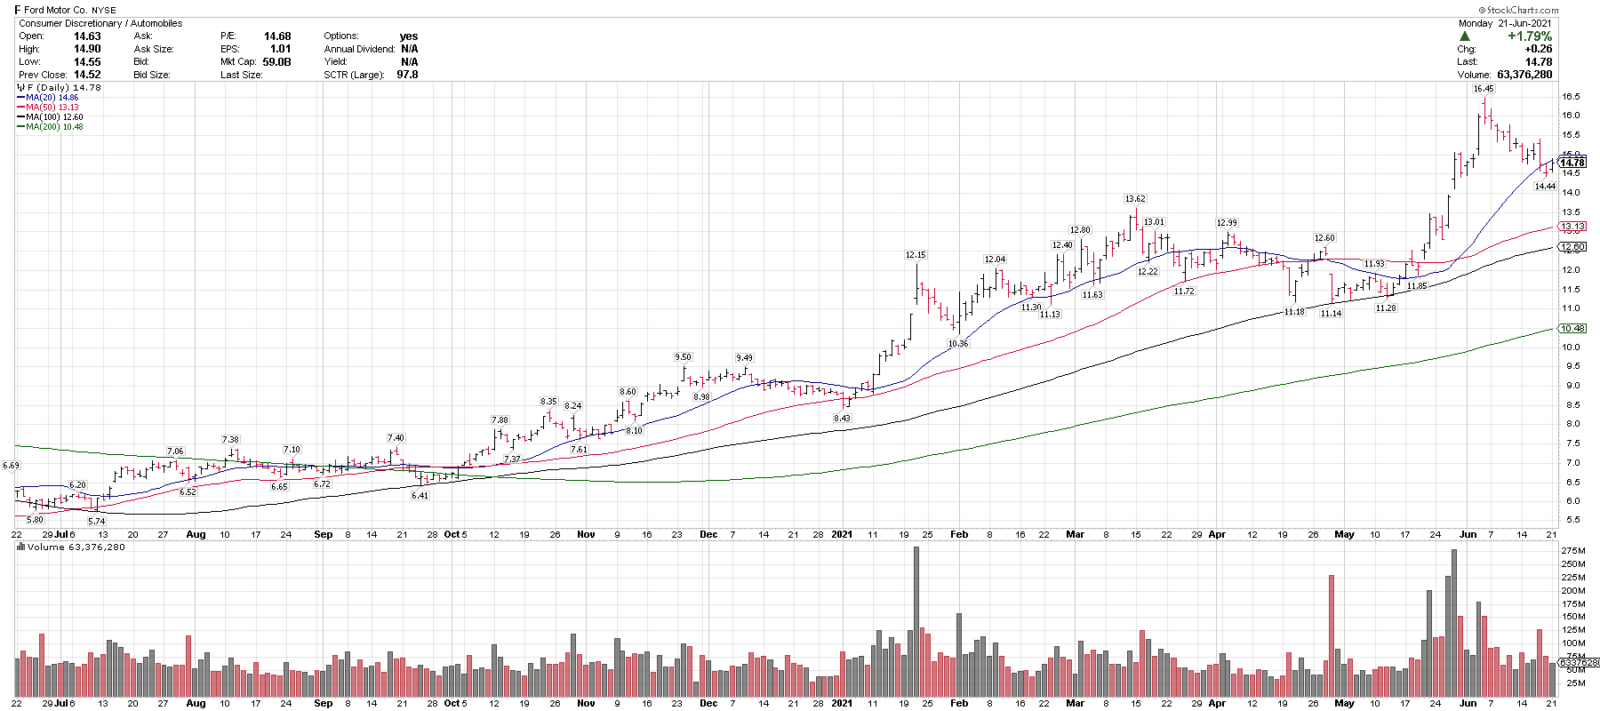
Ford Motor Co., F
Close: 14.78
Pre: 14.87
Stop: 12.46
F is in an uptrend above 3 rising MAs and recently pulled back 12.2% off of multi-year highs. 13.50 is a support level and over 15 could signal higher. On this week’s Top 25 list.
6/21/21
Roku, ROKU
Close: 368.43
Pre: 368.00
Stop: 294.74
ROKU is currently trading over 4 moving averages (20, 50, 100 & 200) sma and rising 20 and 200-day moving averages. ROKU just completed a bullish 20/50-sma cross last week, indicating improving near-term price momentum. It had a 31.5% pullback in April/May, and recovered to close on Friday at the highest weekly close since April 2021. 325-350 is a near-term support range and over 380 could signal a breakout higher. Note: ROKU is a higher volatility stock.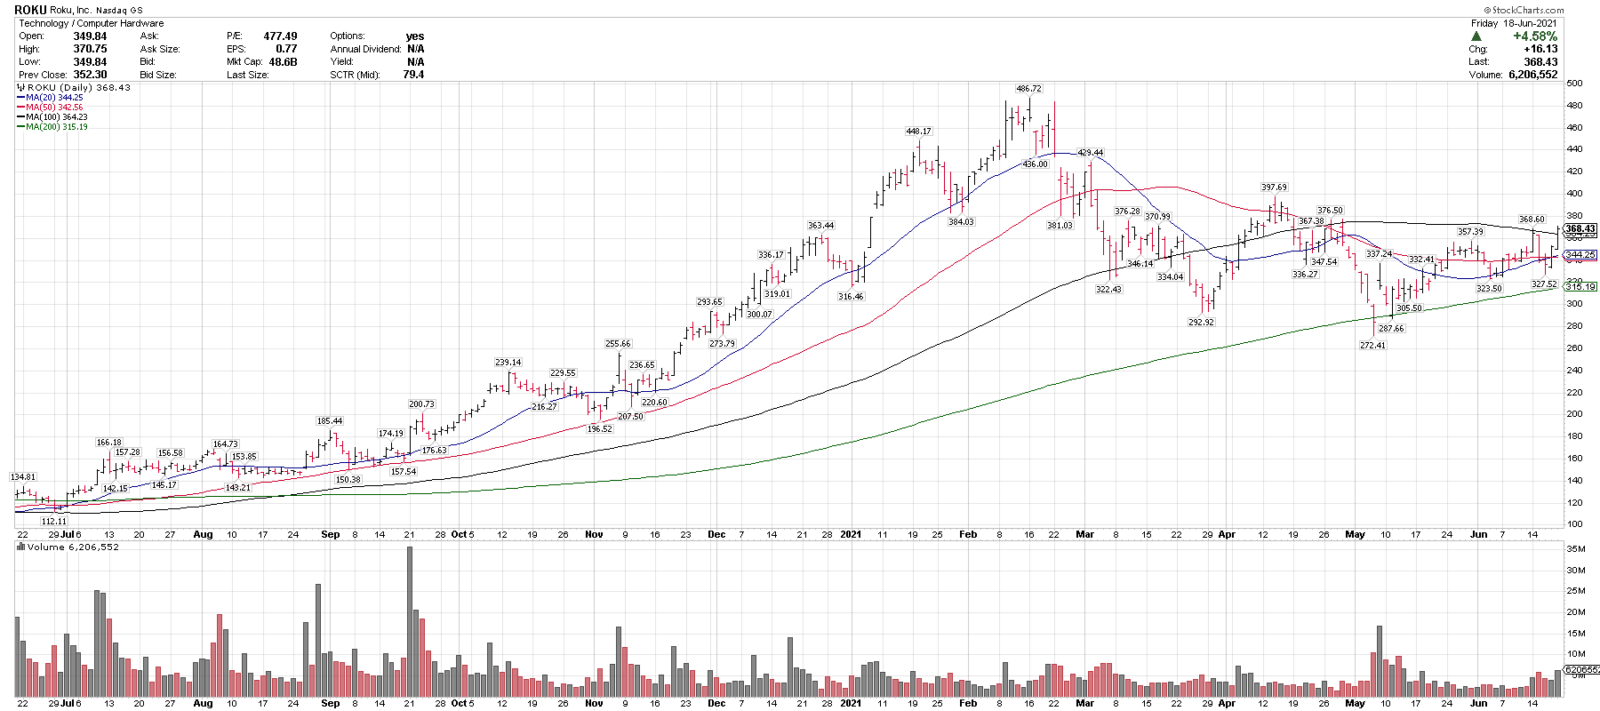
6/18/21
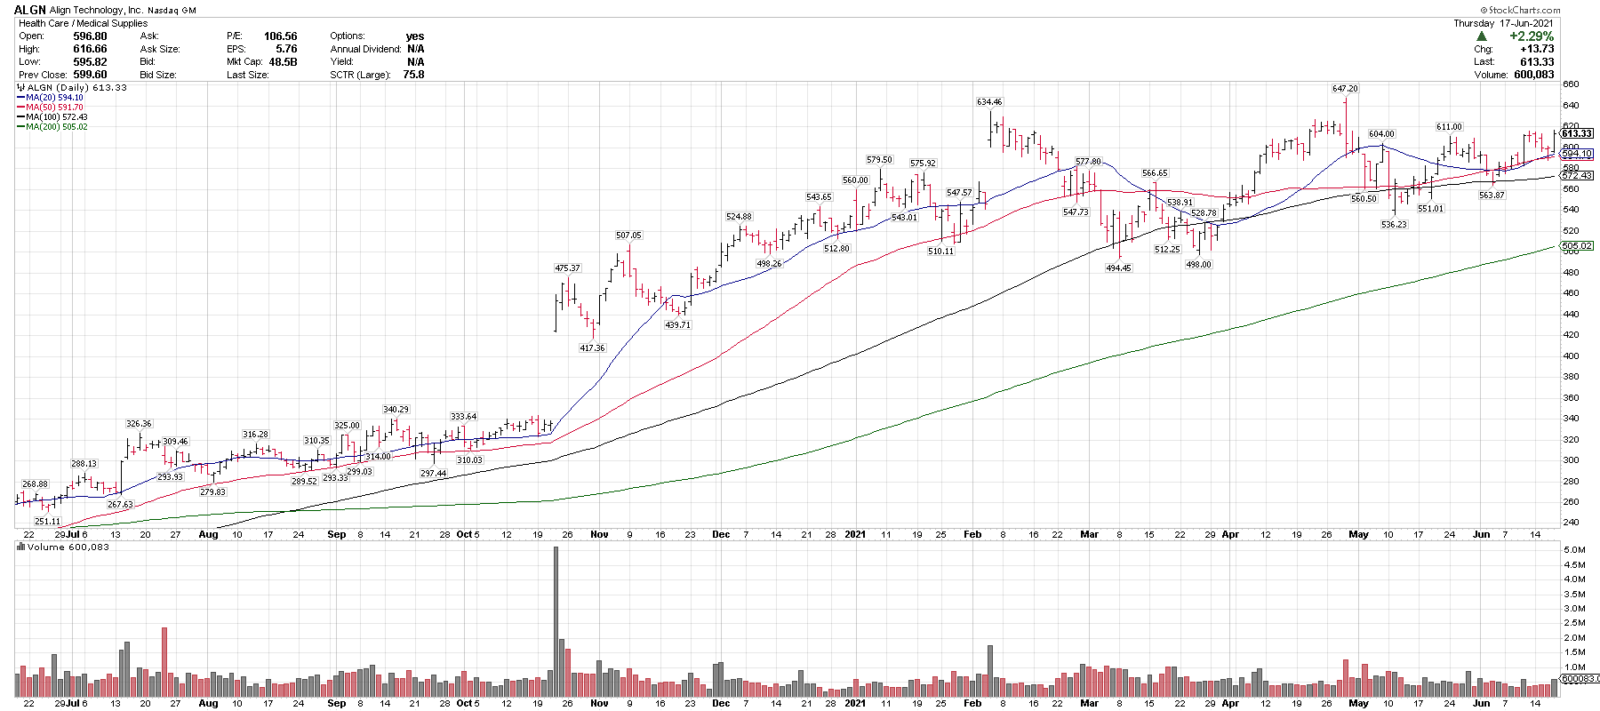
Align Technology, ALGN
Healthcare Sector
Close: 613.33
Pre: 614.00
Stop: 514.19
ALGN is consolidating above 4 rising MAs & recently pulled back 17.1% from new highs. 560 is a support level and over 660 could signal a breakout.
6/17/21
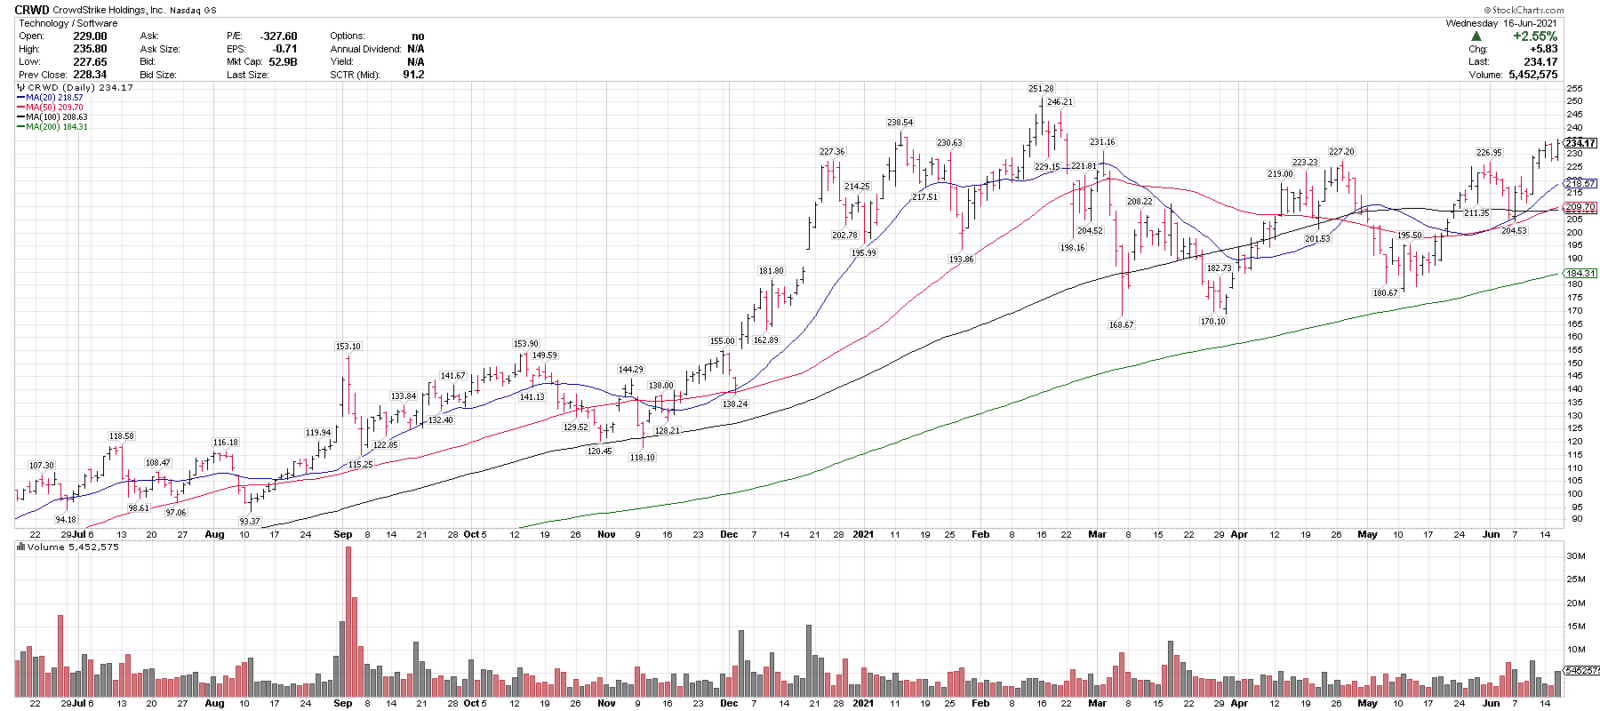
Crowdstrike, CRWD
Close: 234.17
Pre: 232.01
Stop: 186.31
CRWD is trading above 4 MAs (3 rising) and closed at 4 month highs yesterday. 205-225 is a major support range. CRWD is a higher volatility stock & on this week’s Top 25 list.
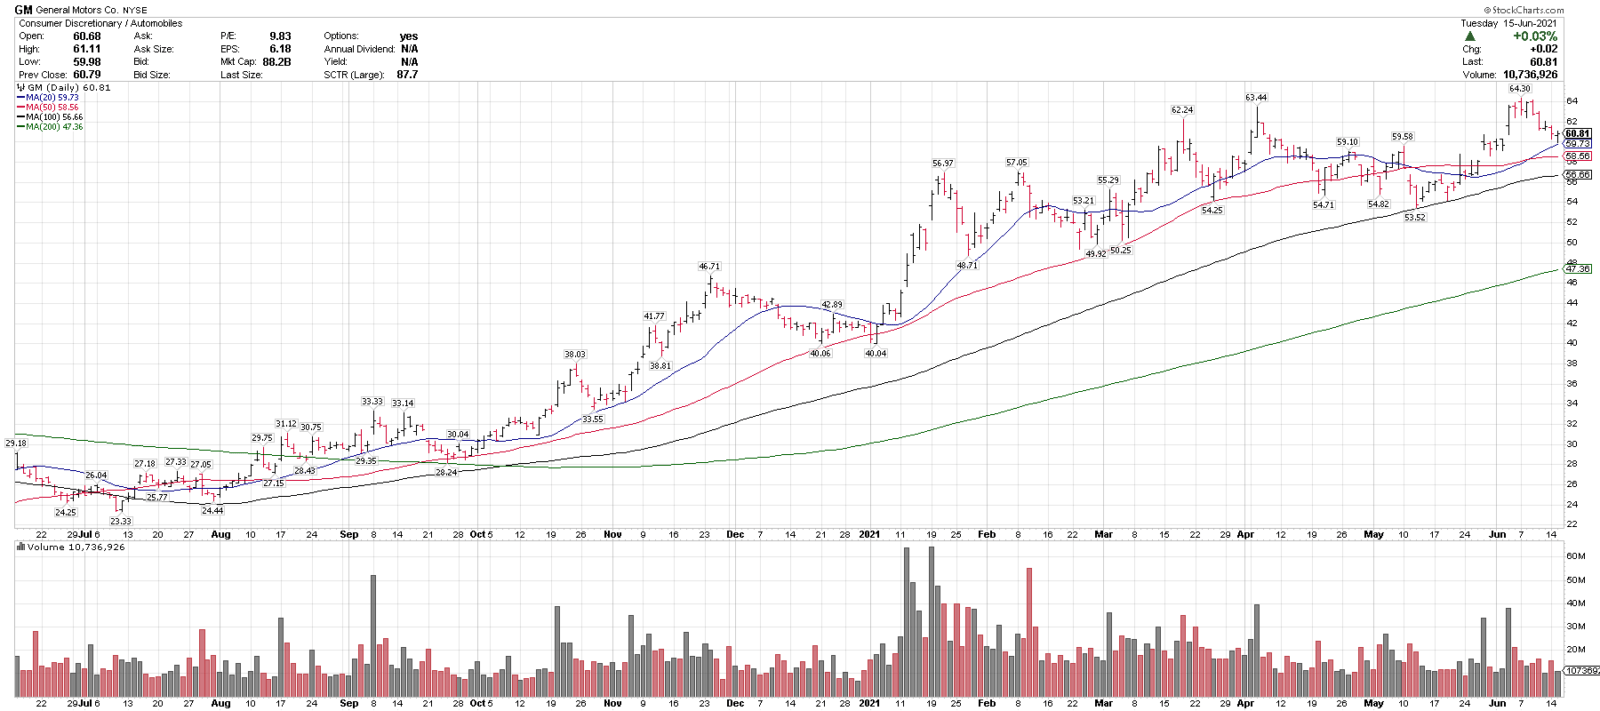
6/16/21
General Motors, GM
Close: 60.81
Pre: 60.94
Stop: 51.68
GM is in an uptrend above 4 rising MAs and recently pulled back 6.7% off of new highs. 54-60 is a key support level and over 65 could signal a breakout.
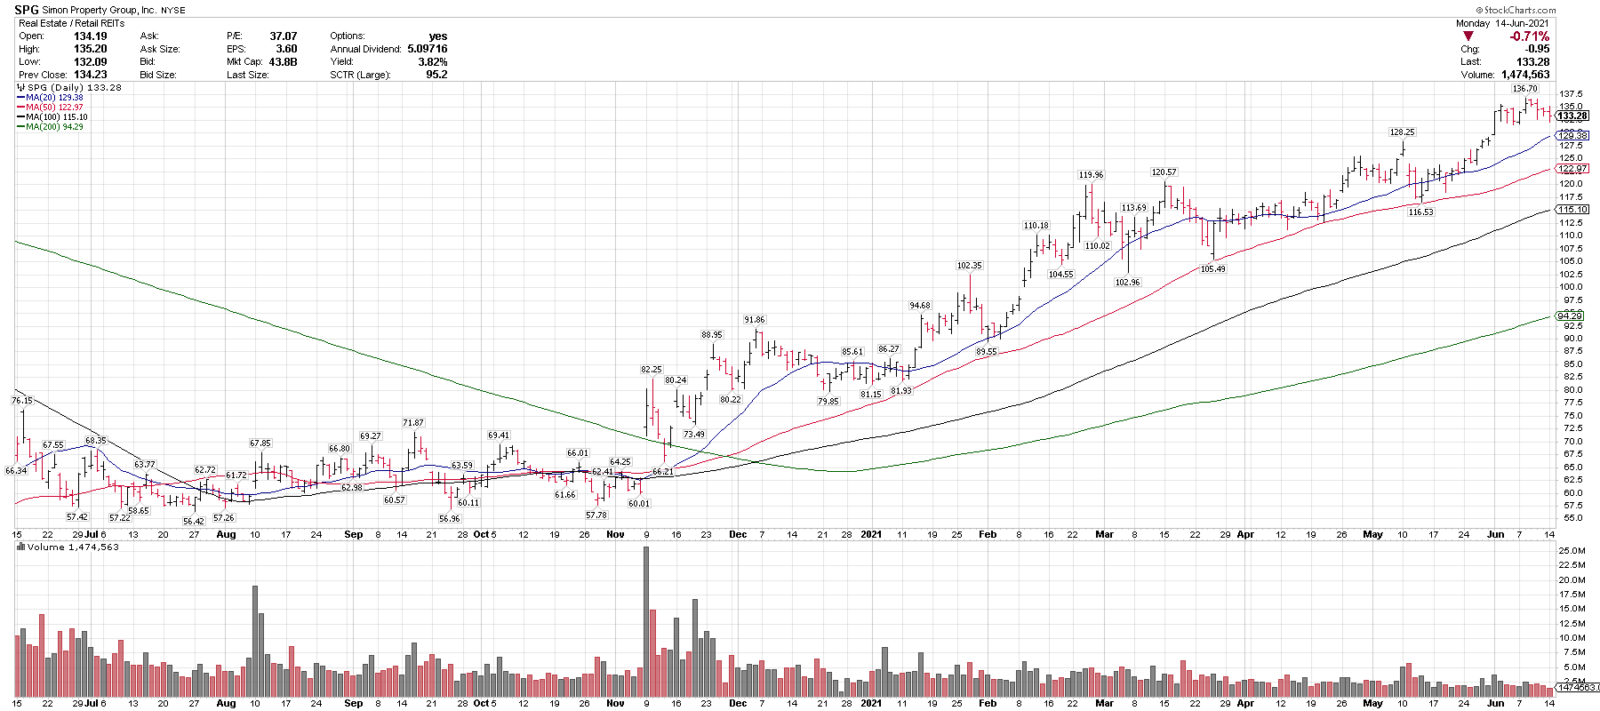
6/15/21
Simon Property Group, SPG
Close: 133.28
Pre: 133.10
Stop: 113.26
SPG is in an uptrend above 4 rising MAs, and is consolidating off of recent new highs. 120-125 is a support range, and over 138.50 could signal a breakout.
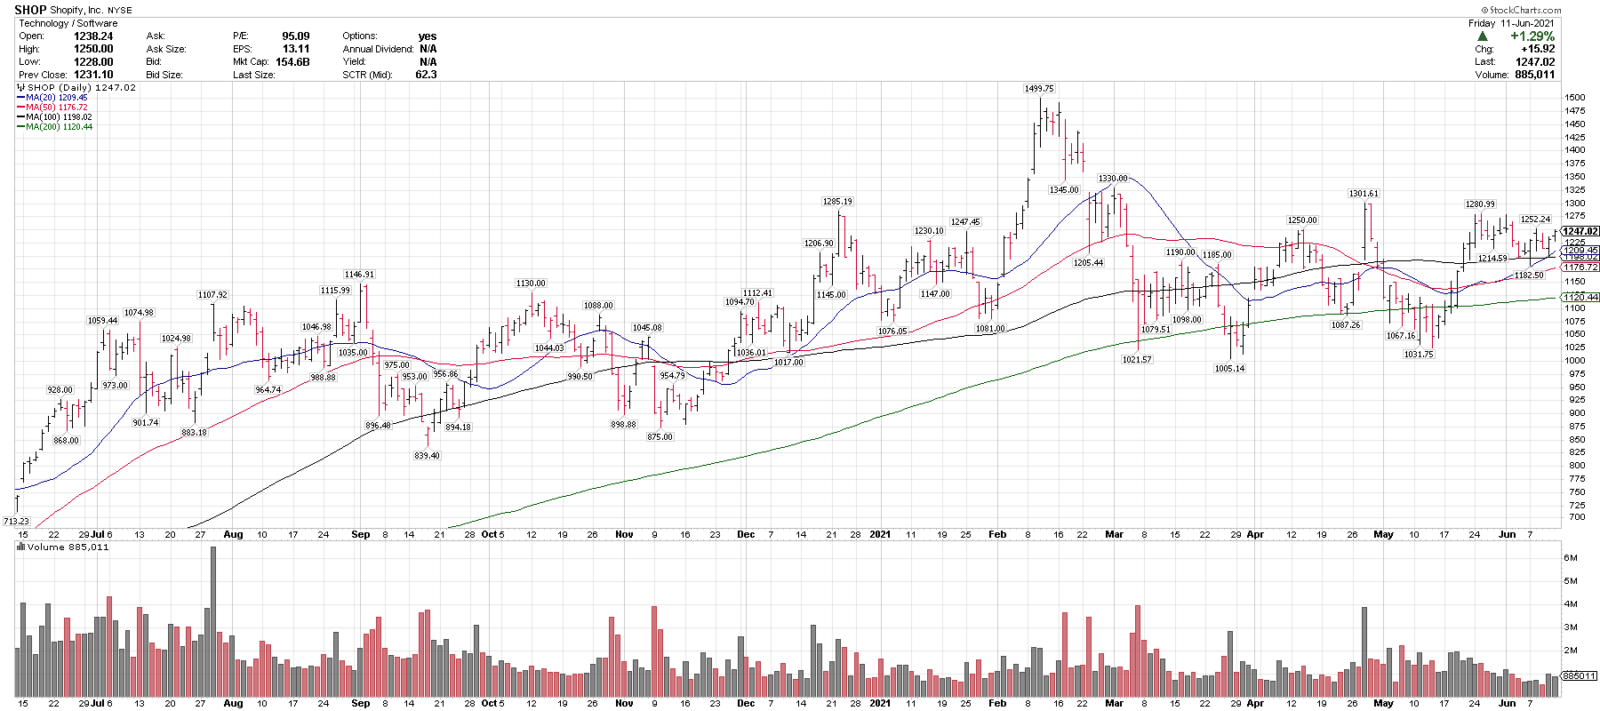
6/14/21
Shopify, SHOP
Close: 1247.02
Pre: 1252.72
Stop: 994.61
SHOP is trading > rising 20, 50 & 200-sma & had the highest weekly close since Feb 2021. 1100-1200 near-term support, 1000 is a major LT support level. Over 1300 could signal a breakout higher.
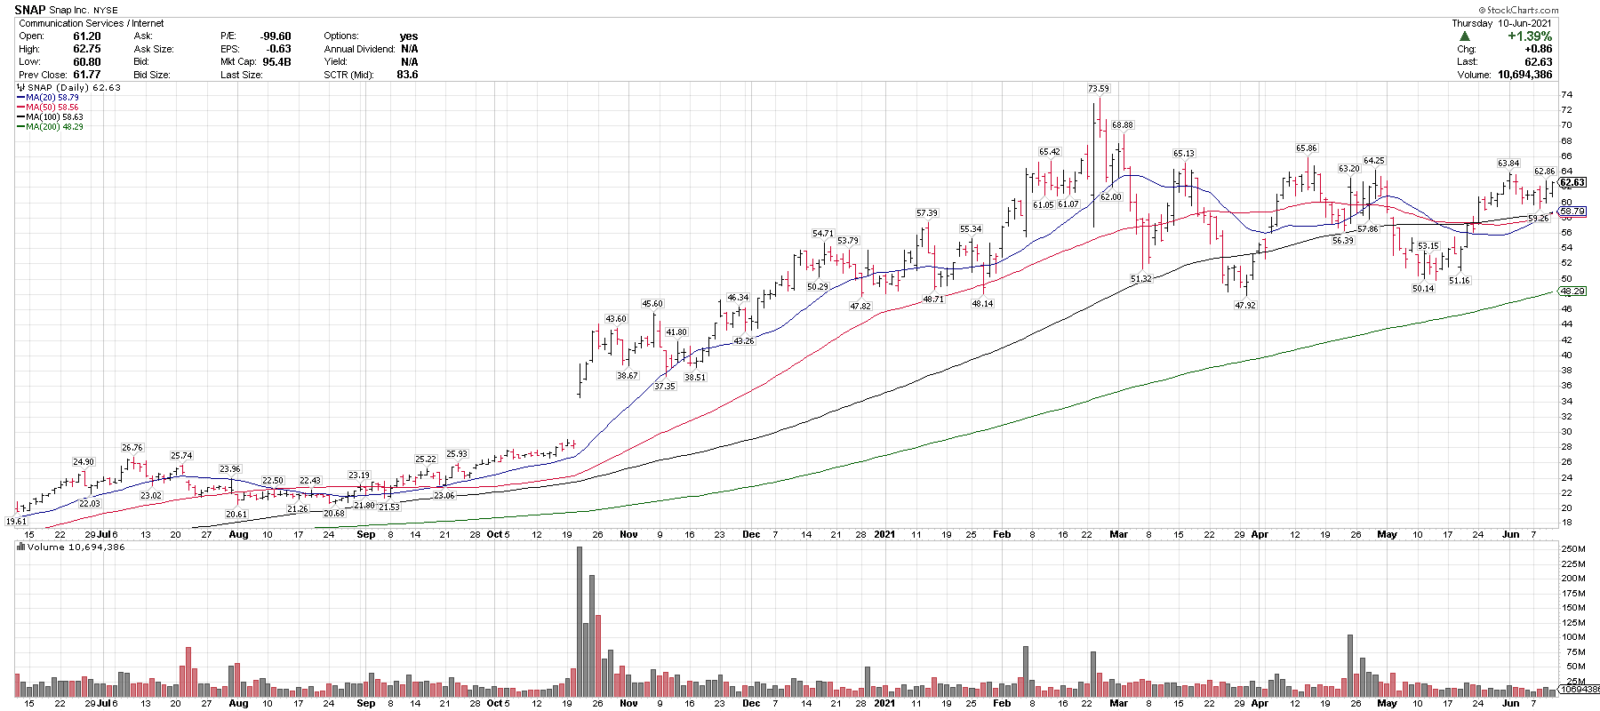
6/11/21
Snapchat, SNAP
Close: 62.63
Pre: 63.00
Stop: 52.40
SNAP is trading above 4 rising MAs, had a bullish 20/50-sma cross yesterday and recently completed a 21.9% pullback. 54-58 is support and over 66 could signal a breakout higher. On this week’s Top 25 list.
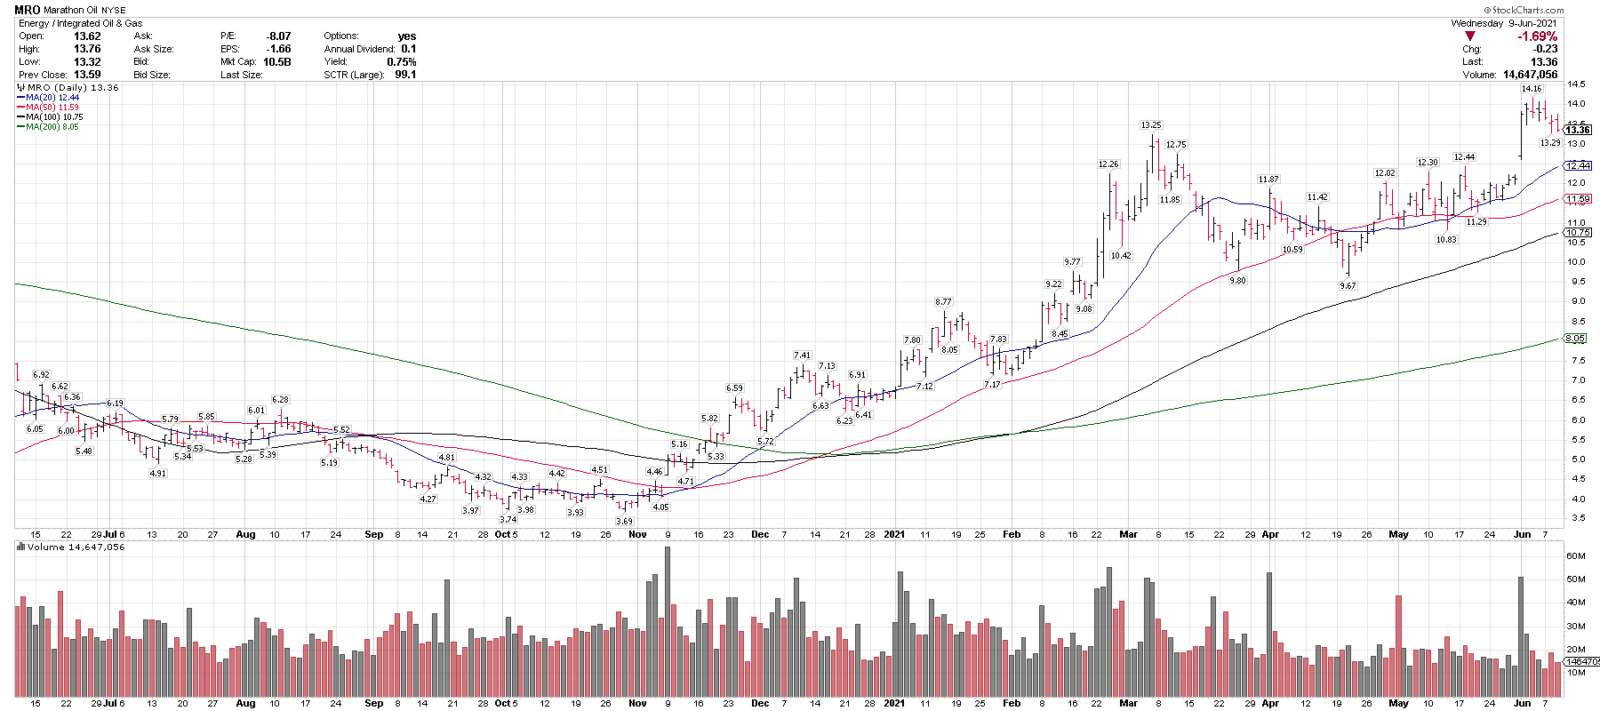
6/10/21
Marathon Oil, MRO
Close: 13.36
Pre: 13.68
Stop: 10.92
MRO is consolidating in an uptrend above 4 rising MAs and recently broke out to new highs. 11.50 to 12.50 is a support range and over 14.50 could signal a breakout.
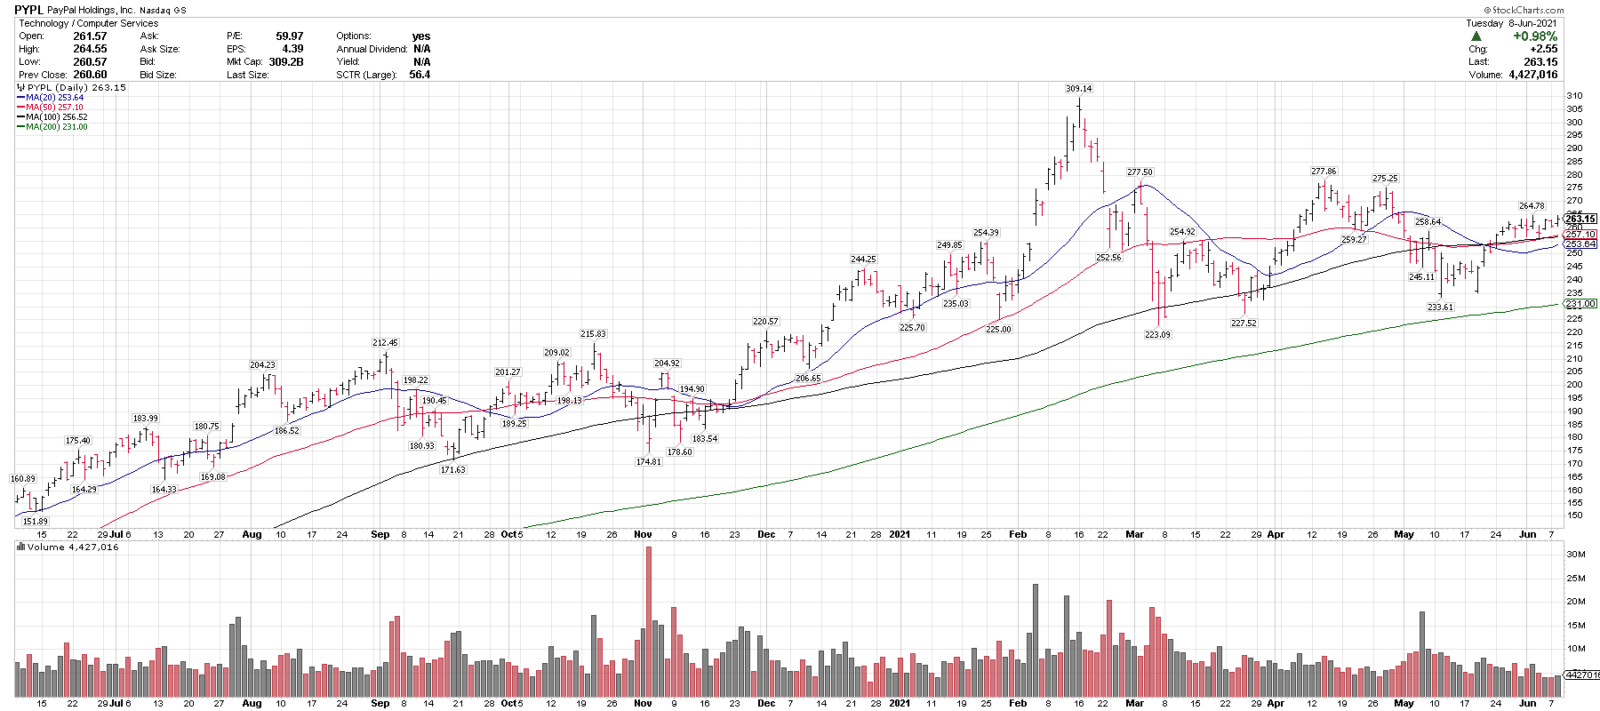
6/9/21
Paypal, PYPL
Close: 263.15
Pre: 264.75
Stop: 223.67
PYPL is trading over 4 rising MAs and is in a longer term uptrend above major support in the 225-250 range.
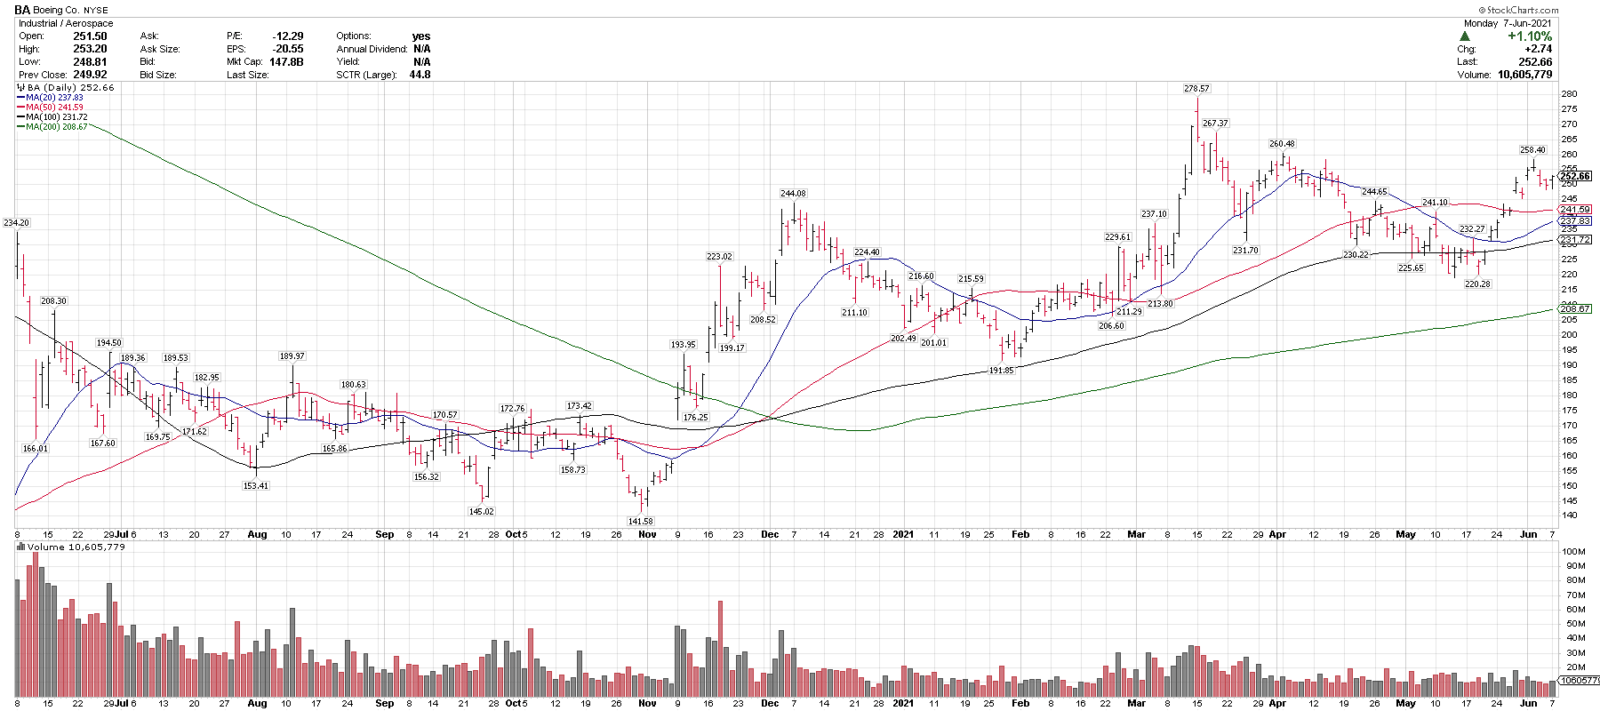
6/8/21
Boeing, BA
Close: 252.66
Pre: 256.13 (1.39%)
Stop: 214.76
BA is trading above 4 MAs and recently tested 60-day highs. 240 & 245 are near term support levels.
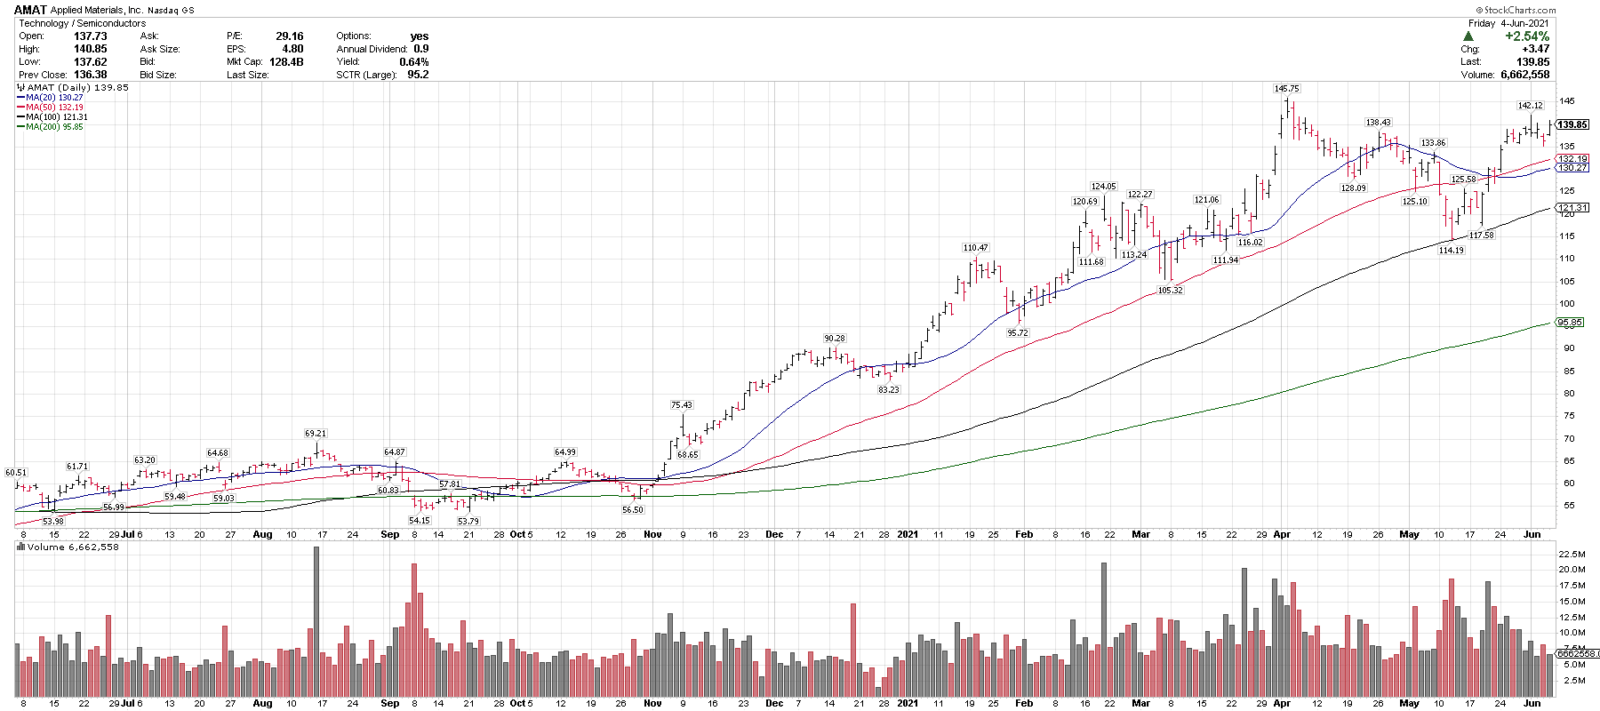
6/7/21
Applied Materials, AMAT
Close: 139.85
Pre: 139.79
Stop: 118.87
AMAT is in an uptrend above 4 rising MAs & recently pulled back into the 100-sma. Over 145 could signal a breakout higher. AMAT is also this week’s Chart of the Week.
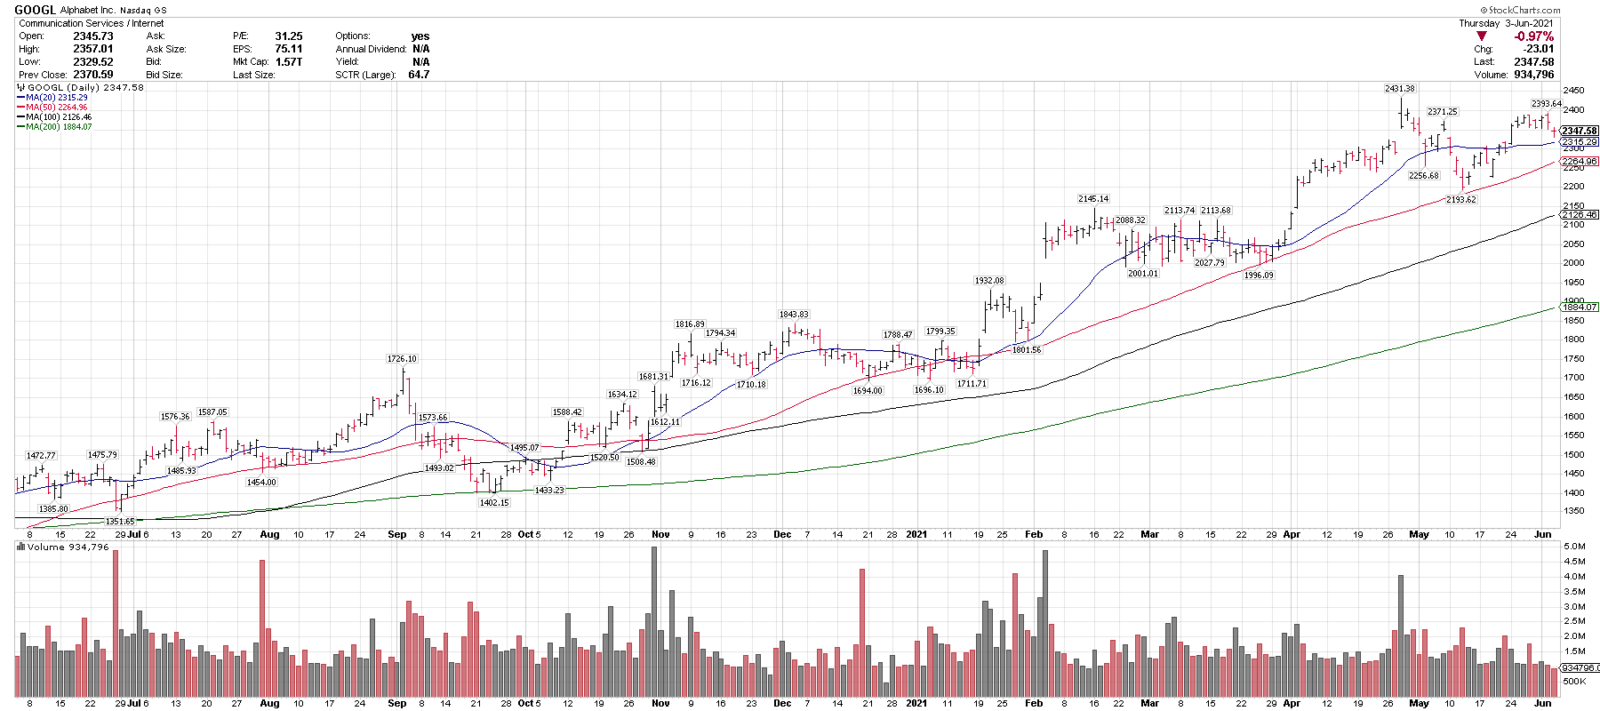
6/4/21
Google, GOOGL
Close: 2347.58
Pre: 2358.22 (+0.45%)
Stop: 1985.44
GOOGL is in an uptrend above 4 rising MAs & recently pulled back 9.7% into the rising 50-sma. 2200 is near term support and 2000-2100 below. Over 2450 could signal a breakout higher. On the top 25 list.
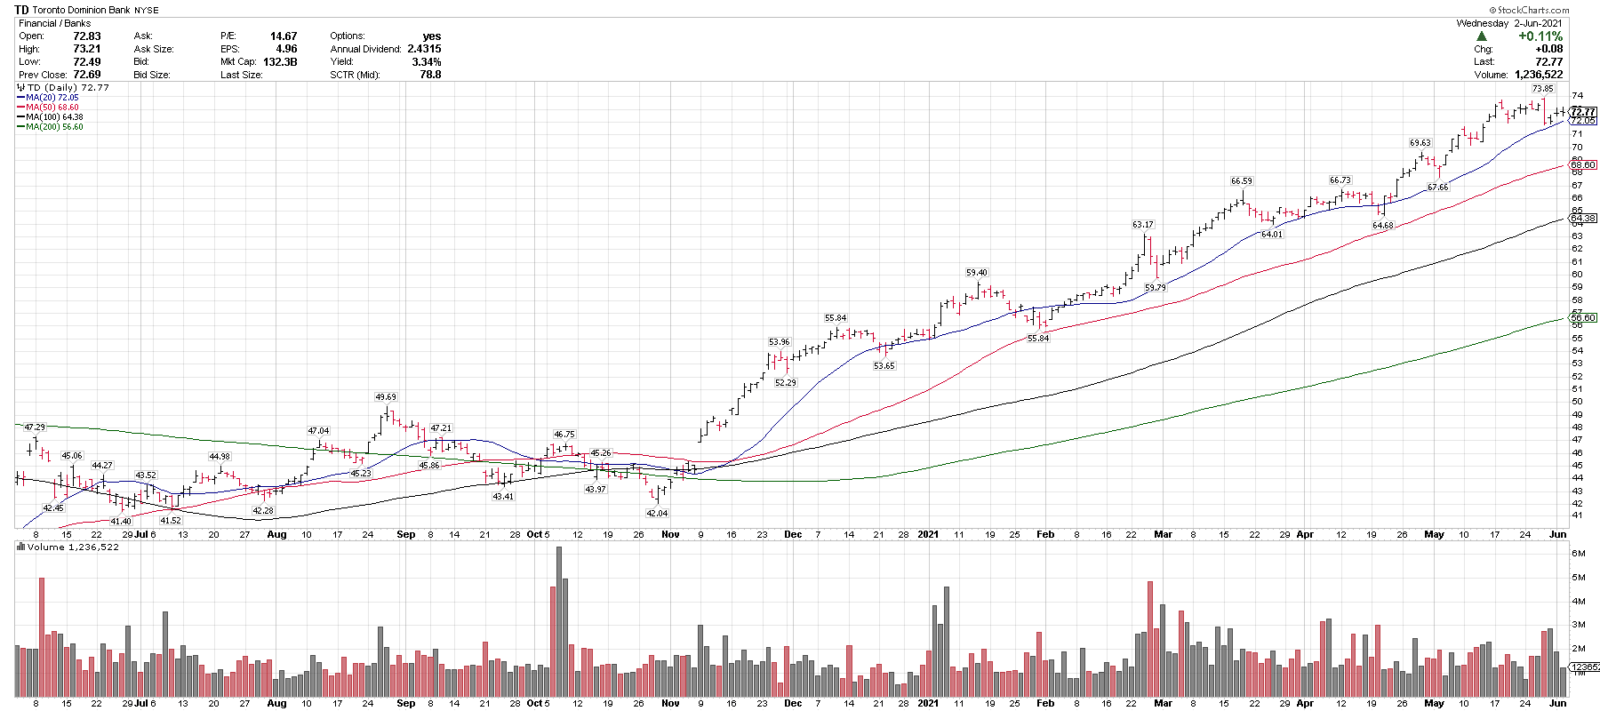
6/3/21
Toronto Dominion Bank, TD
Close: 72.77
Pre: 72.50
Stop: 63.30
TD is in an uptrend above 4 rising MAs & has held above the 50-sma since Nov. 68-70 is support and over 74 could signal a breakout higher.
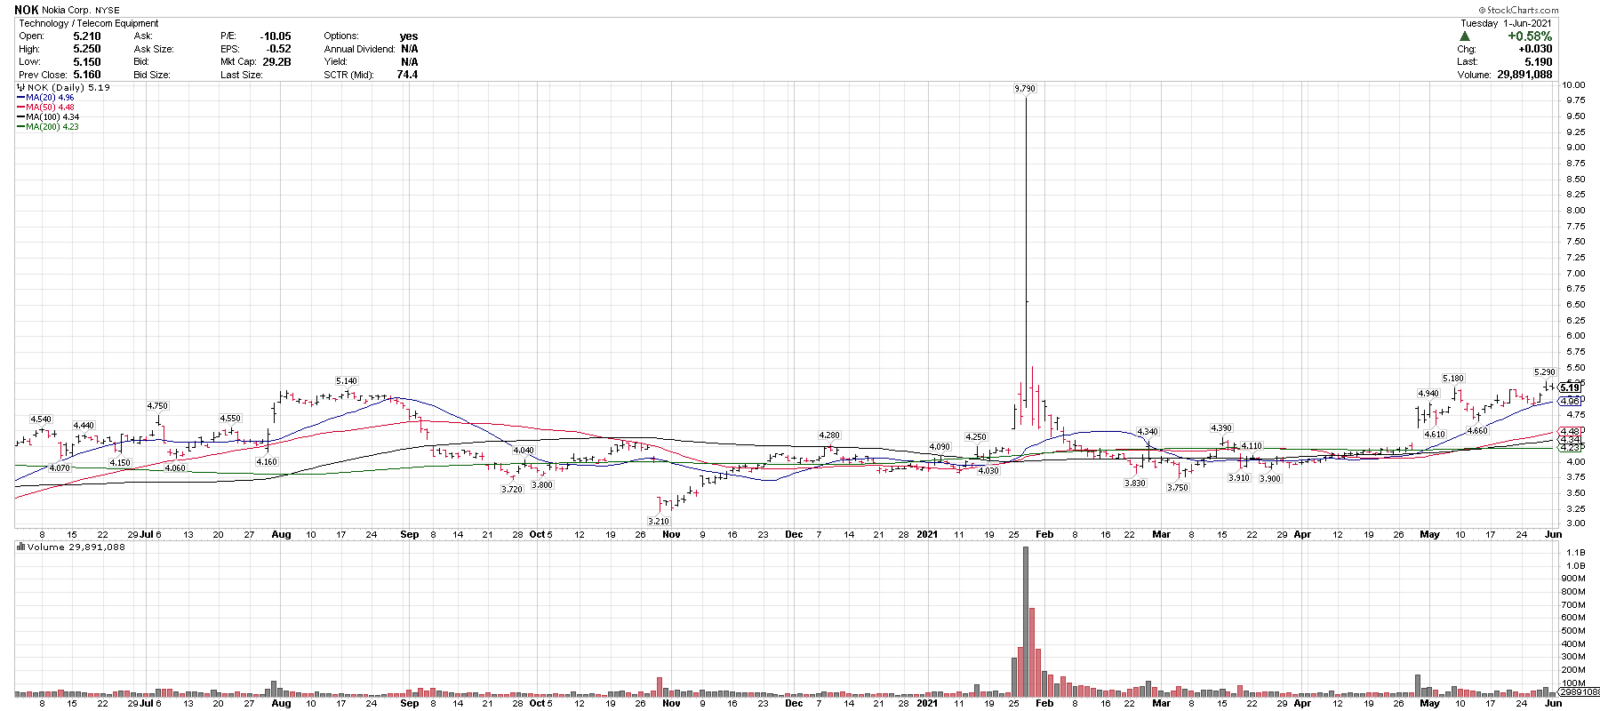
6/2/21
Nokia, NOK
Close: 5.19
Pre: 5.26
Stop: 4.41
NOK is in an uptrend above 4 rising MAs and recently pulled back 4.4% into the rising 20-sma. 4.60 & 4.90 are key support levels. On this week’s Top 25 list.
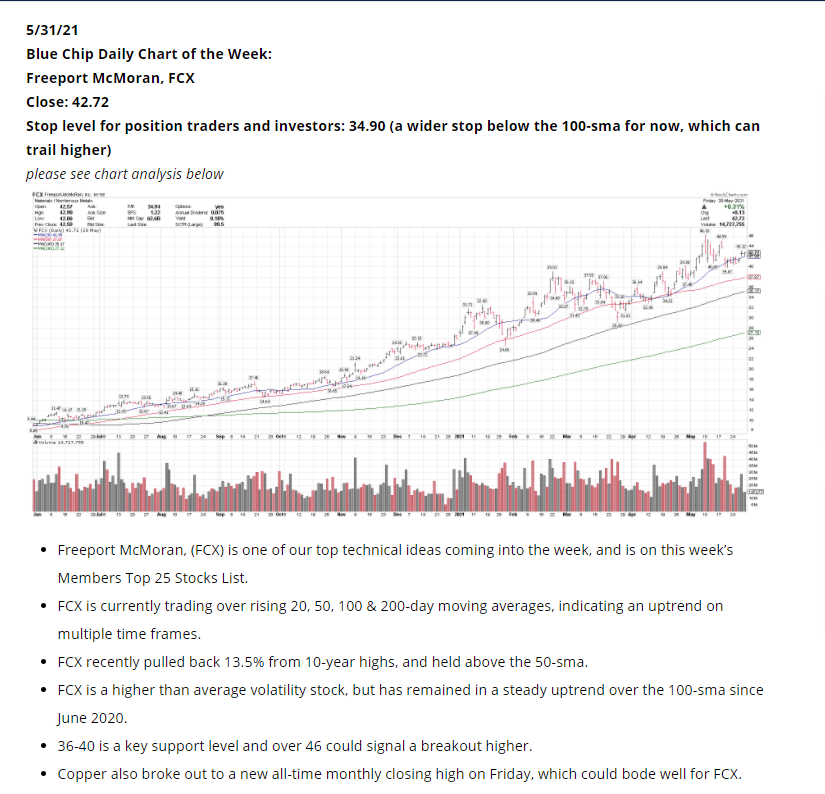
6/1/21
Freeport McMoran, FCX (also the Chart of the Week)
Close: 42.72
Pre: 43.65
Stop: 34.90
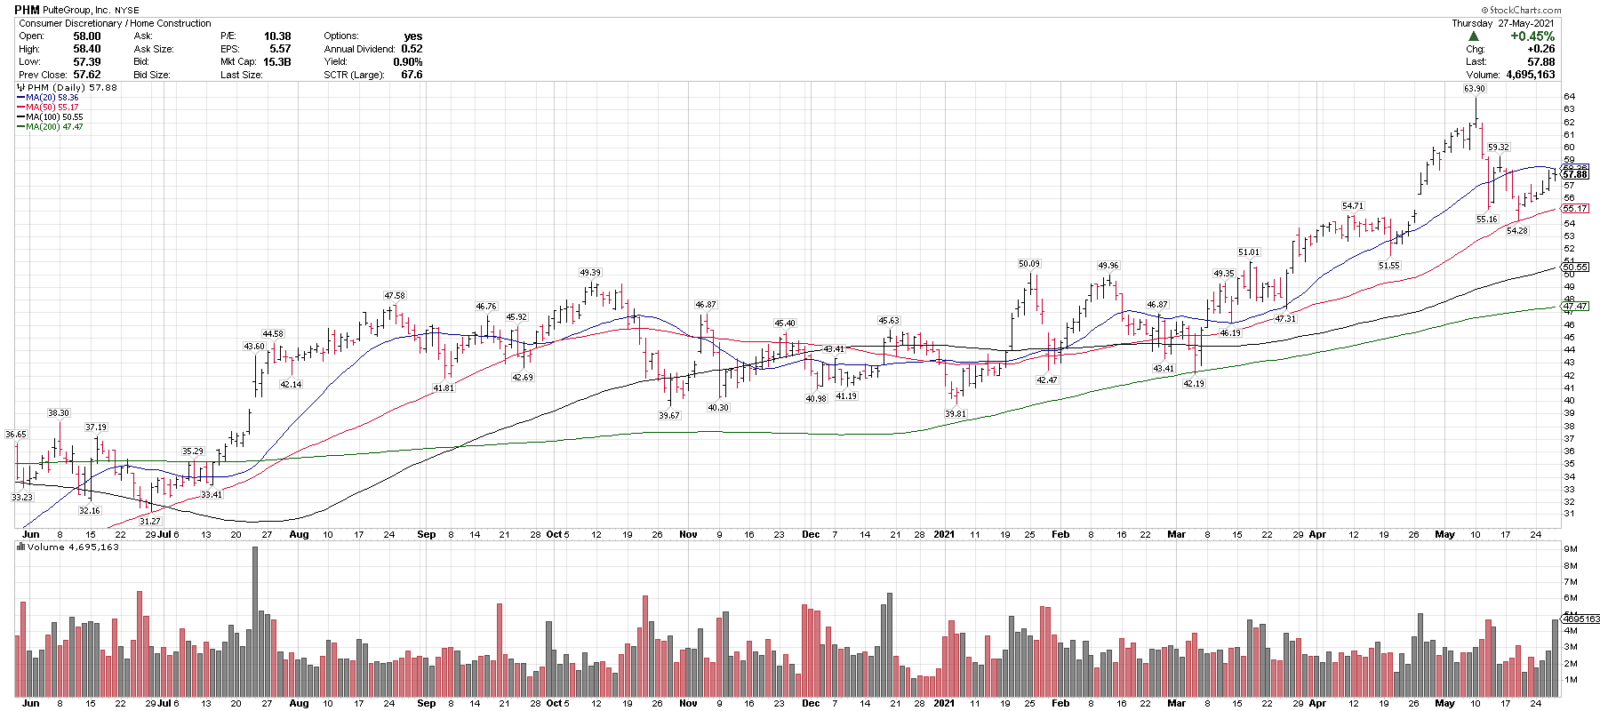
5/28/21
Pulte Group, PHM
Close: 57.88
Pre: 57.20
Stop: 48.61
PHM is in an uptrend above 3 rising MAs & recently pulled back 15.0% off of new highs into the rising 50-sma. 51-55 is key support.
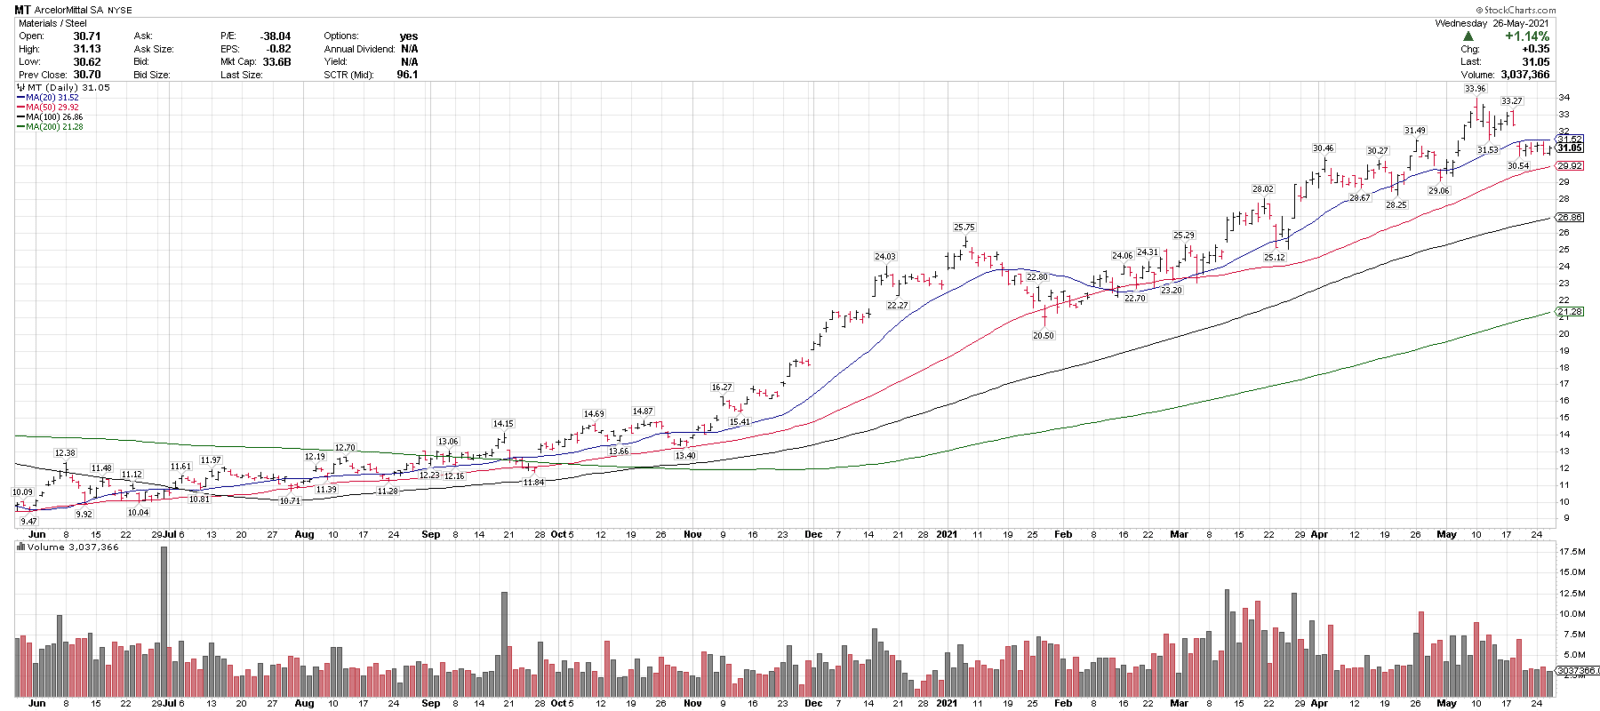
5/27/21
ArcelorMittal, MT
Close: 31.05
Pre: 31.77
Stop: 25.77
MT is in an uptrend above 3 rising MAs & recently pulled back 10% off of 35-months highs. 28-30 is support, over 34 could signal a breakout. XME is the ETF alternative for this group.
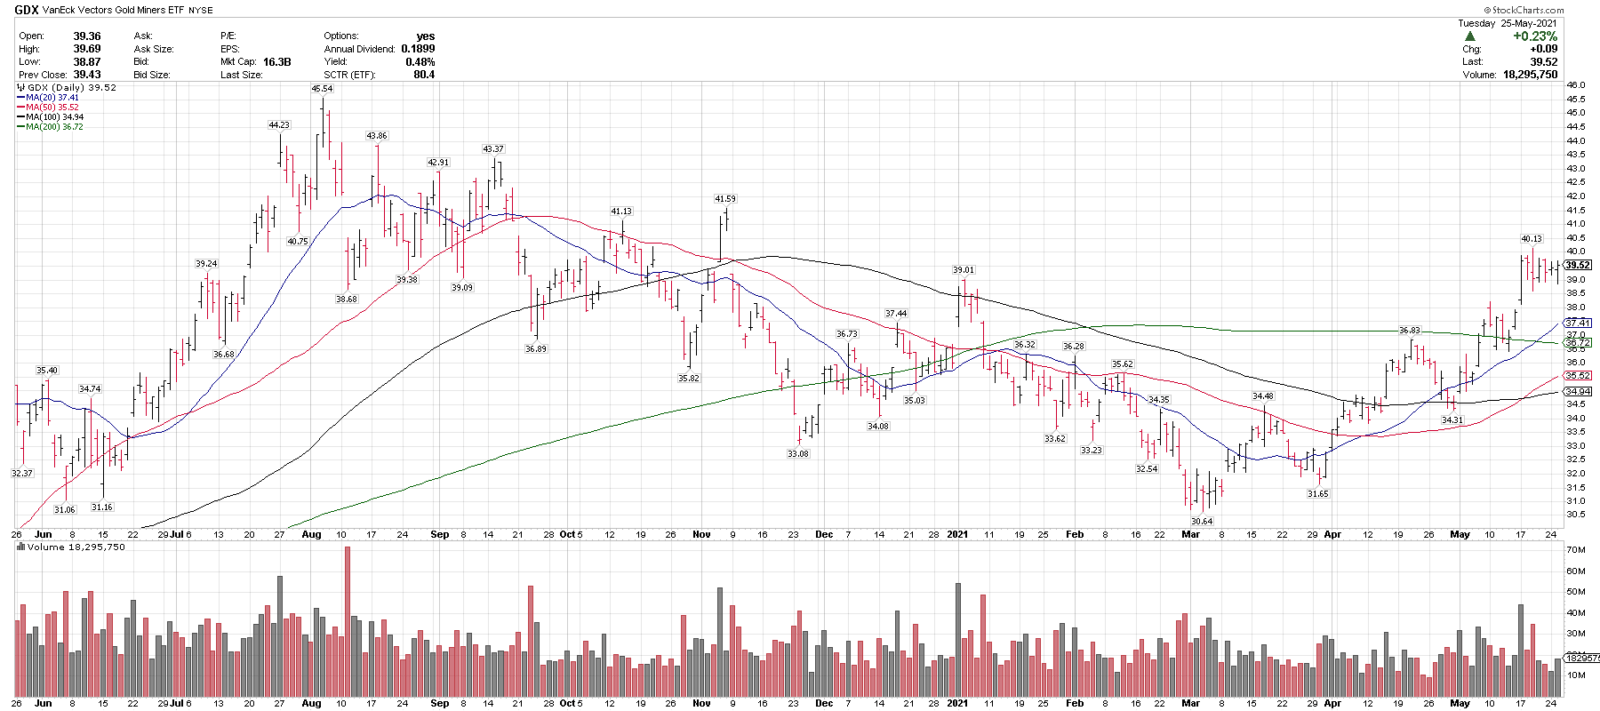
5/26/21
Gold Miners ETF, GDX
Close: 39.52
Pre: 39.75
Stop: 33.59
GDX is consolidating in a near-term uptrend over 3 rising MAs & recently cleared the 200-sma. It has been rising on increasing volume & is holding a recent test of 6 month highs. GDX has been on the high beta list since 4/8. https://twitter.com/BlueChipPremium/status/1380230860969017348
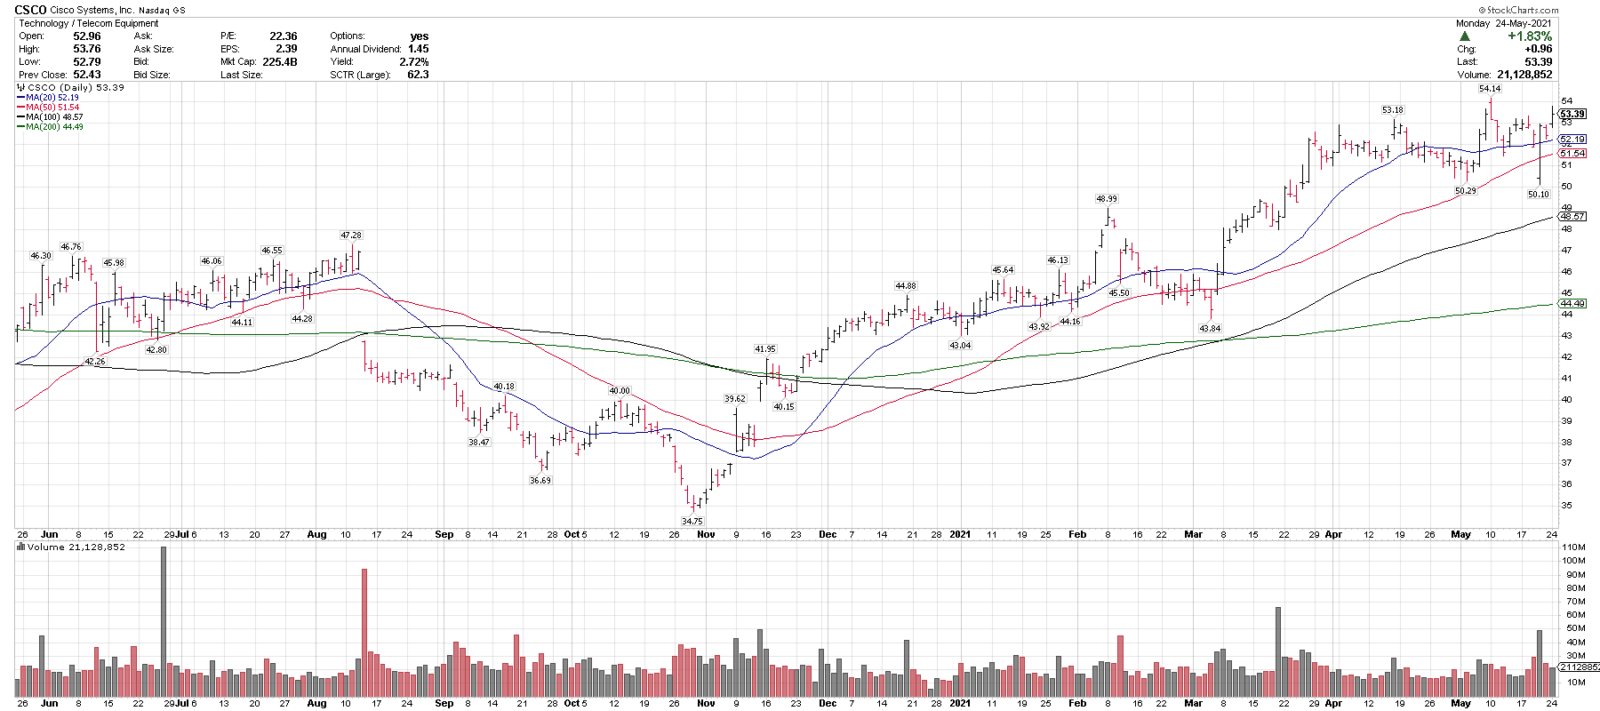
5/25/21
Cisco Systems, (CSCO)
Close: 53.39
Pre: 53.52
Stop: 44.84
CSCO is in an uptrend above 4 rising MAs & recently pulled back 7.4% off of 21-months highs. 50 & 46 are key support levels and over 54 could signal a breakout higher.
5/24/21
Dow Holdings, (DOW)
5/21/21
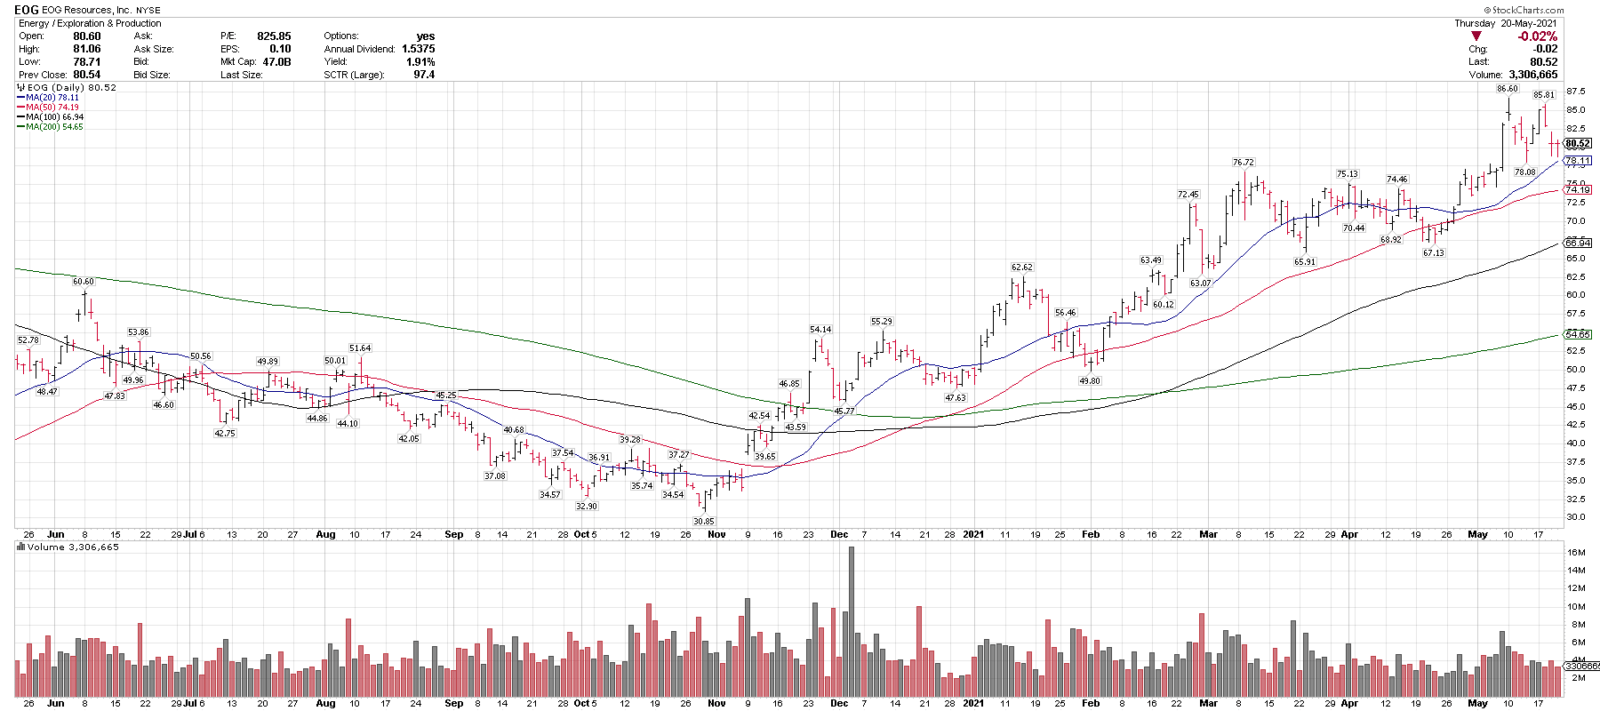
EOG Resources, (EOG)
Close: 80.52
Pre: 81.51
Stop: 66.74
EOG is in an uptrend above 4 rising MAs & recently pulled back 9.8% off of 22-month highs. 70-75 is support & over 87.50 could signal a breakout higher.
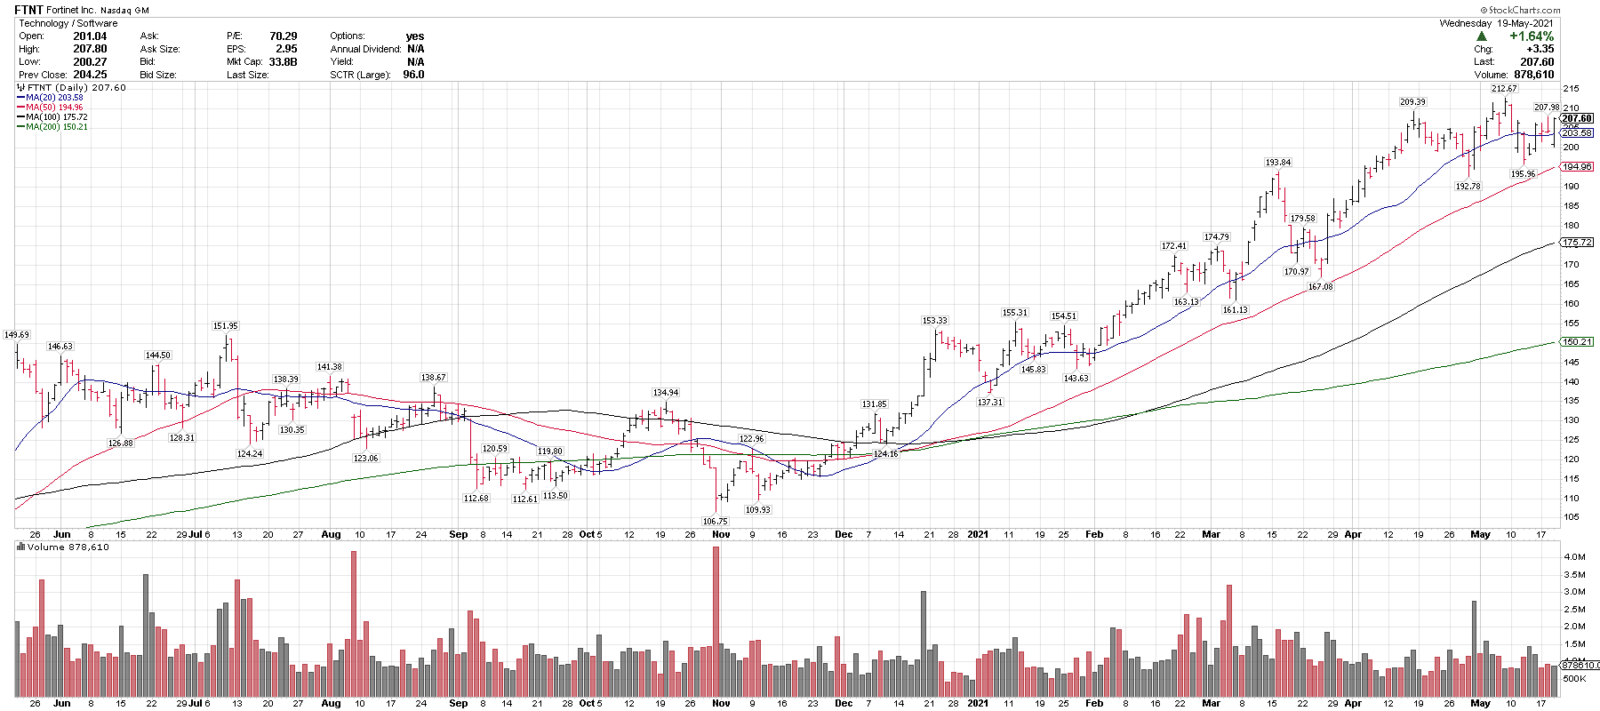
5/20/21
Fortinet, (FTNT)
Close: 207.60
Pre: 210.00 (+1.16%, on 132 shares)
Stop: 174.46
FTNT is trading in an uptrend above 4 rising MAs, is leading vs QQQ ytd & recently pulled back 7.8% off of new highs. 190-195 is support, over 215 could signal a breakout.
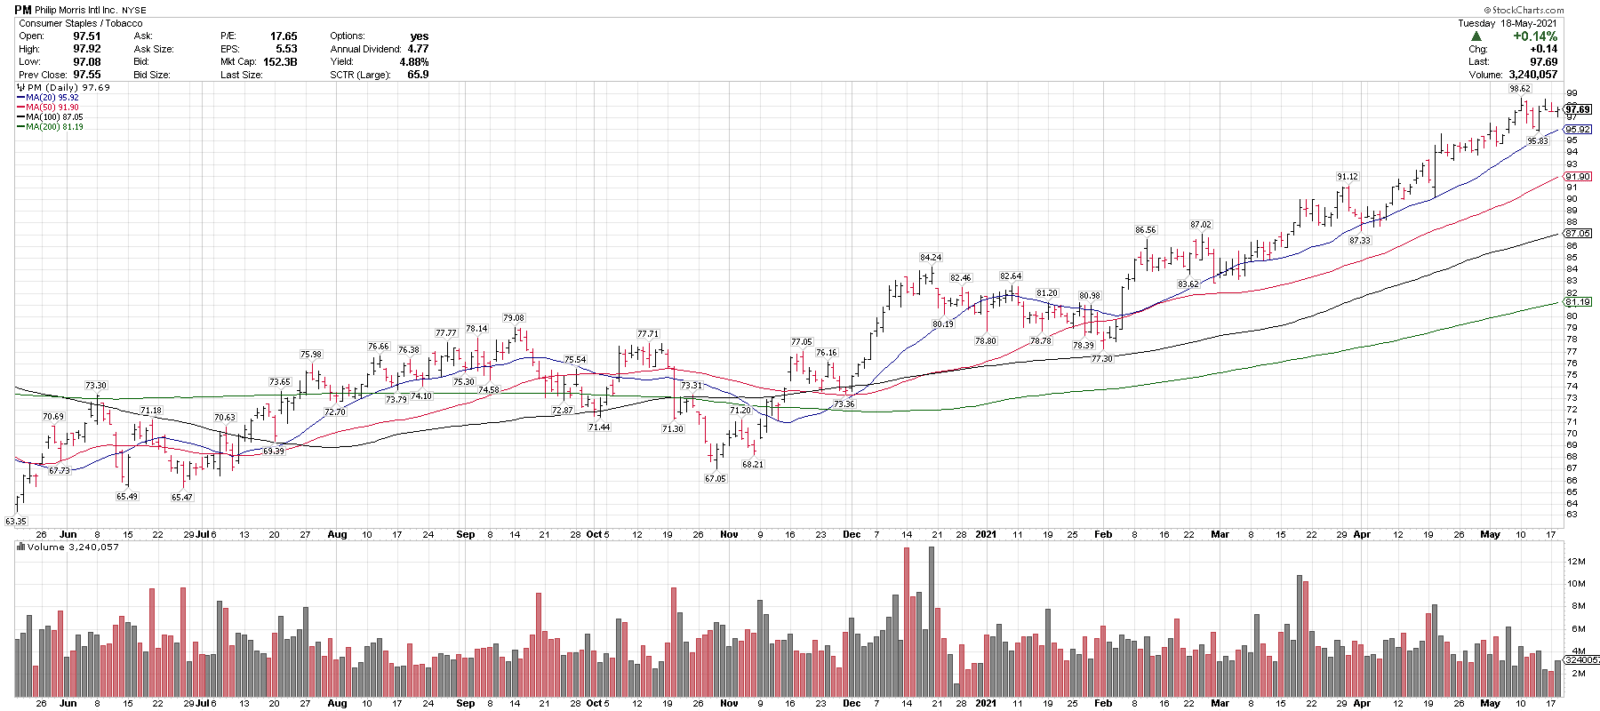
5/19/21
Philip Morris, PM
Close: 97.69
Pre: 97.04
Stop: 85.96
PM is in an uptrend above 4 rising MAs and recently pulled back 2.8% into the 20-sma from a new high. 90-94 is support and over 100 could signal a breakout higher.
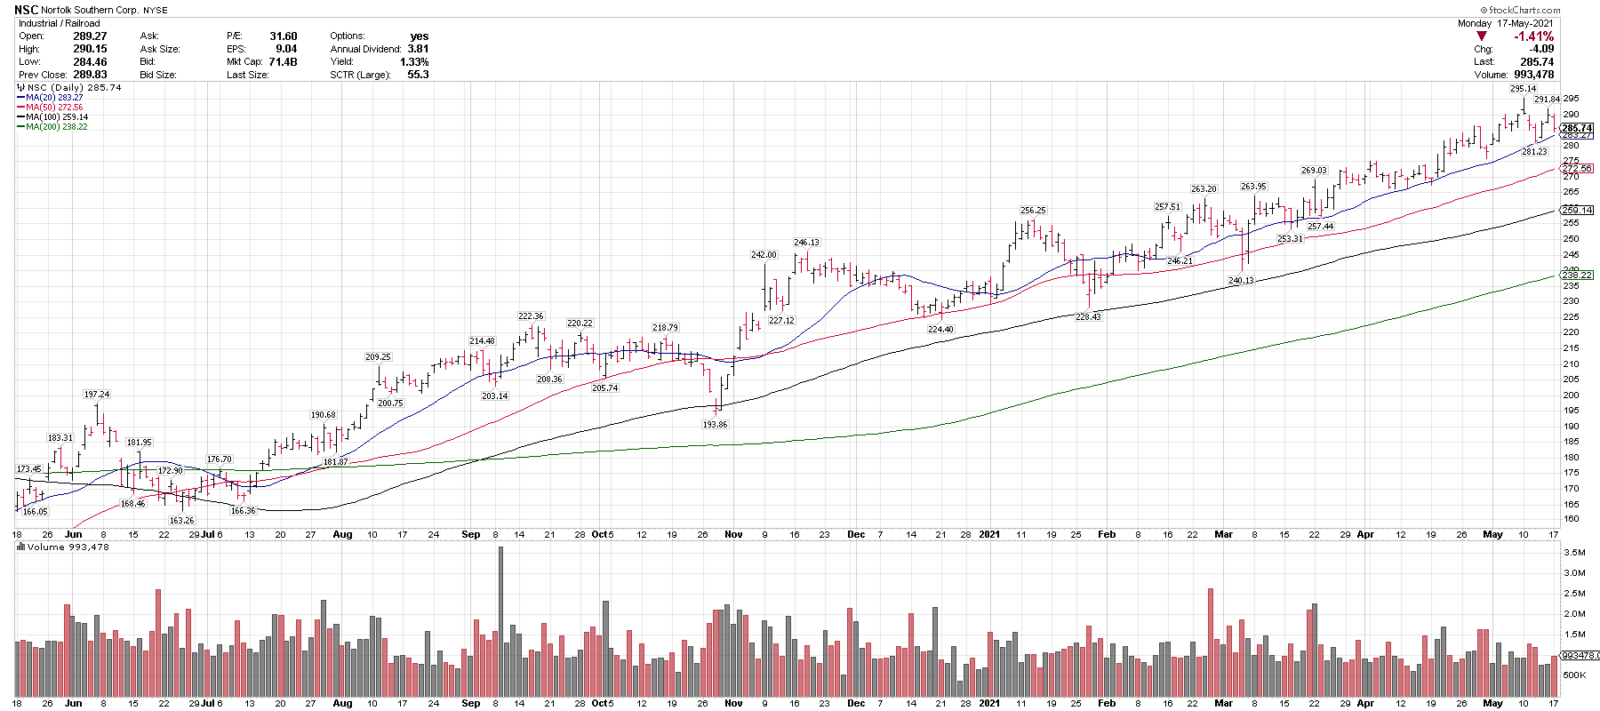
5/18/21
Norfolk Southern, (NSC)
Close/Pre: 285.74
Stop: 242.87
NSC is in an uptrend above 4 rising MAs & recently pulled back 4.7% from new highs. 265-275 is support & over 295 could signal a breakout.
5/17/21
Facebook, (FB)
Close: 315.94
Pre: 314.46
Stop: 268.54
FB is in an uptrend above 4 rising MAs & recently pulled back 10.1% from all-time highs into the rising 50-sma. 295 is support and over 335 could signal a breakout.

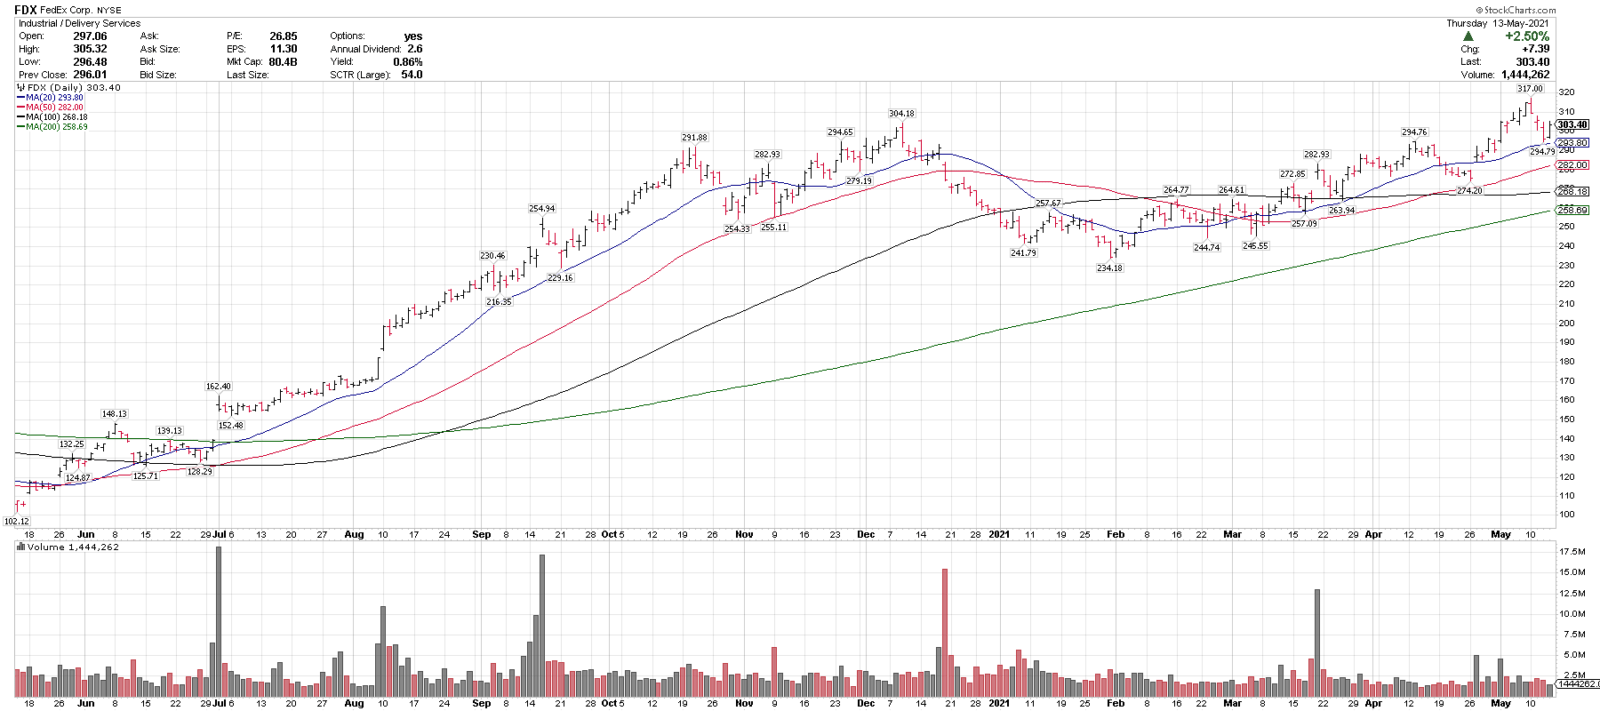
5/14/21
FedEx Corp., (FDX)
Close: 303.40
Pre: 305.00 (+0.53%)
Stop: 257.89
FDX is in an uptrend above 4 rising MAs & recently pulled back 7.0% off new highs into the rising 20-sma. Also a 50% retracement of the 274-317 breakout.
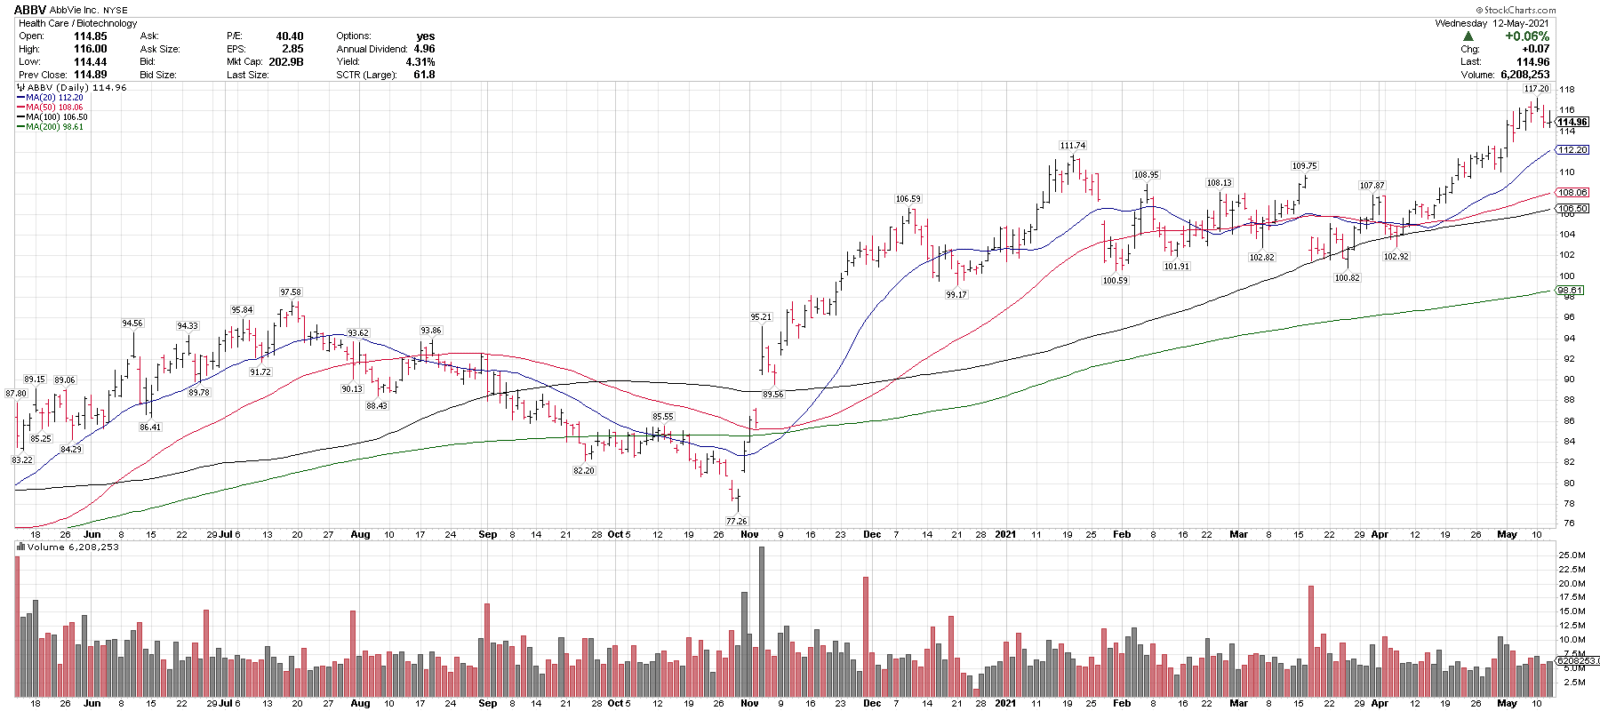
5/13/21
AbbVie, ABBV
Close: 114.96
Pre: 115.00
Stop: 97.71
ABBV is in an uptrend above 4 rising MAs and is consolidating a recent breakout to new highs. 106-112 is a support range and over 118 could signal a breakout higher.
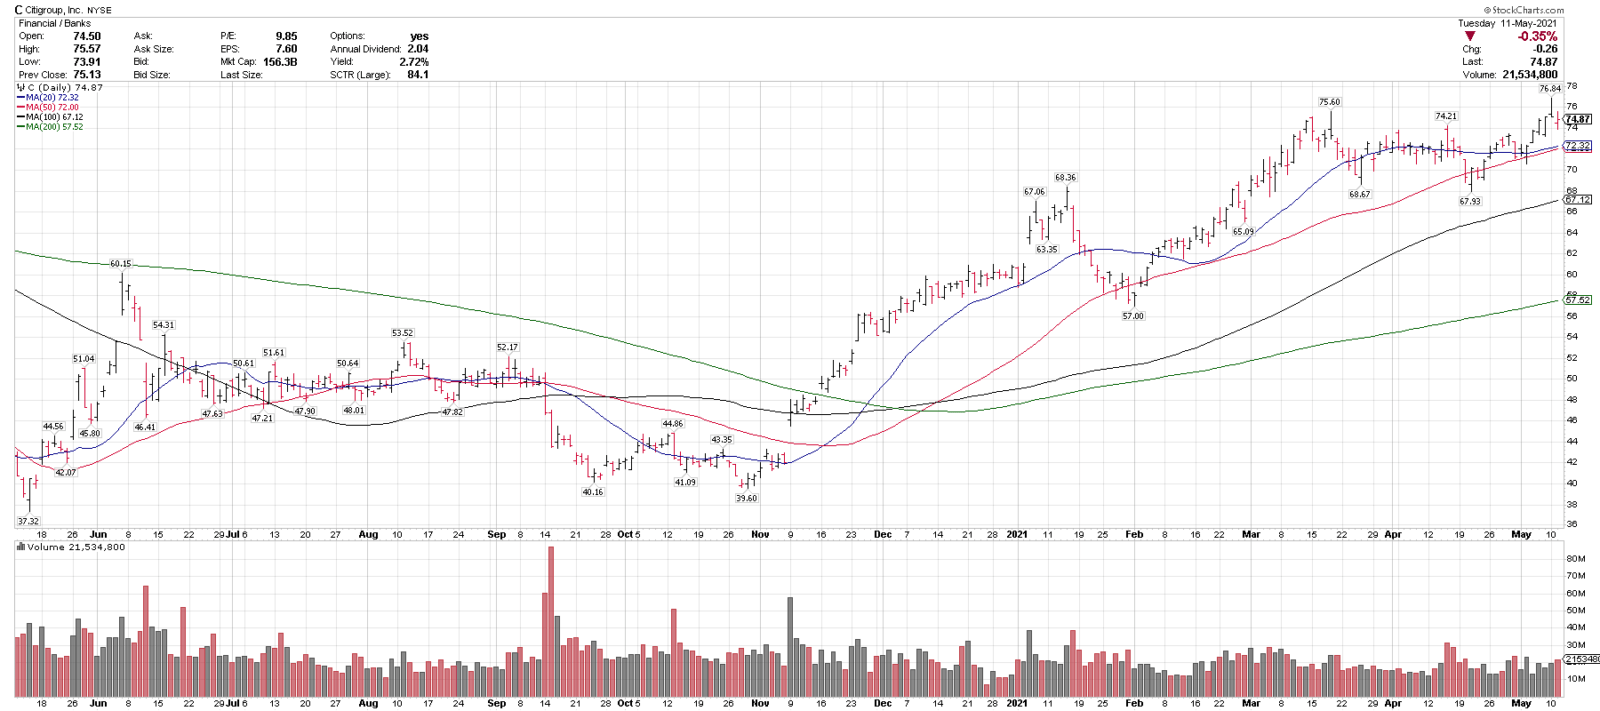
5/12/21
Citigroup, (C)
Close: 74.87
Pre: 75.67
Stop: 63.63
C is in an uptrend above 4 rising MAs and recently made a 15-month high. 68-70 is key support and over 78 – 80 would signal a 12 year breakout.
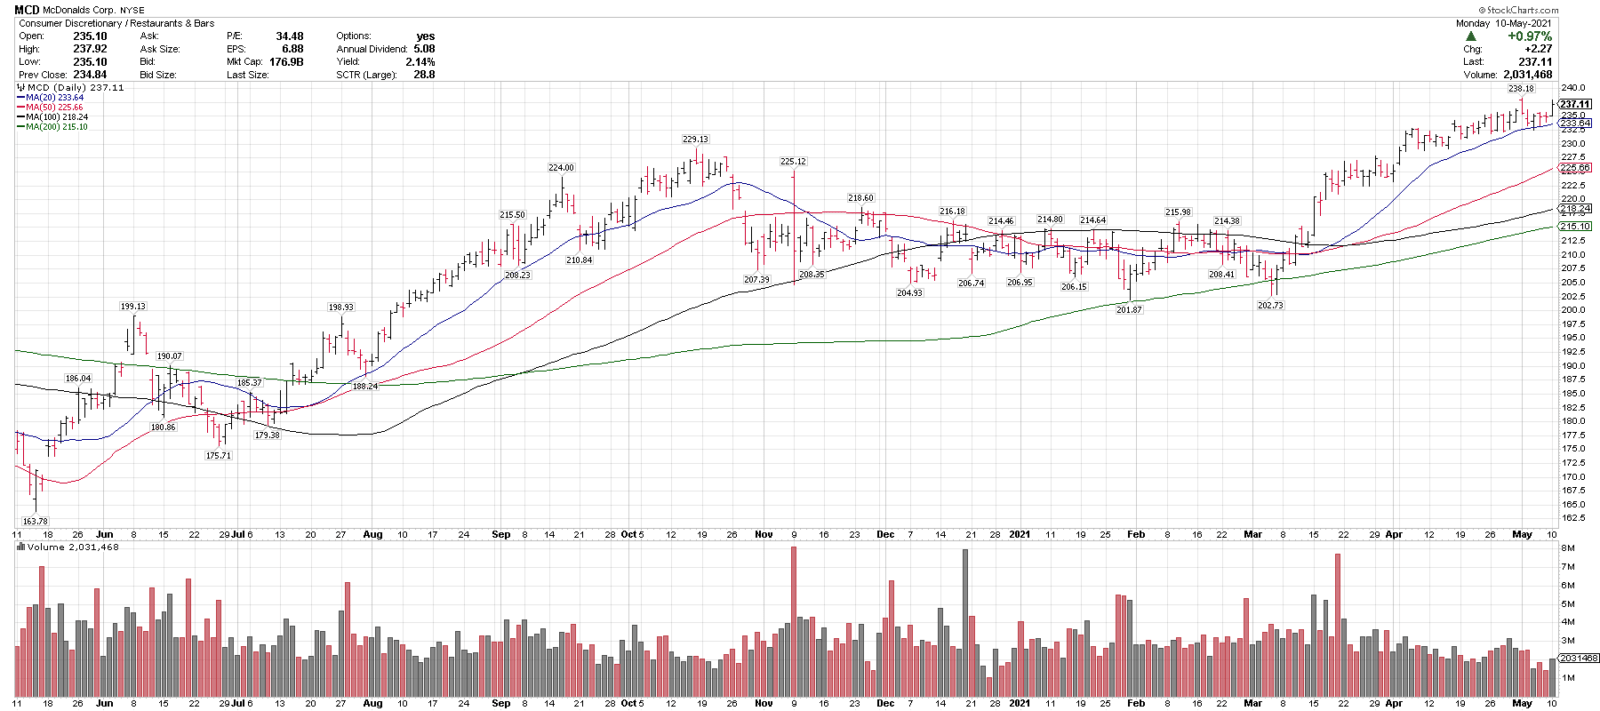
5/11/21
McDonalds, (MCD)
Close: 237.11
Pre: 236.22
Stop: 208.65
MCD is in an uptrend above 4 rising MAs and closed at a new high yesterday. 225-232.50 is a support range and over 240 could signal a breakout.
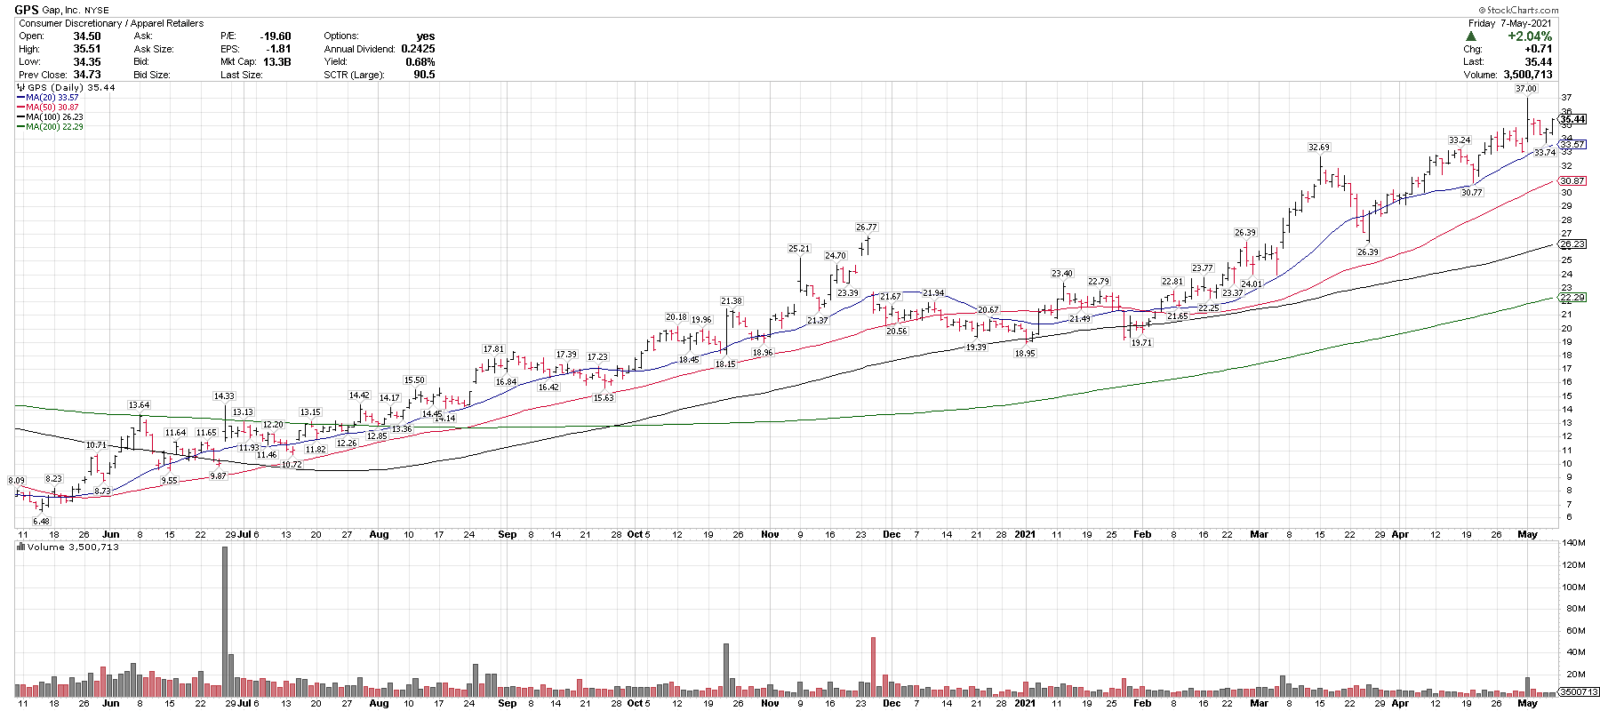
5/10/21
Gap Inc., (GPS)
Close/Pre: 35.44
Stop: 29.76
GPS is in an uptrend above 4 rising MAs and recently pulled back 8.8% off of multi-year highs. 31-33 is support, over 37 could signal a breakout higher.
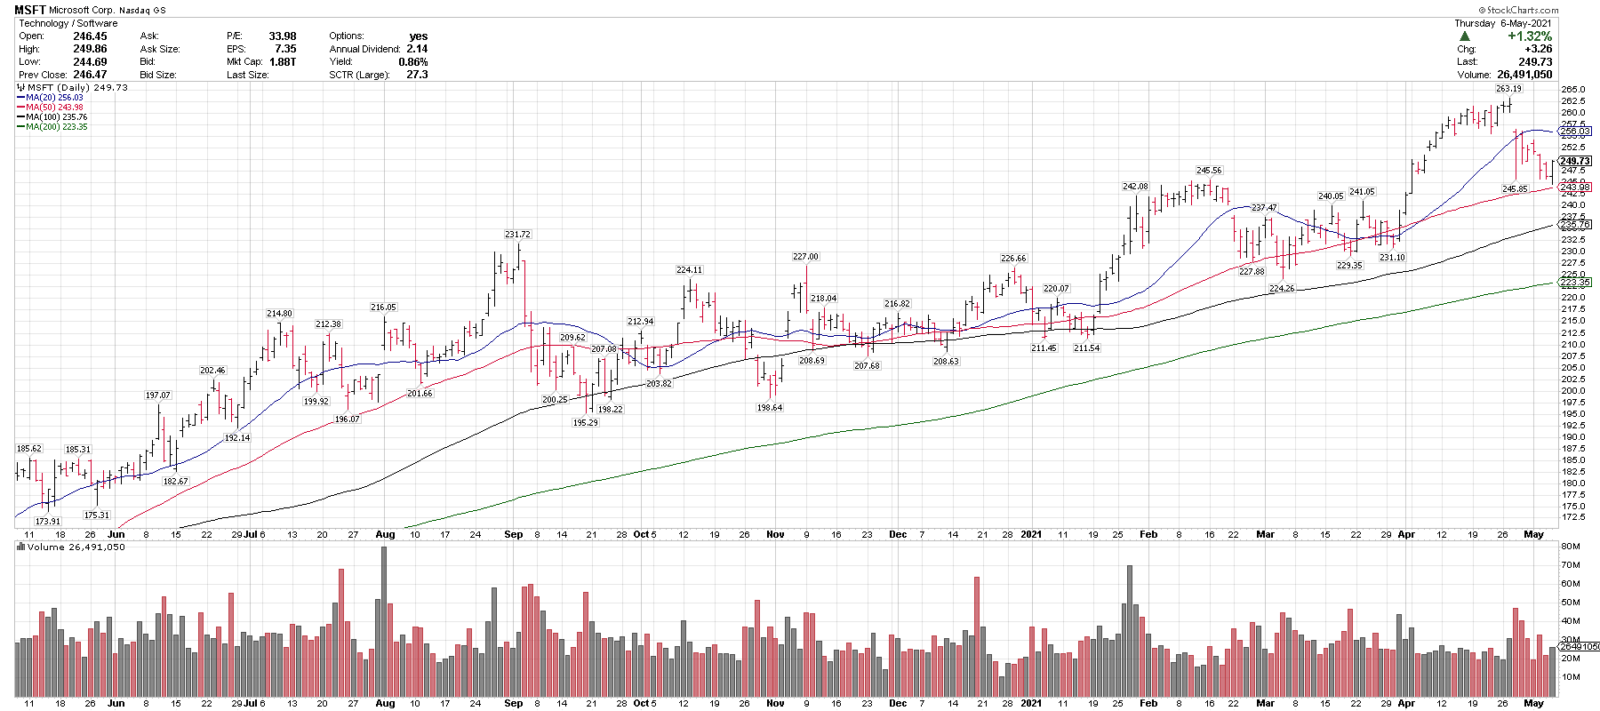
5/7/21
Microsoft, MSFT
Close: 249.73
Pre: 252.76 (+1.21%)
Stop: 219.27
MSFT is in an uptrend above 3 rising MAs and recently pulled back 7.0% from new highs into the rising 50-sma. 245 is key support.
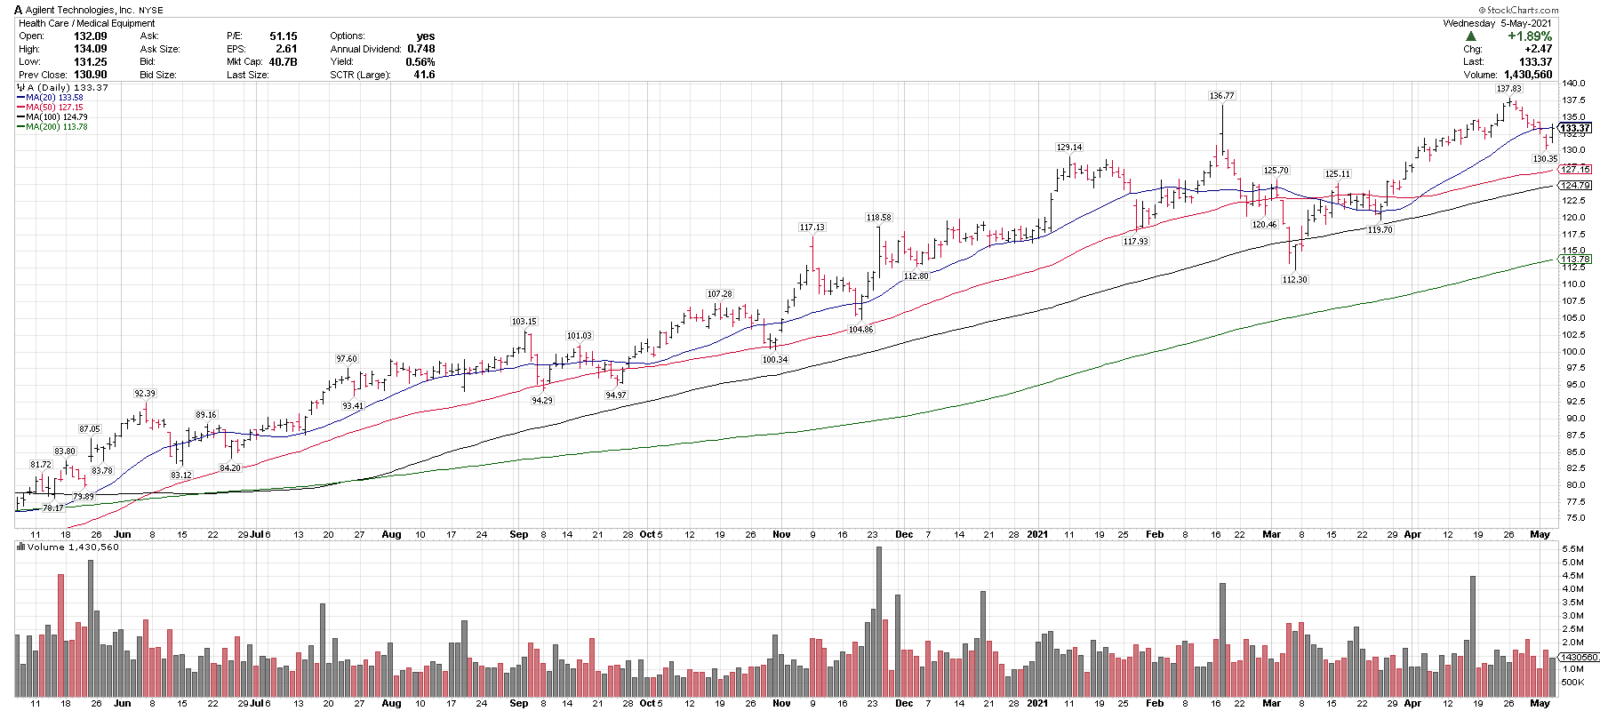
5/6/21
Agilent, (A)
Close/Pre: 133.37
Stop: 113.36
A is in an uptrend above 3 rising MAs, and recently pulled back 5.4% off of new highs. 125-130 is a support level and over 138 could signal a breakout higher.
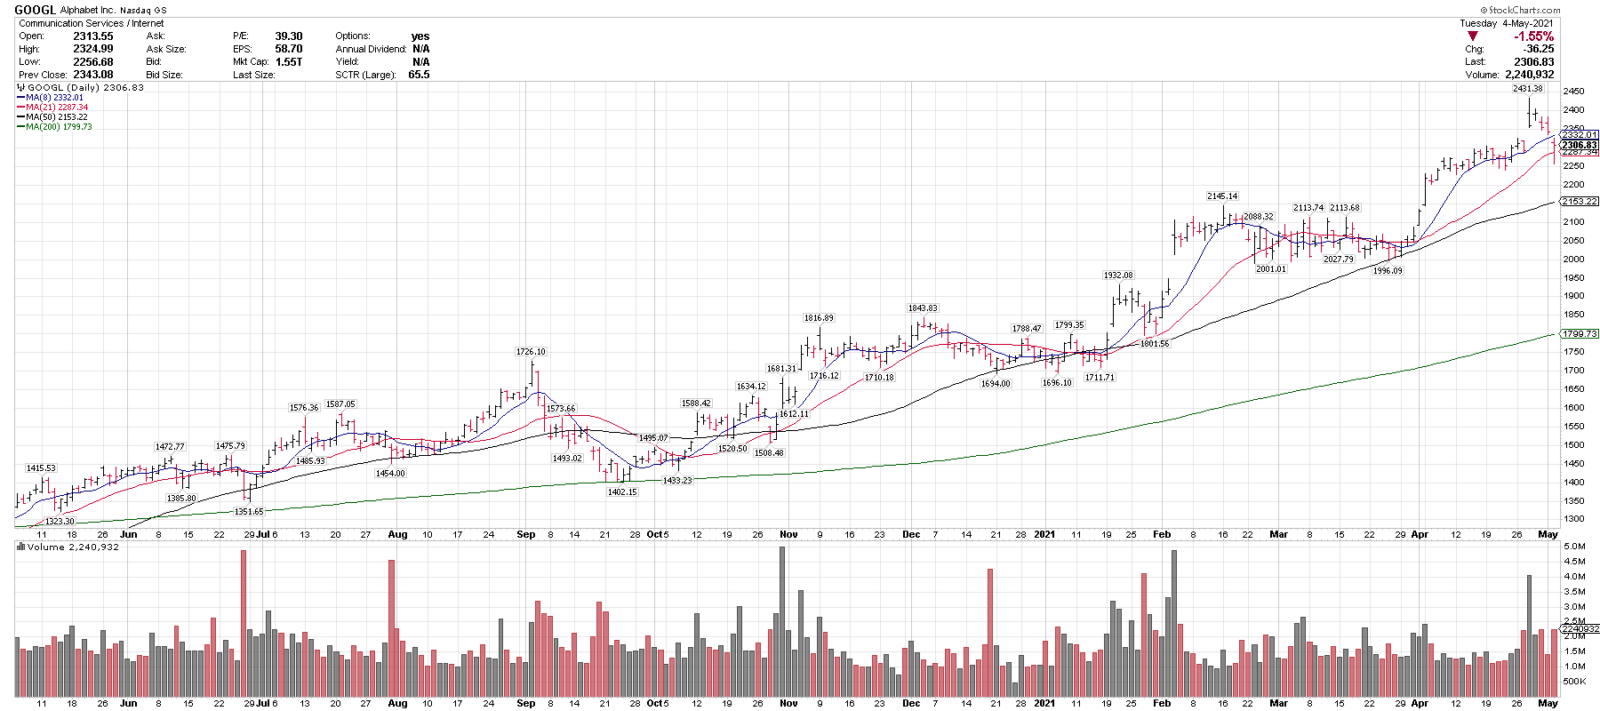
5/5/21
Google, GOOGL
Close: 2306.83
Pre: 2319.15 (+0.53%)
Stop: 1960.80
GOOGL is in an uptrend above 3 rising MAs and recently pulled back 7.1% off all-time highs. 2000-2100 is key support, over 2450 could signal a breakout. This position will likely be correlated to QQQ.
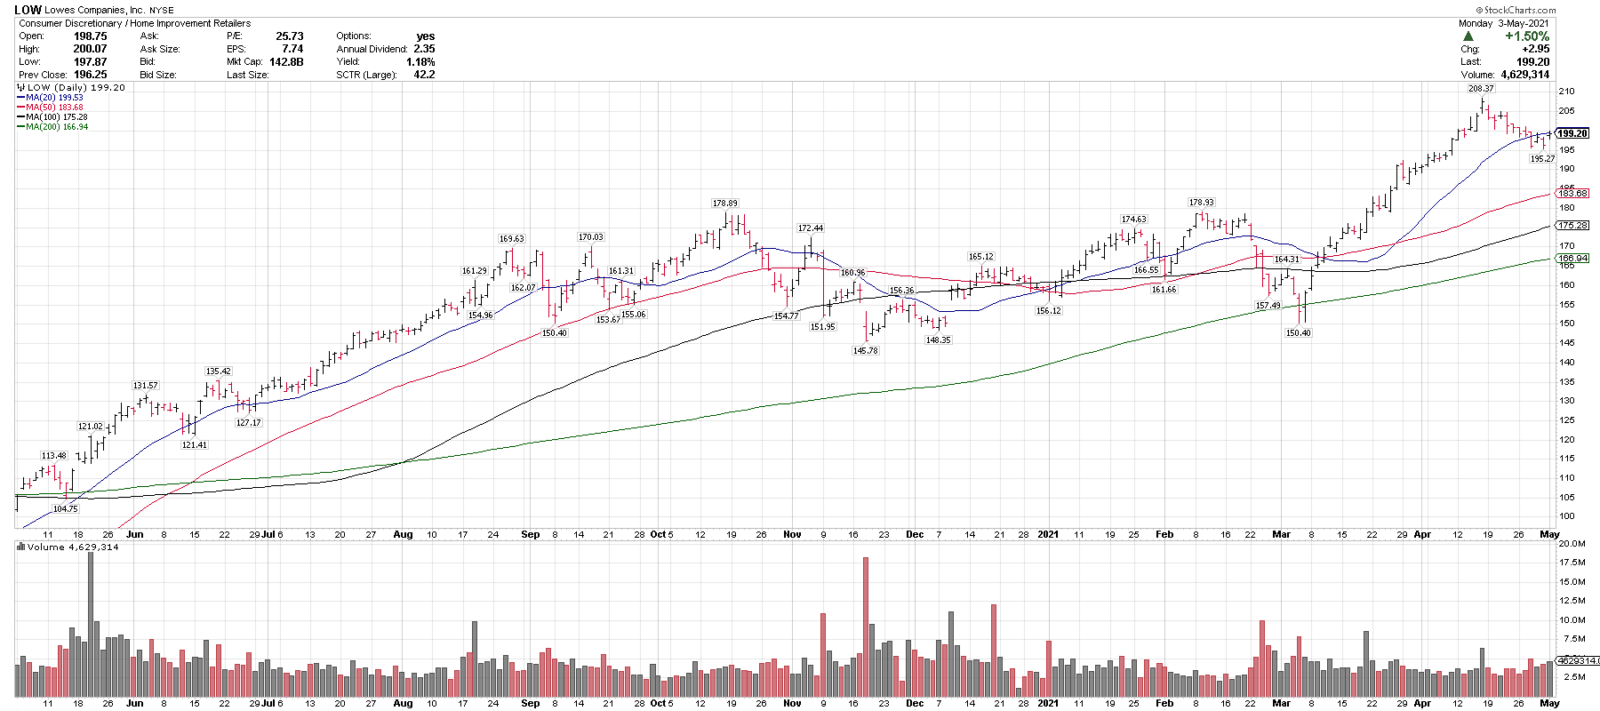
5/4/21
Lowes Companies, LOW
Close: 199.20
Pre: 199.50
Stop: 166.32
LOW is in an uptrend above 3 rising MAs and recently pulled back 6.2% from new highs. 185-195 is a support range and over 210 could signal a breakout higher. The initial stop is just below the rising 200-sma.
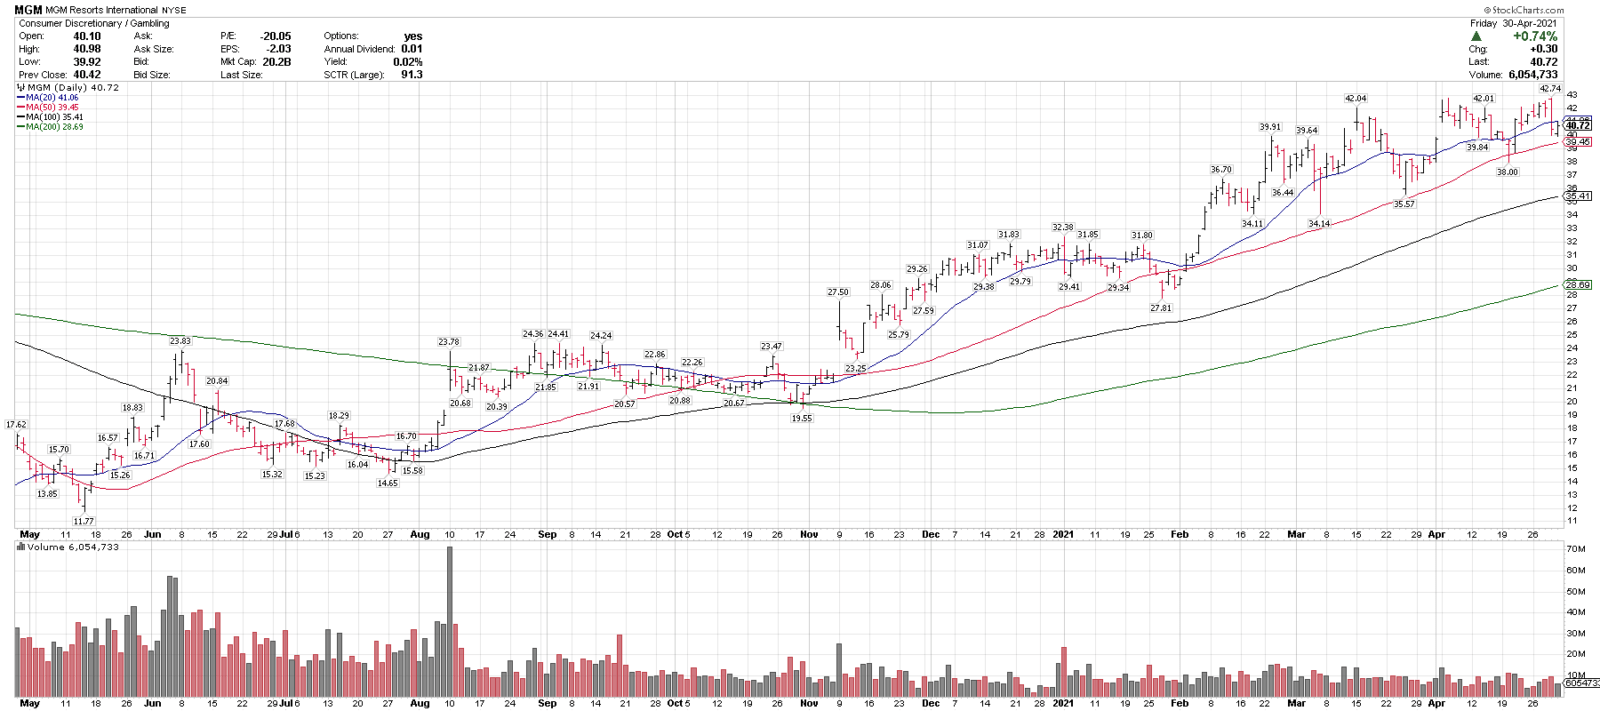
5/3/21
MGM Resorts International, MGM
Close: 40.72
Pre: 41.03
Stop: 34.61
MGM is in an uptrend above a rising 50, 100 & 200-sma and recently pulled back 9.5% into the rising 50-sma. 36-39 is a key support level and over 43 could signal a breakout.
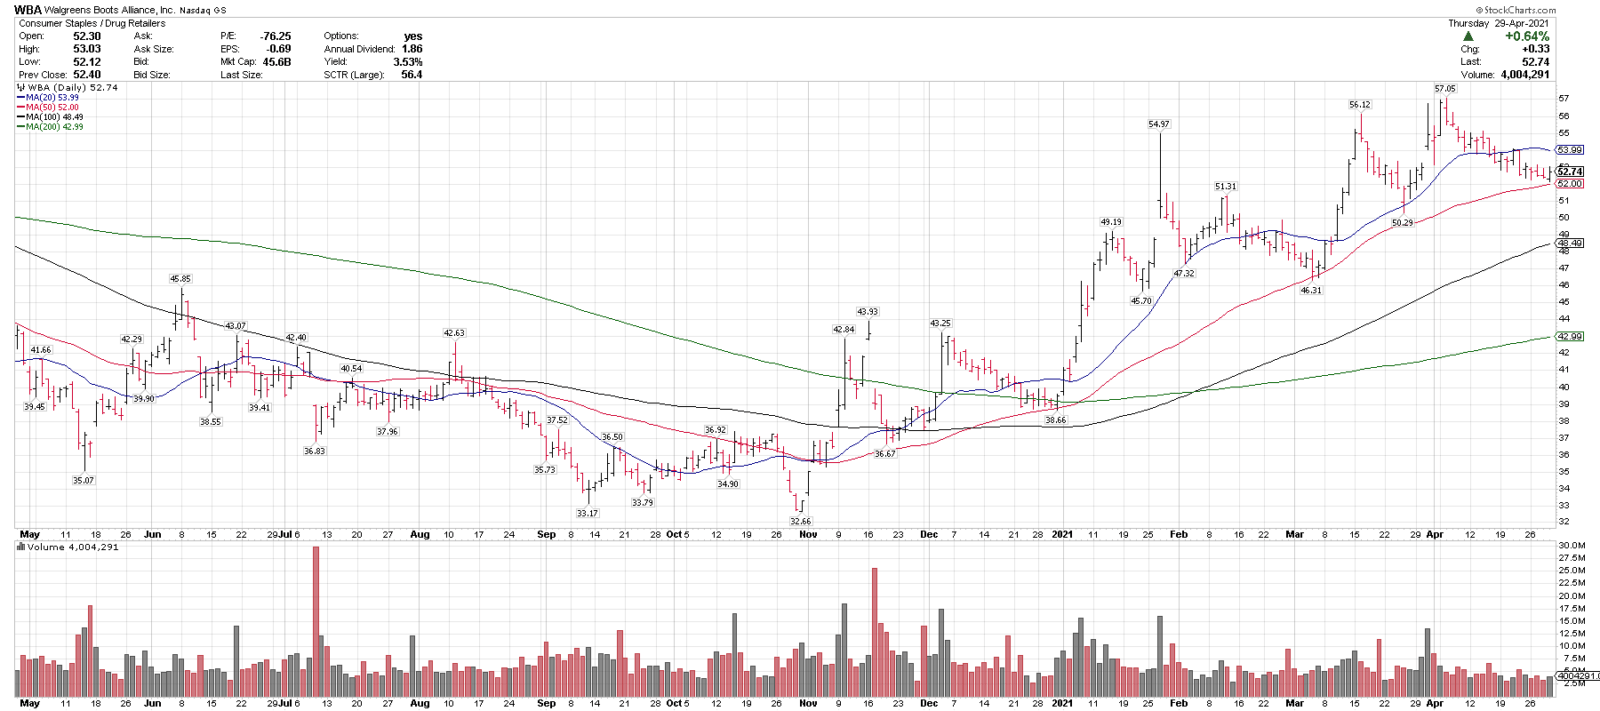
4/30/21
Walgreens Boots Alliance, WBA
Close: 52.74
Pre: 52.55
Stop: 44.82
WBA is in an uptrend above 3 rising MAs and recently pulled back 8.6% from 52-week highs, into the rising 50-sma. 50-52 is support and over 57 could signal a break out higher.
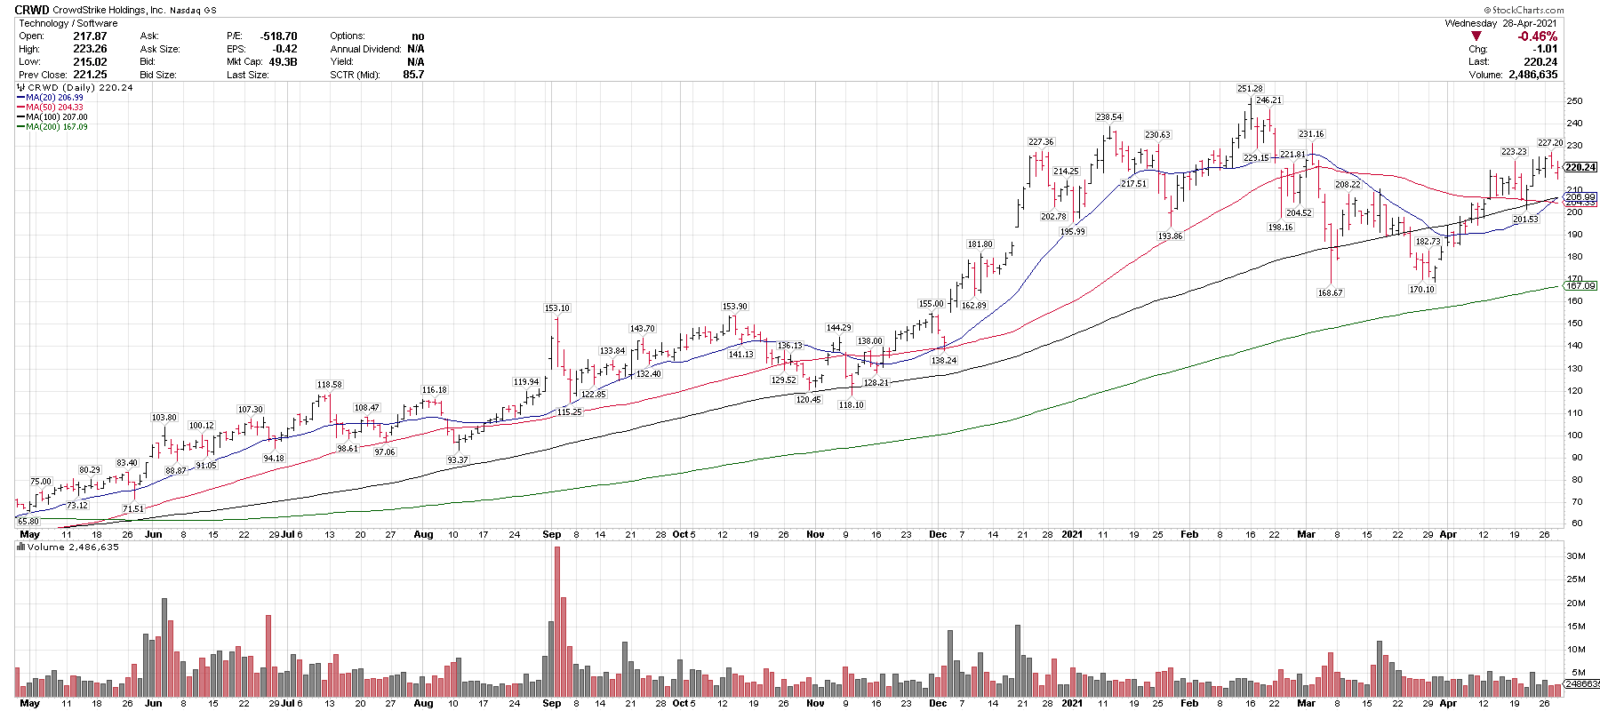
4/29/21
Crowdstrike, CRWD
Close: 220.24
Pre: 222.51
Stop: 182.79
CRWD is an uptrend above 4 MAs, near 50-day highs & just had a bullish 20/50 sma cross. CRWD recently corrected 32.8% off all-time highs. 190-210 is a key support range.
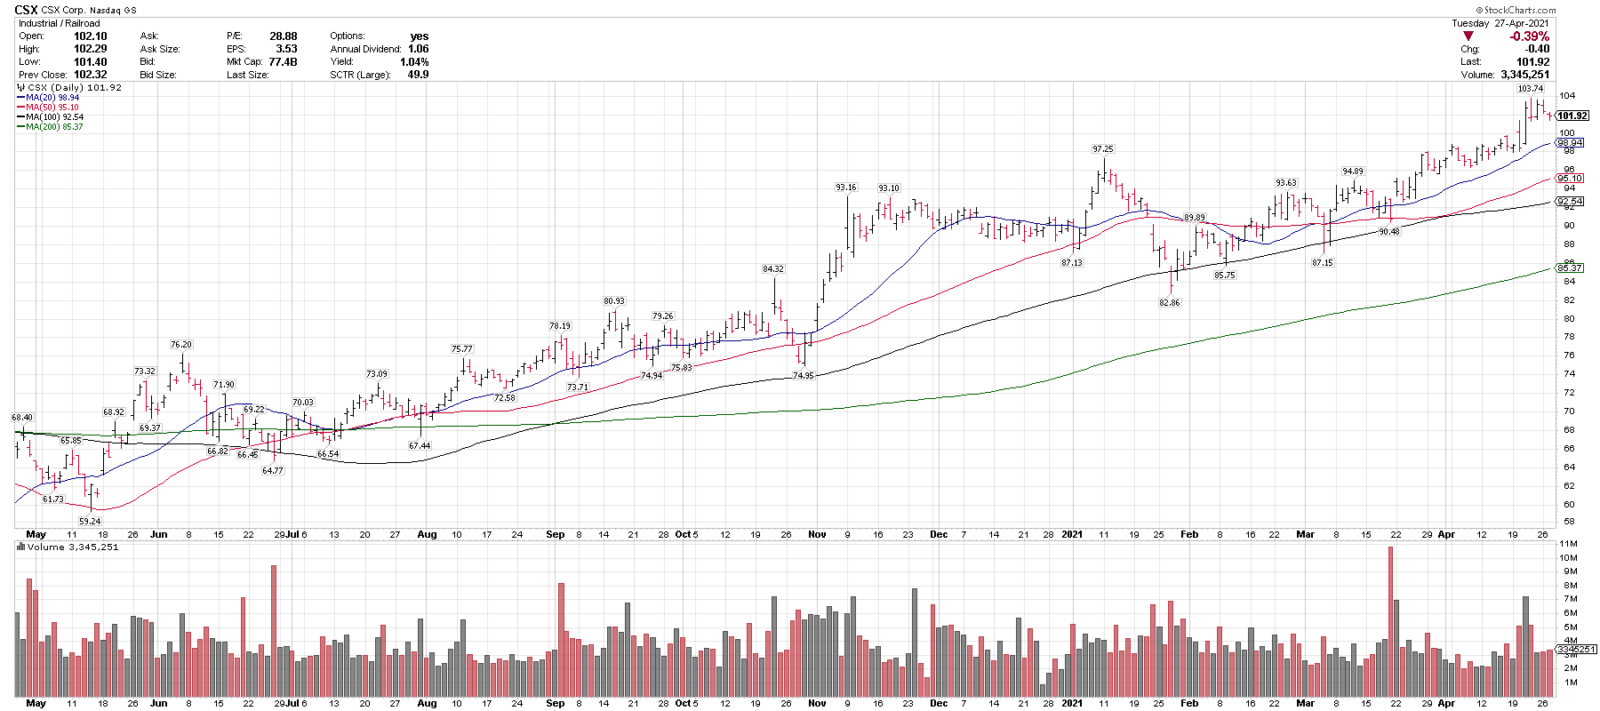
4/28/21
CSX CORP., CSX
Close: 101.92
Stop: 89.68
CSX is in an uptrend above 4 rising MAs and recently broke out to new highs. 92-98 is a key support range, over 104 could signal a breakout.
4/27/21
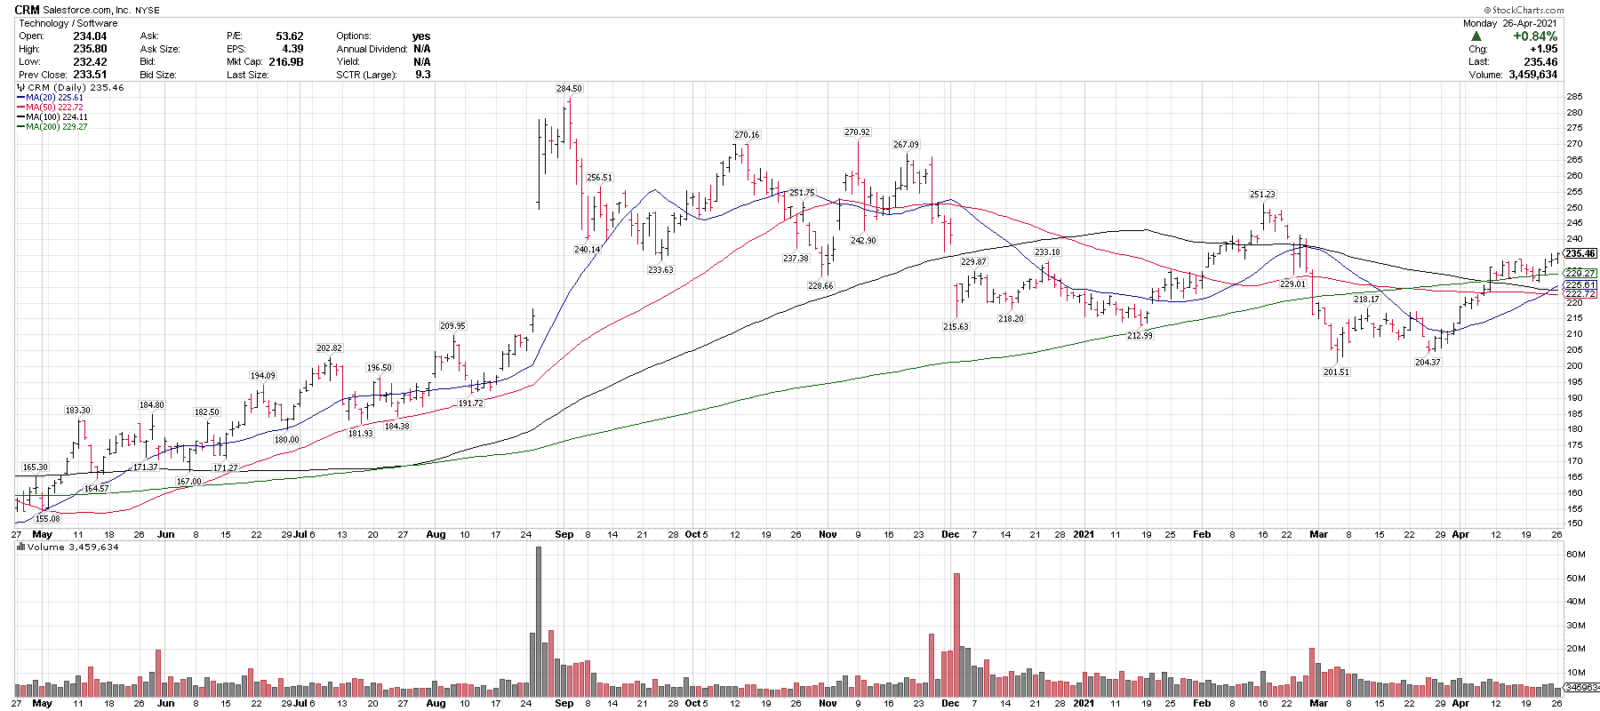
Salesforce.com, CRM
Close: 235.46
Pre: 235.60
Stop: 203.40
CRM is in a near-term uptrend above 4 MAs and recently reclaimed the 200-sma after a 19.7% pullback from Feb highs. 215-230 is a support range.
4/26/21
Freeport-McMoran, FCX
Close: 36.54
Pre: 37.36
Stop: 30.68
FCX is in an uptrend above 4 rising MAs & recently pulled back 12.3% into the rising 50-sma. 31-34 is support, over 40 could signal a breakout.
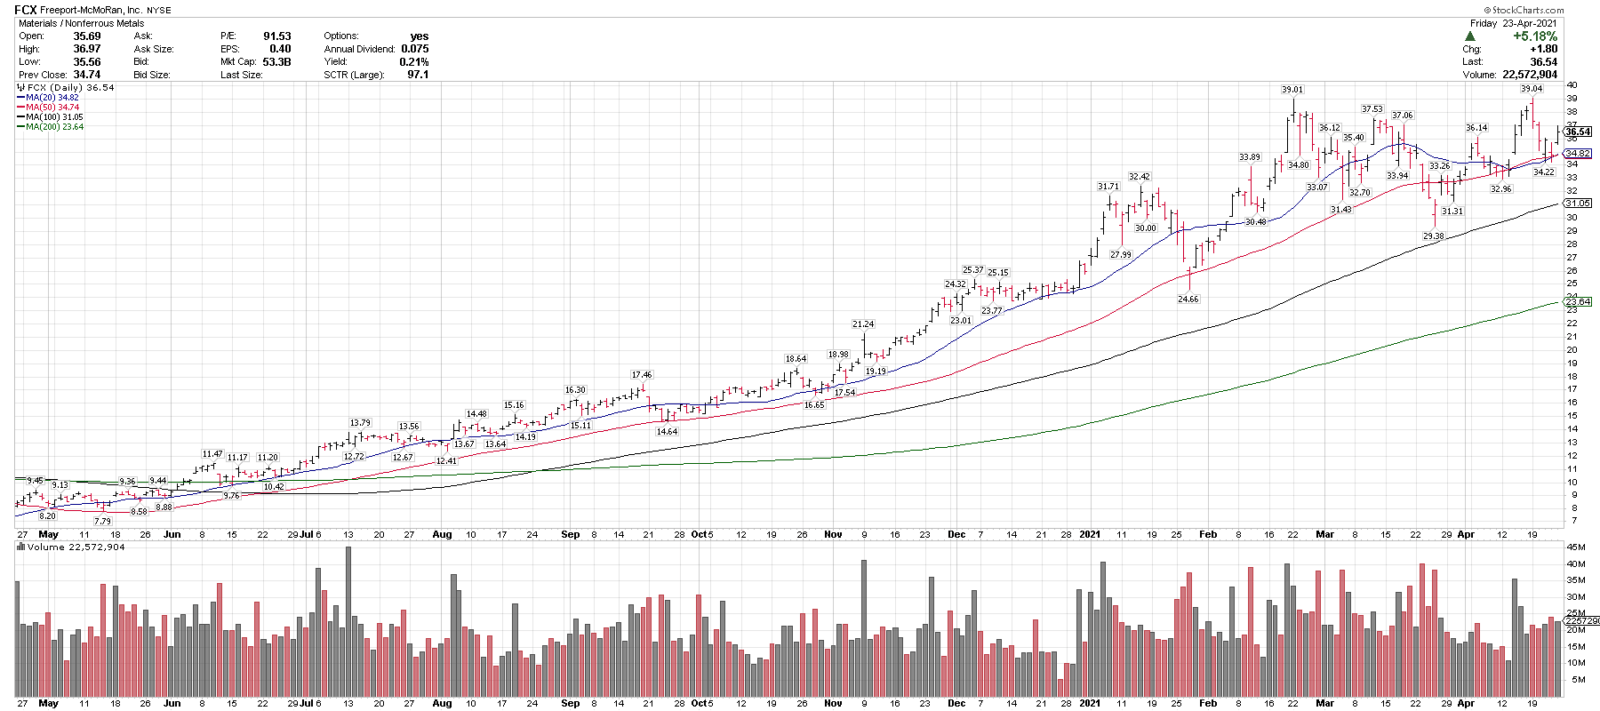
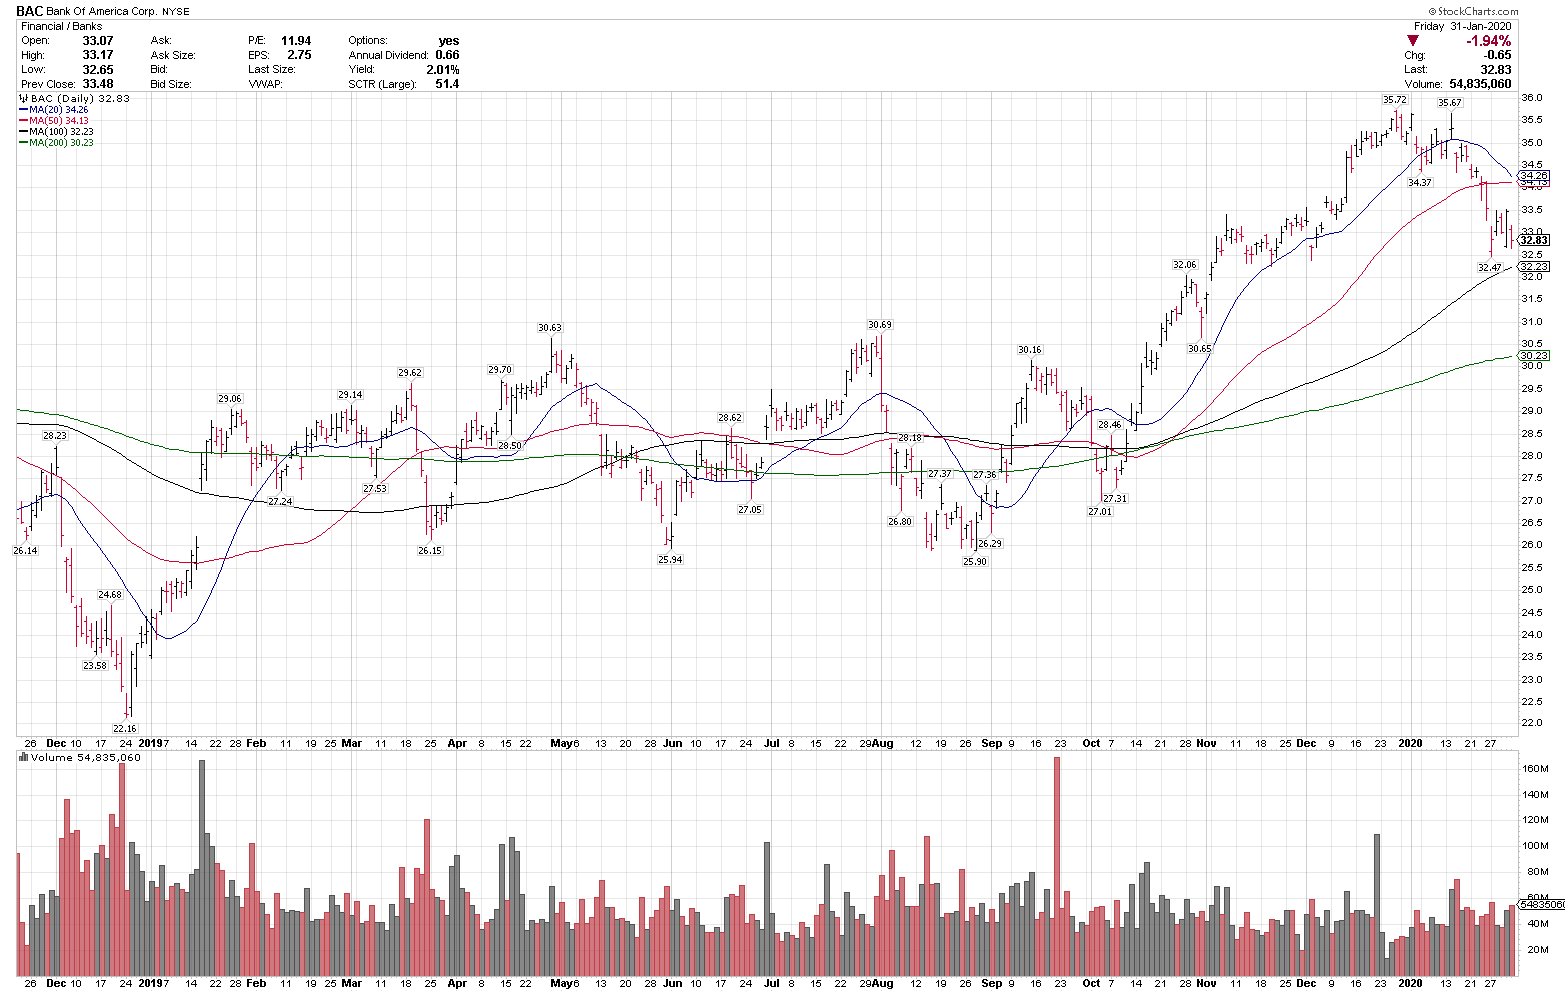
CHART OF THE WEEK
4/25/21
Bank of America, BAC
Close: 39.18
Stop level for position traders and investors: 33.30
please see chart analysis below
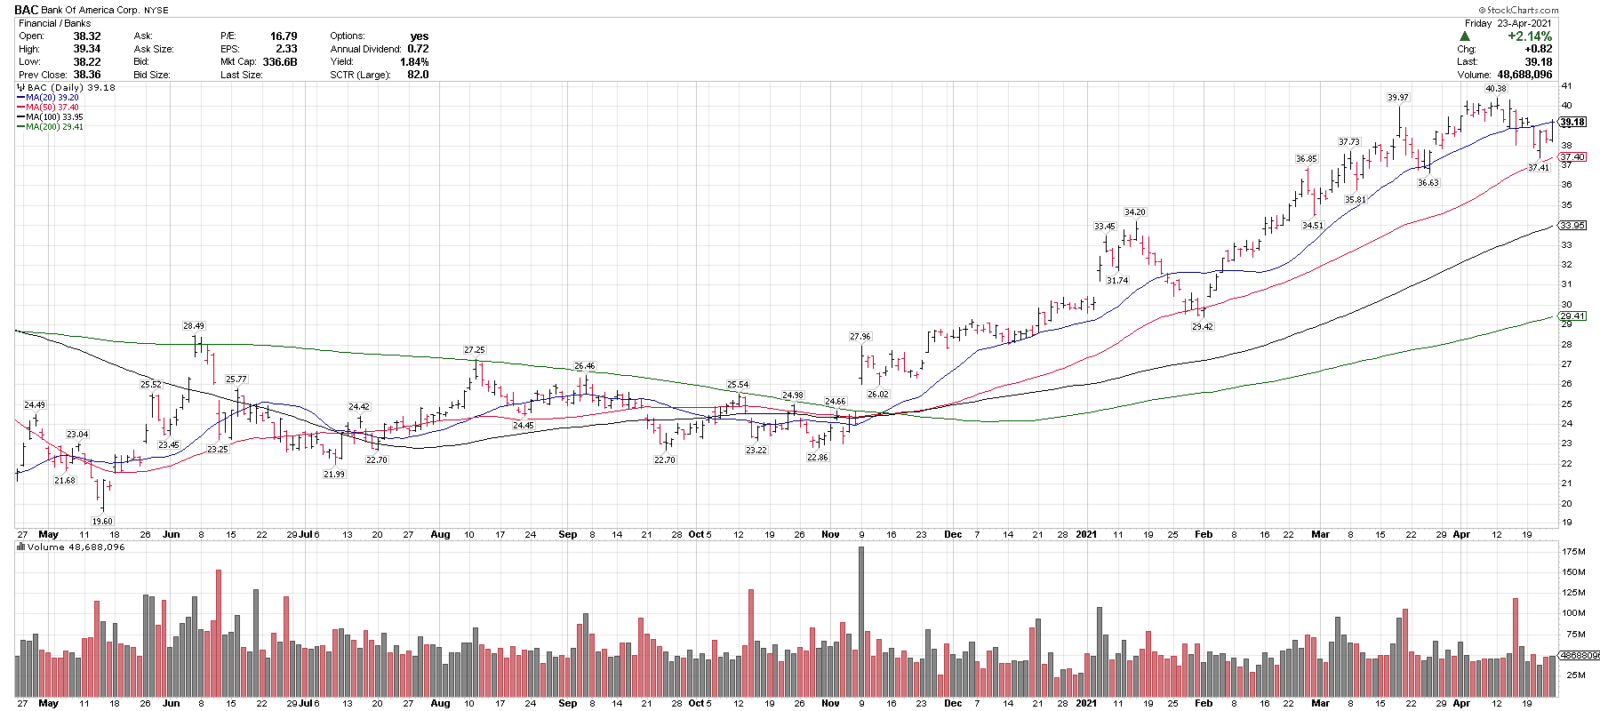
- Bank of America (BAC) is one of our top technical ideas coming into the week, and is on this week’s Members Top 25 Stocks List.
- BAC is currently trading over rising 50, 100 & 200-day moving averages.
- BAC recently pulled back 7.3% from multi-year highs and held at the rising 50-sma.
- BAC has put in a series of higher highs and higher lows, indicating a strong uptrend.
- 35-36 is key support on any pullbacks, and over 41 could signal a new breakout.
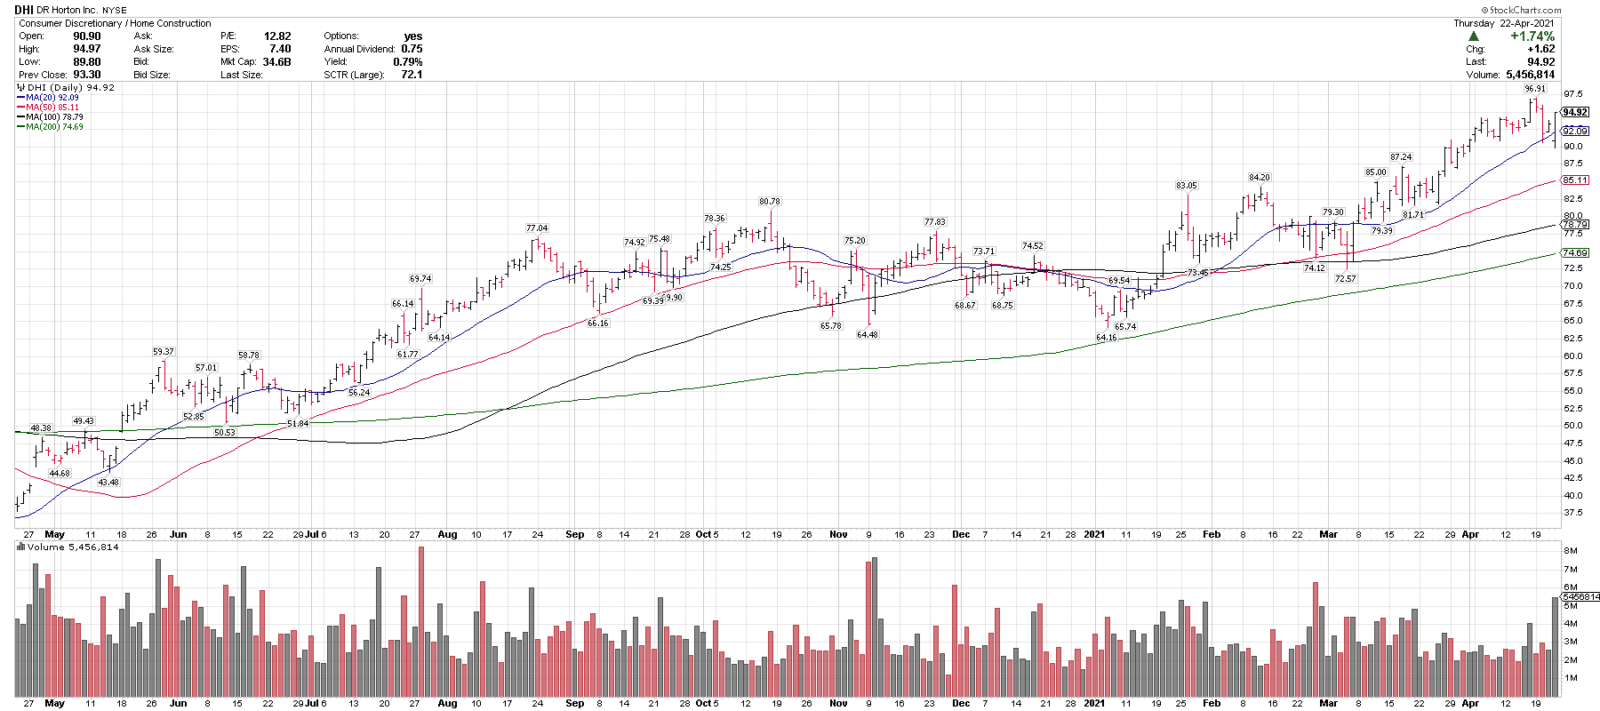
4/23/21
DR Horton, DHI
Close: 94.92
Pre: 95.48
Stop: 78.60
DHI is trading in an uptrend above 4 rising MAs and recently pulled back 7.3% from all-time highs. 85 is key support and over 97.50 could signal a breakout.
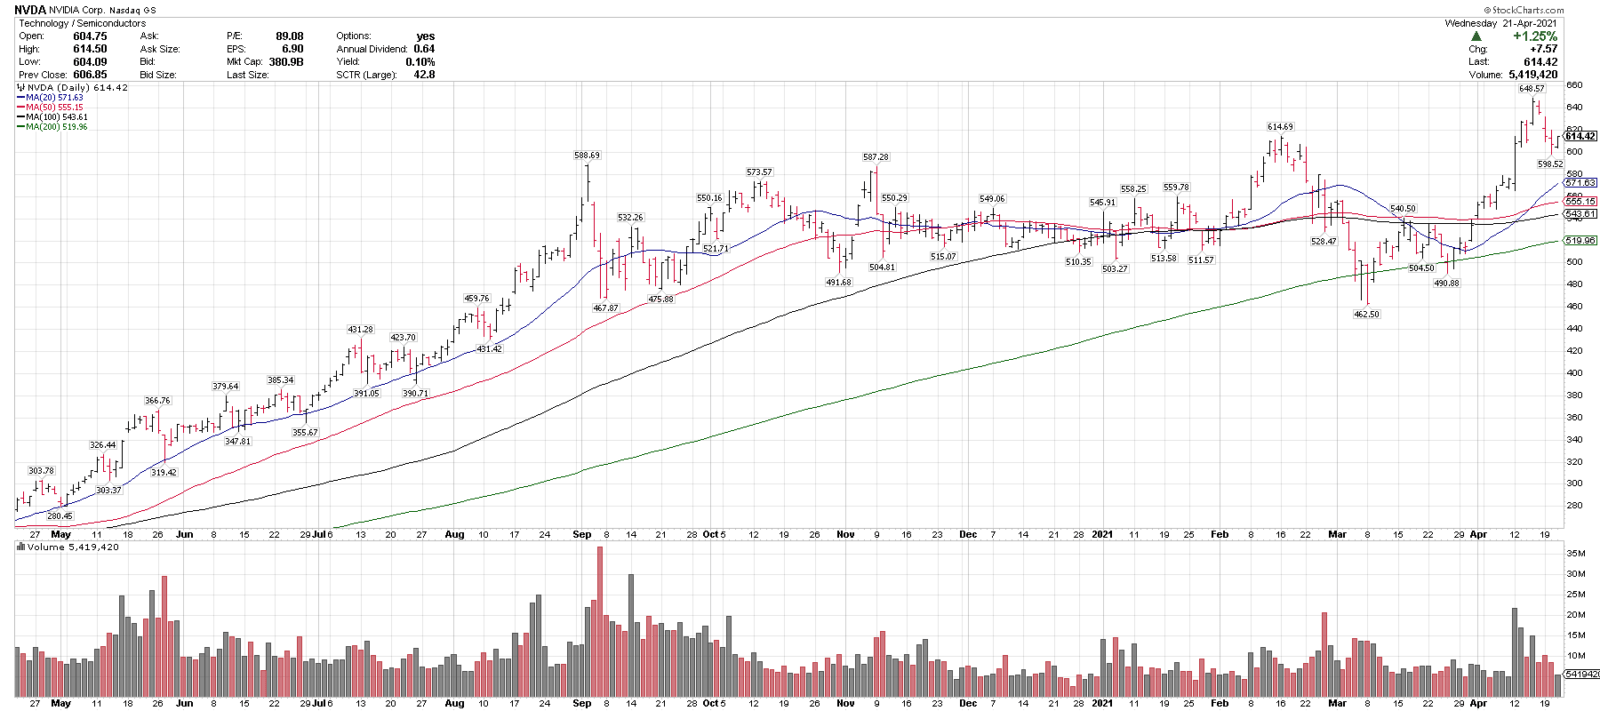
4/22/21
NVIDIA Corp., NVDA
Close: 614.42
Pre: 615.46
Stop: 514.40
NVDA is in an uptrend above 4 rising MAs, recently broke out to a new high & has pulled back 7.7% since then. 560, 580 and 600 are support levels, over 650 could signal new highs.
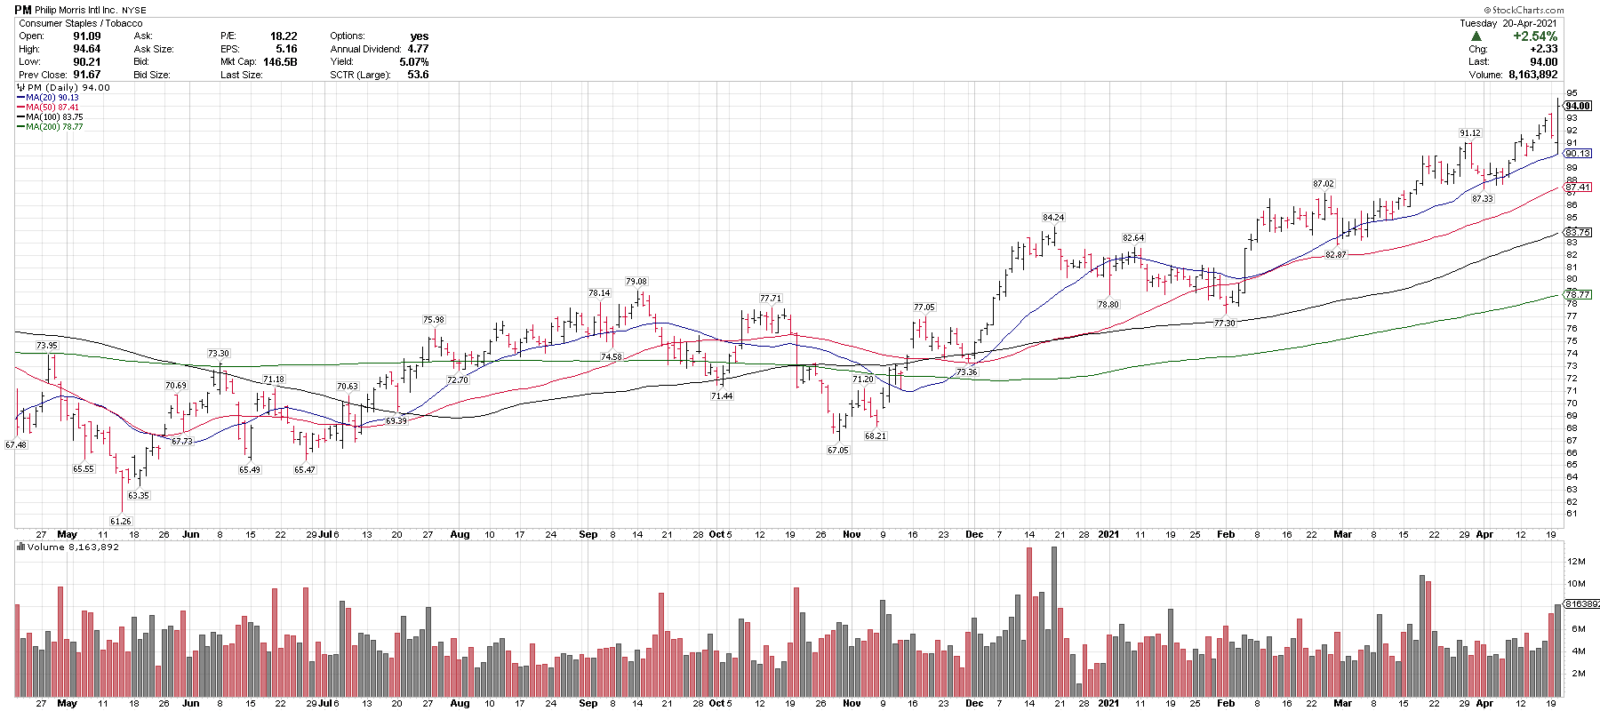
4/21/21
Philip Morris Intl., (PM)
Close: 94.00
Pre: 93.55
Stop: 81.75
PM is in an uptrend above 4 rising MAs, and broke out to a 3 1/2 year high yesterday (after earnings). 87-90 is near term support and over 95 could signal a breakout higher.
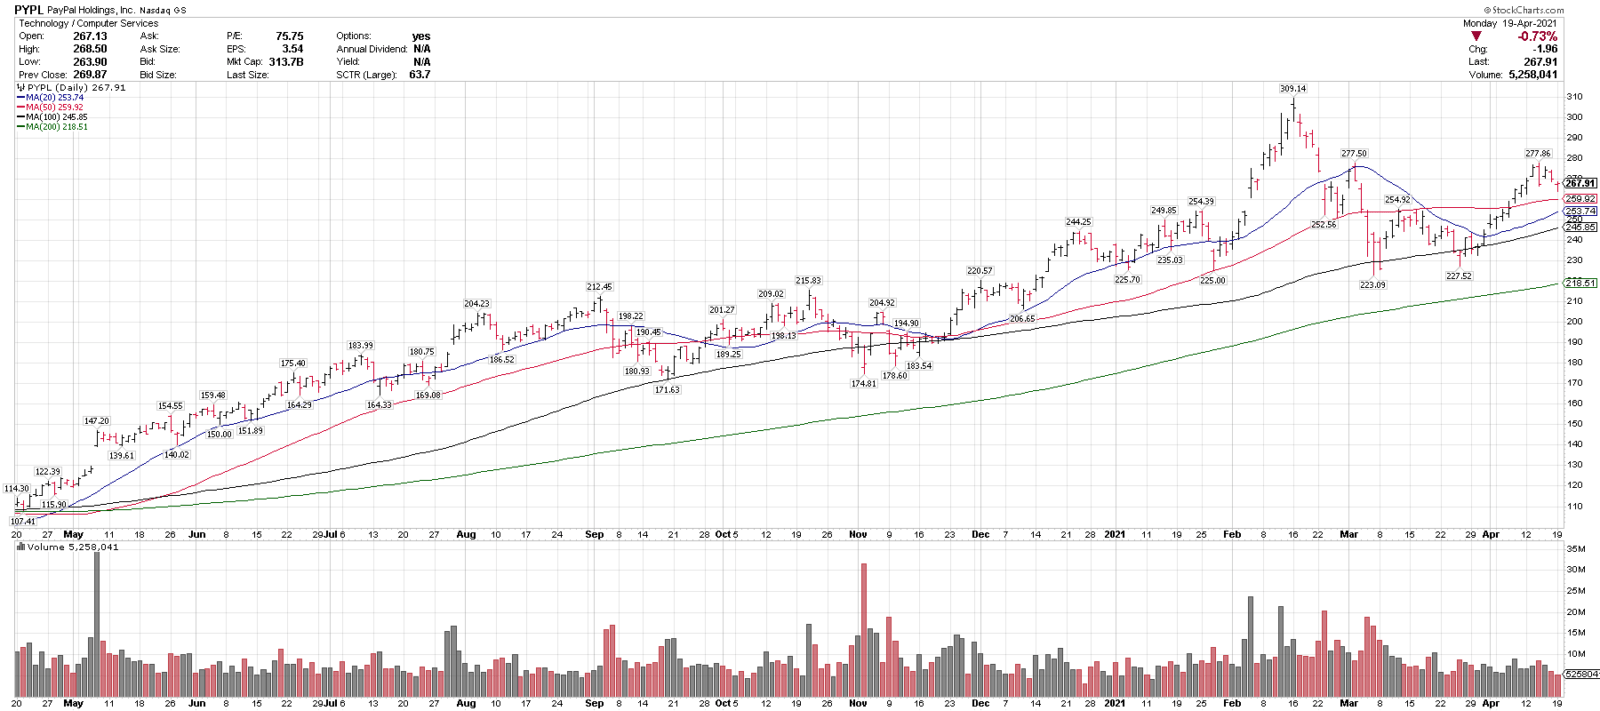
4/20/21
PayPal, PYPL
Close: 267.91
Pre: 268.31
Stop: 222.36
PYPL is in an uptrend above 4 MAs & recently corrected 27.8% off all-time highs. Since then, it has put in a higher low, higher high and is above 240-250 support. Over 280 could signal a breakout higher.
4/19/21
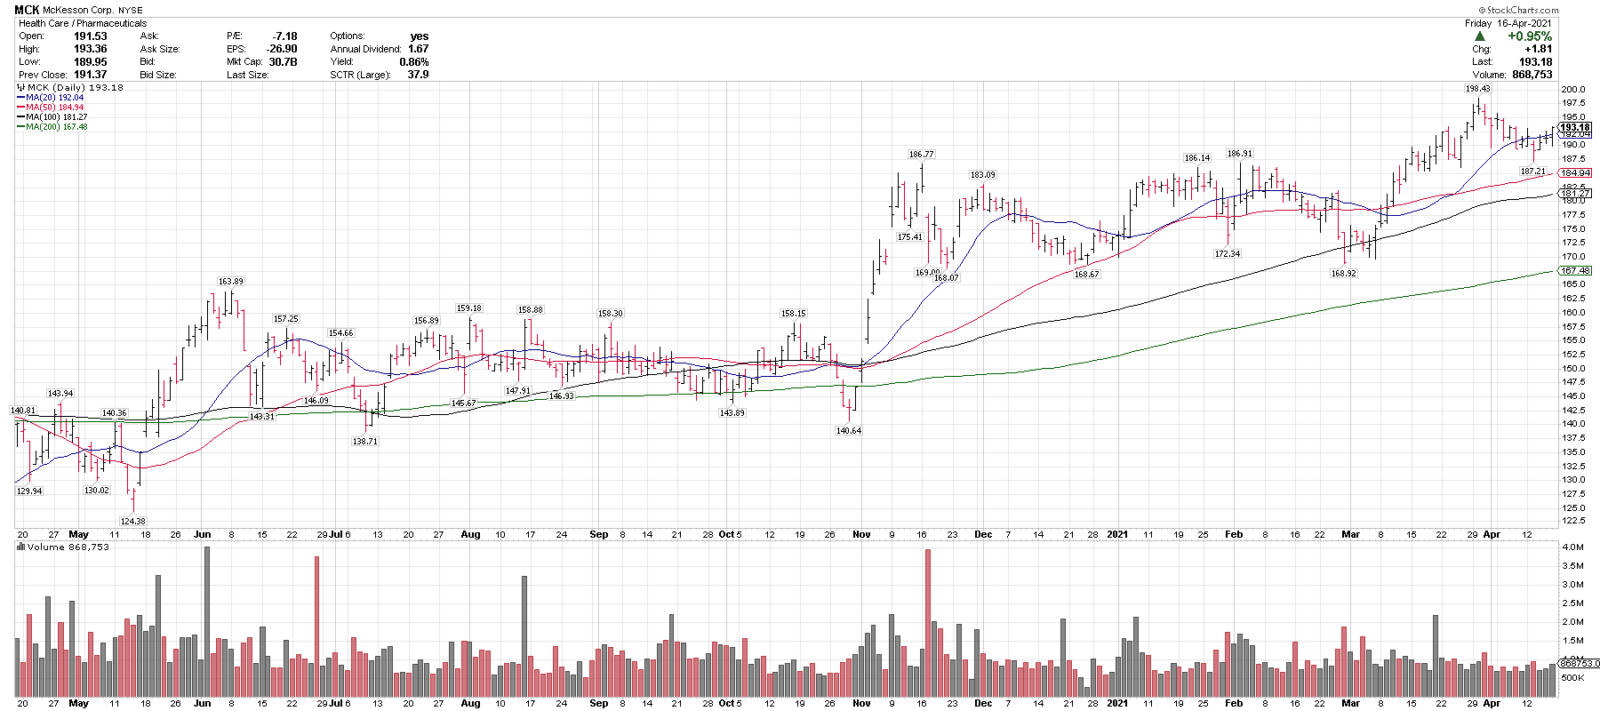
McKesson Corp., (MCK)
Close/Pre: 193.18
Stop: 164.20
MCK is in an uptrend above 4 rising MAs & recently corrected 5.6% of off 5 1/2 year highs. 185-190 is support, and over 200 could signal a breakout higher.
4/18/21
Blue Chip Daily Chart of the Week:
Sea Ltd., (SE)
Close: 252.42
Stop level for position traders and investors: 208.24
please see chart analysis below
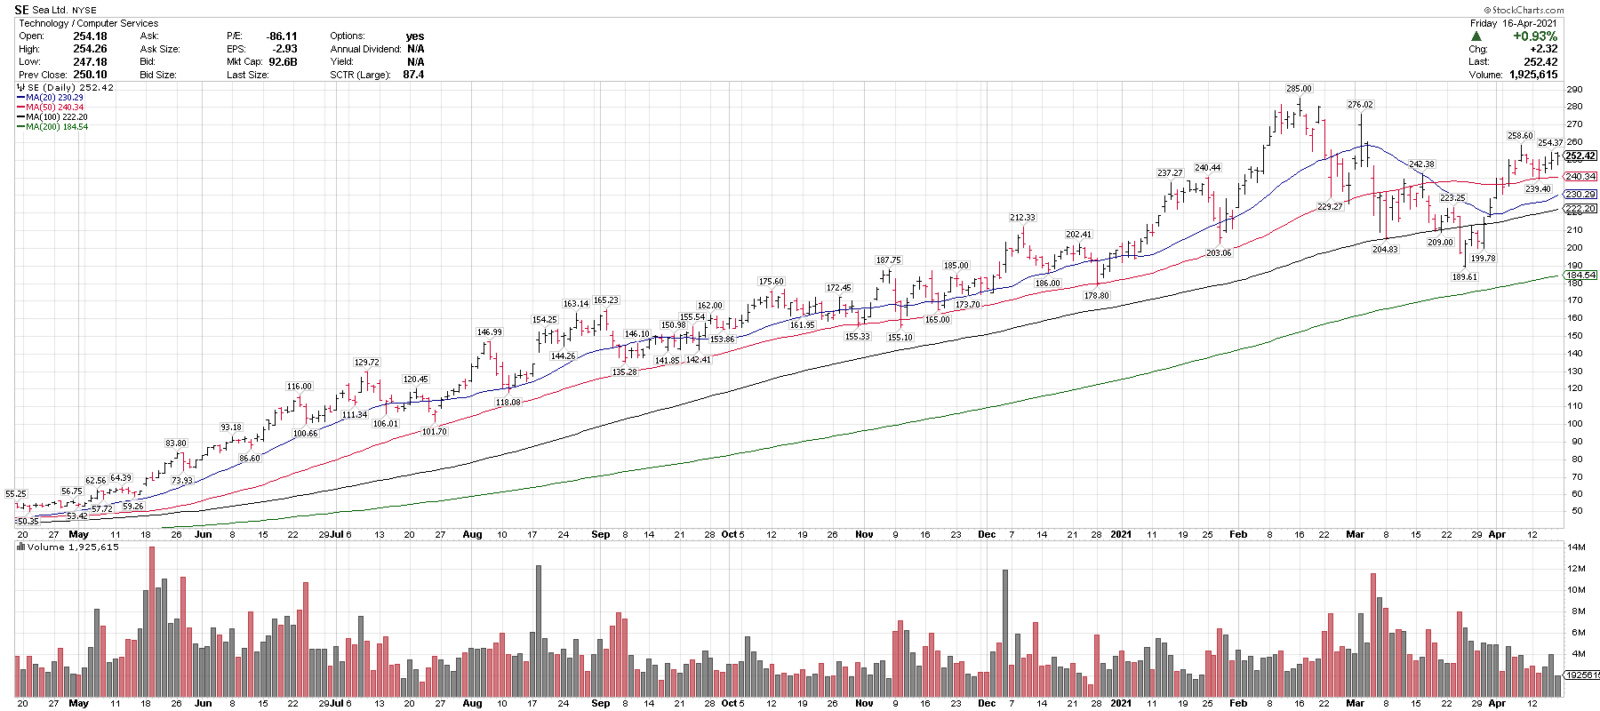
- Sea Ltd. (SE) is one of our top technical ideas coming into the week, was our Member’s Chart of the Day last Wednesday (4/14) and is on this week’s Members Top 25 Stocks List.
- SE is currently trading over the 20, 50, 100 & 200-day moving averages.
- SE recently had a 33.4% correction off of all time highs, and is showing signs of recovery, back over all key MAs.
- SE also recently put in a higher low and higher high, and reclaimed the 20 & 50-day moving averages. These are all constructive developments.
- 210-230 has moved up as a key support range on any pullbacks and over 290 could signal a breakout.
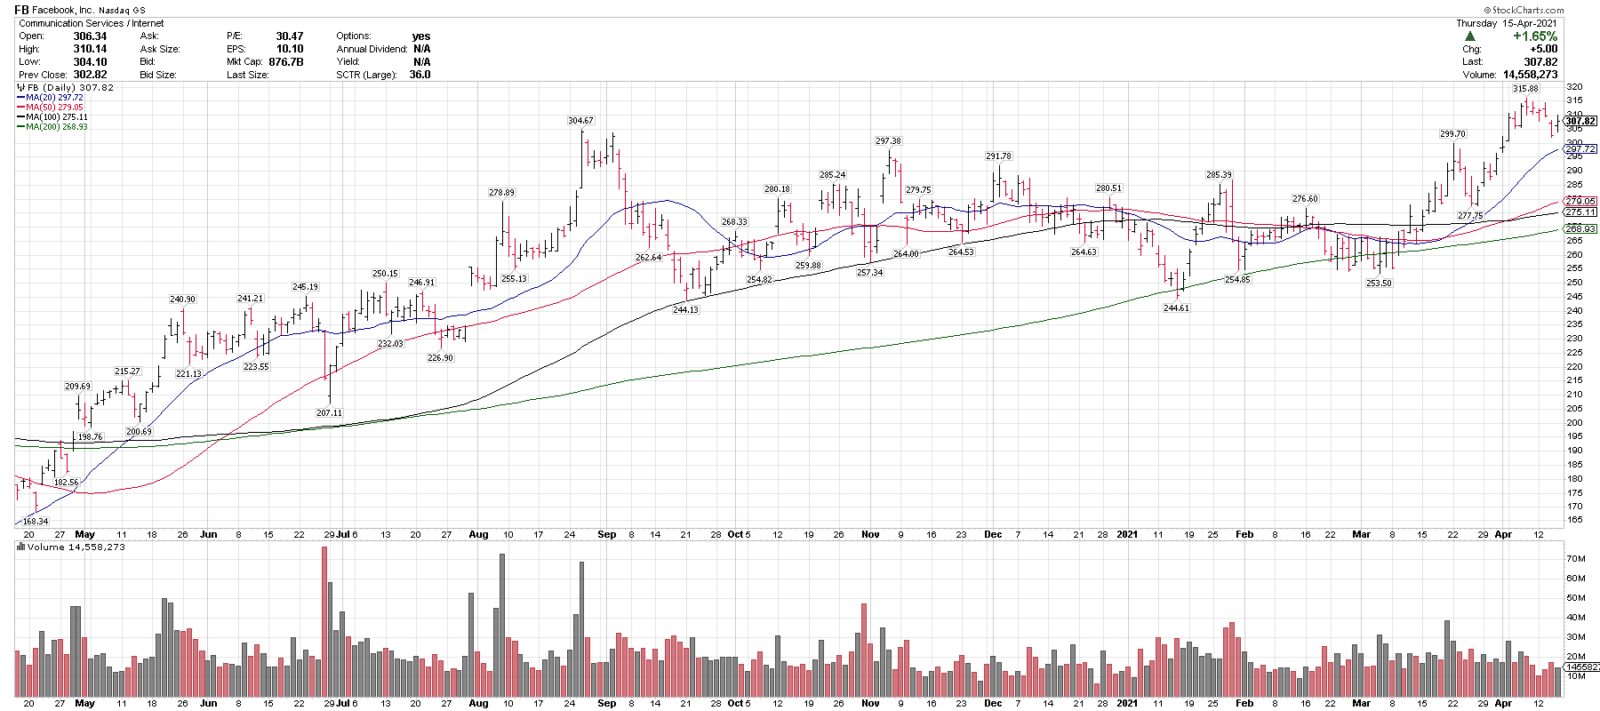
4/16/21
Facebook, FB
Close: 307.82
Pre: 308.55
Stop: 261.64
FB is in an uptrend above 4 rising MAs, recently broke out of a 7-month range to new highs & just pulled back 4.4%. 290-300 is key support & over 320 could signal a breakout.
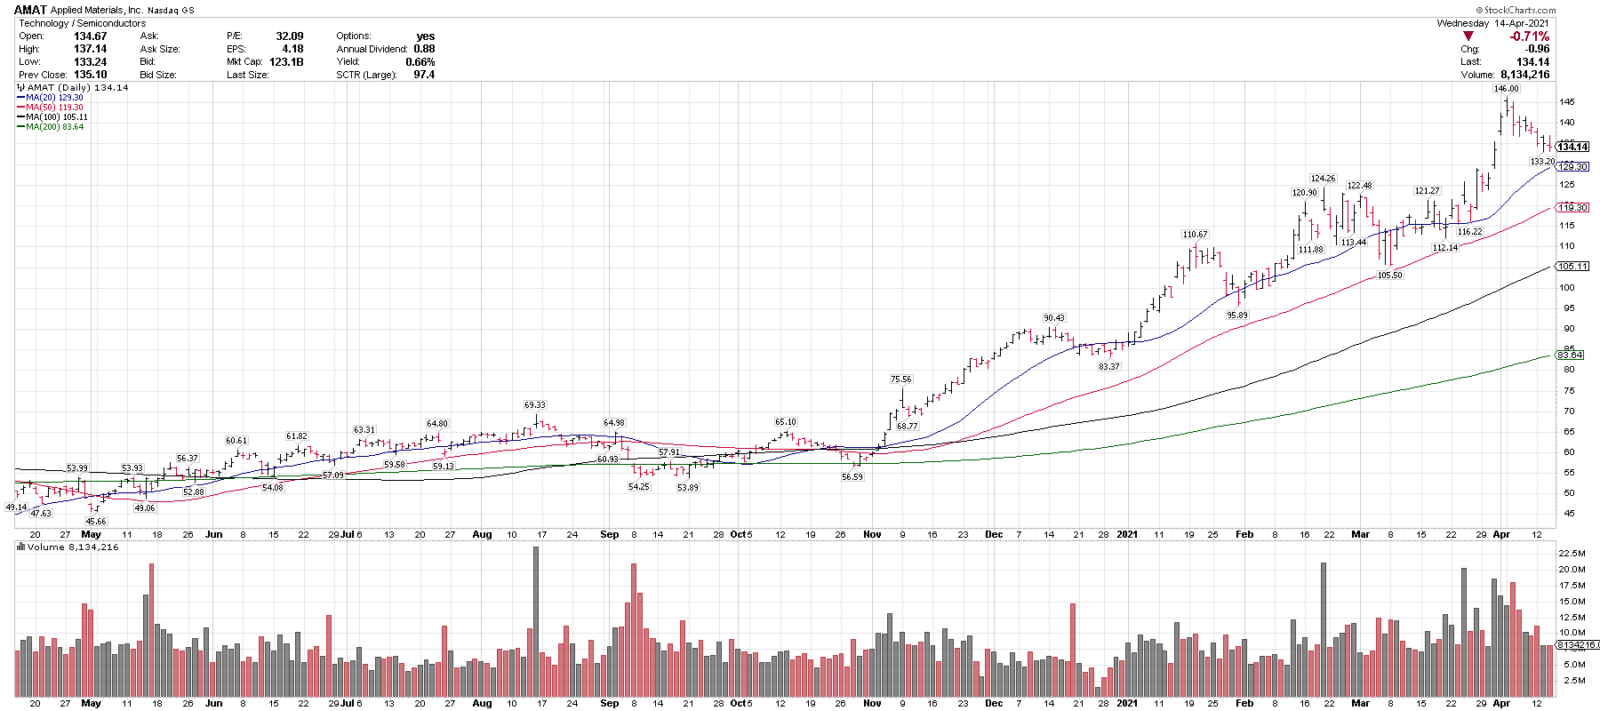
4/15/21
Applied Materials, AMAT
Close: 134.14
Pre: 135.98
Stop: 112.67
AMAT is in an uptrend above 4 rising MAs & recently corrected 8.7% off of all-time highs. 120-125 is key support on any further pullback.
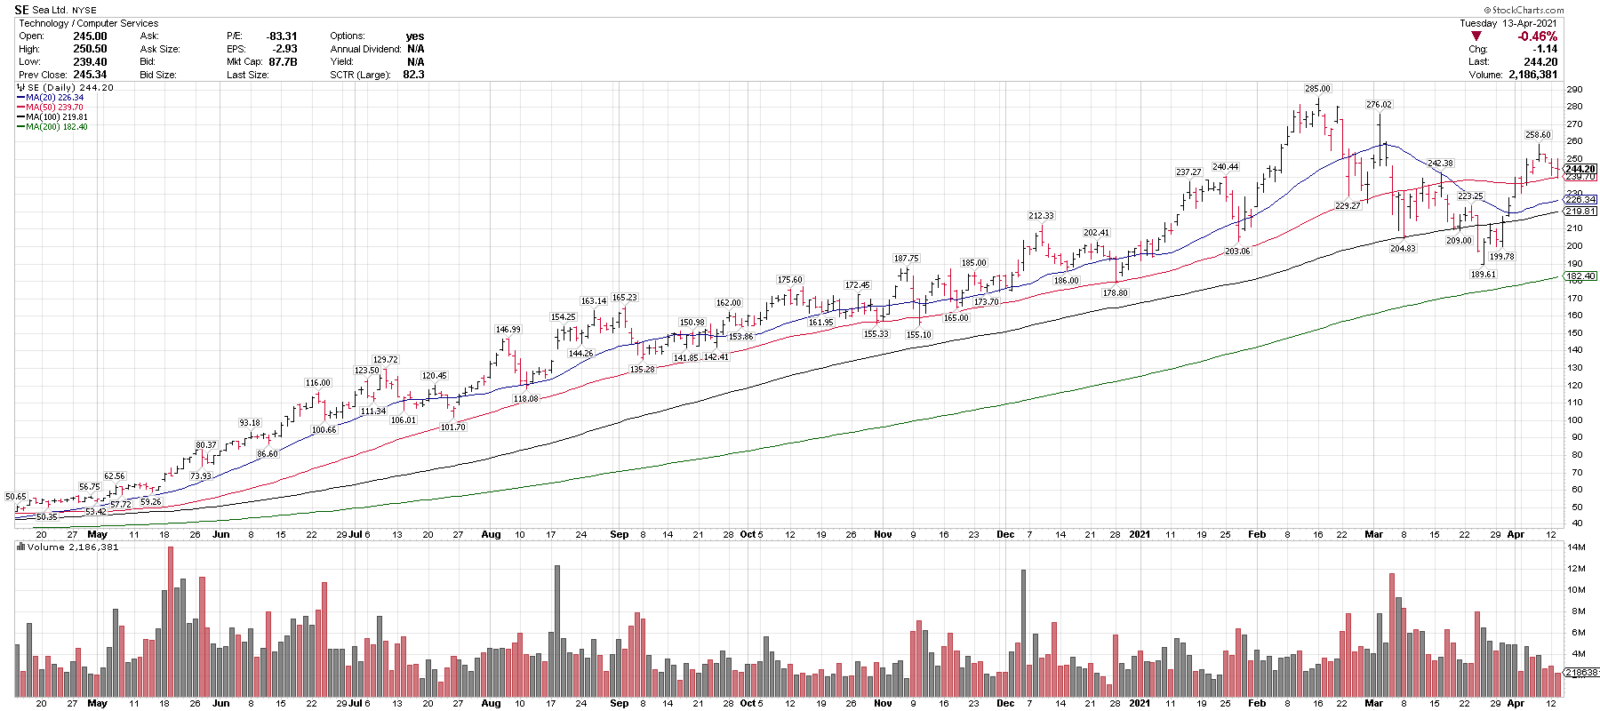
4/14/21
Sea Ltd., SE
Close: 244.20
Pre: 247.77
Stop: 197.40
SE is in an uptrend above 4 rising MAs. It is recovering from a 33.4% drawdown last month and recently corrected 7.4% into the rising 50-sma. Long-term support is in the 200-220 range. This is a wider trend following stop, due to current market volatility.
4/13/21
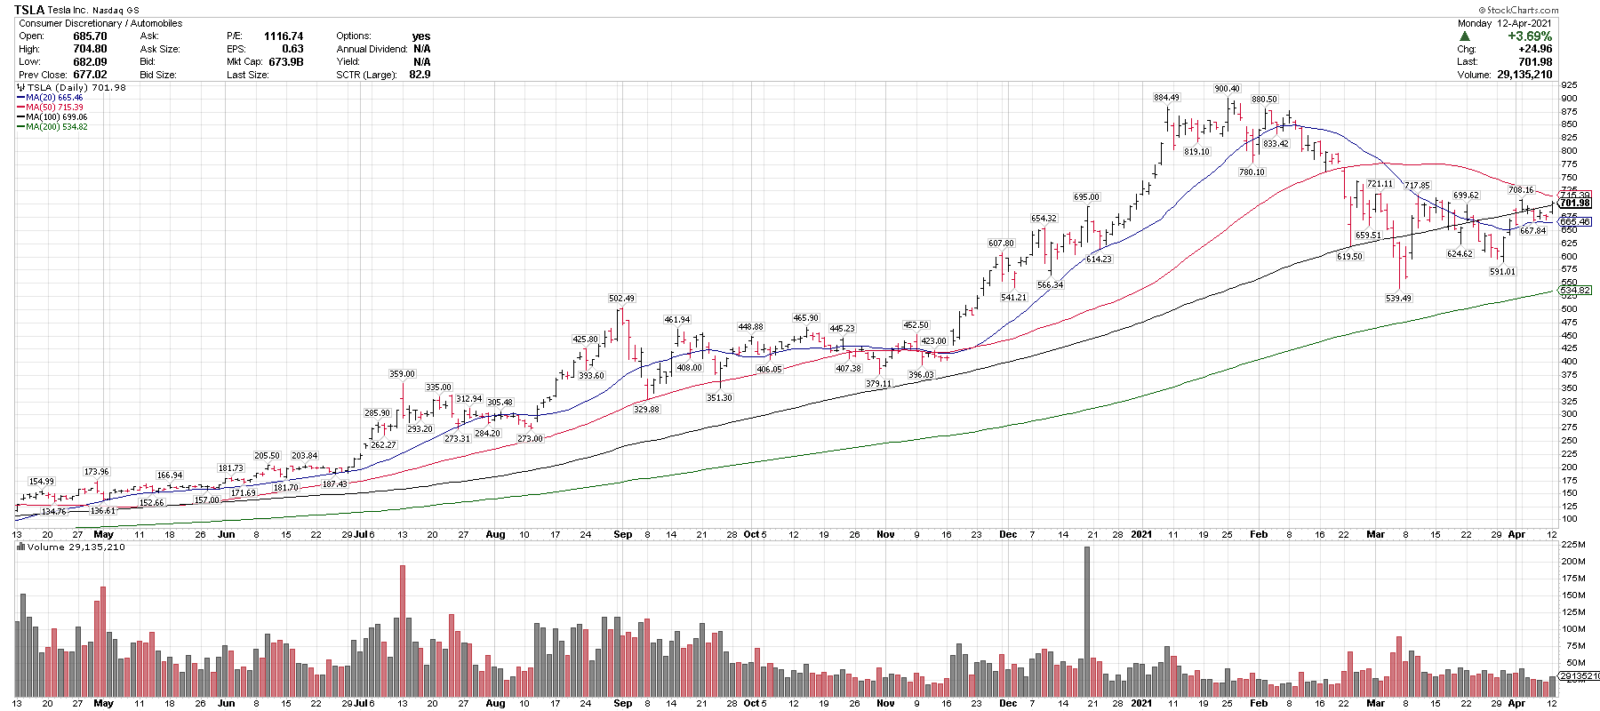
Tesla Inc., TSLA
Close: 701.98
Pre: 705.06
Stop: 561.58
TSLA is improving in it’s consolidation phase, after a 40.0% drawdown, with a higher low vs early March, over 3 MAs, and testing over $700 & the 10-week MA. This is a higher volatility, but a high potential reward/risk chart. The stop is wider than average to allow for market and position volatility.
4/13/21 (Best Ideas List, a comparable idea to the COTD)
Lennar, LEN
4/12/21
ArcelorMittal, MT
Close: 28.97
Pre: 29.40
Stop: 24.33
MT is in an uptrend above 4 MAs & recently corrected 5.7% off of 30-month highs. 25-27 is support & over 31 could signal a new breakout. MT is on this week’s Top 25 list.
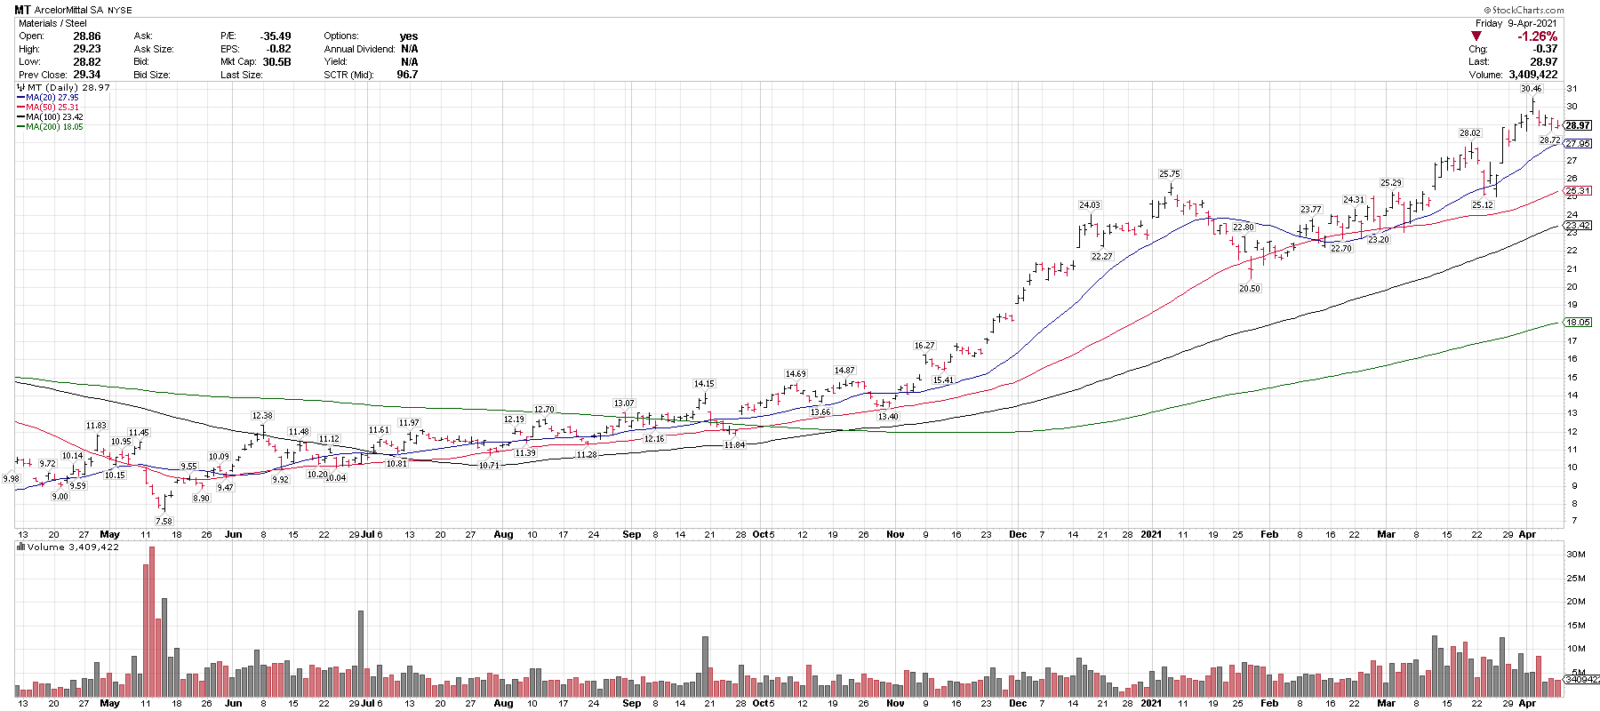
CHART OF THE WEEK
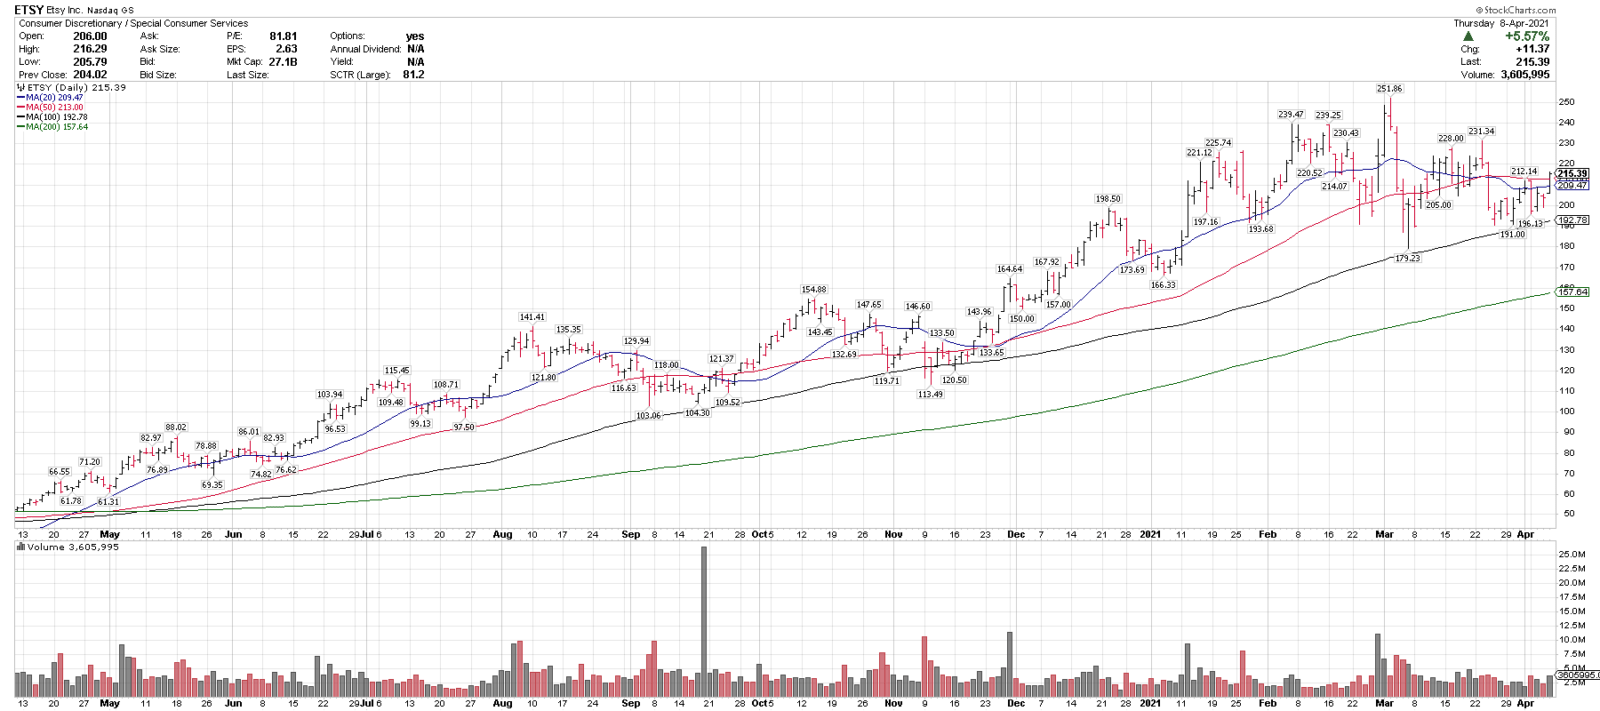
04/11/21
Blue Chip Daily Chart of the Week:
Etsy Inc., (ETSY)
Close: 218.57
Stop level for position traders and investors: 178.72 (wider than average, due to recent volatility in this stock)
please see chart analysis below
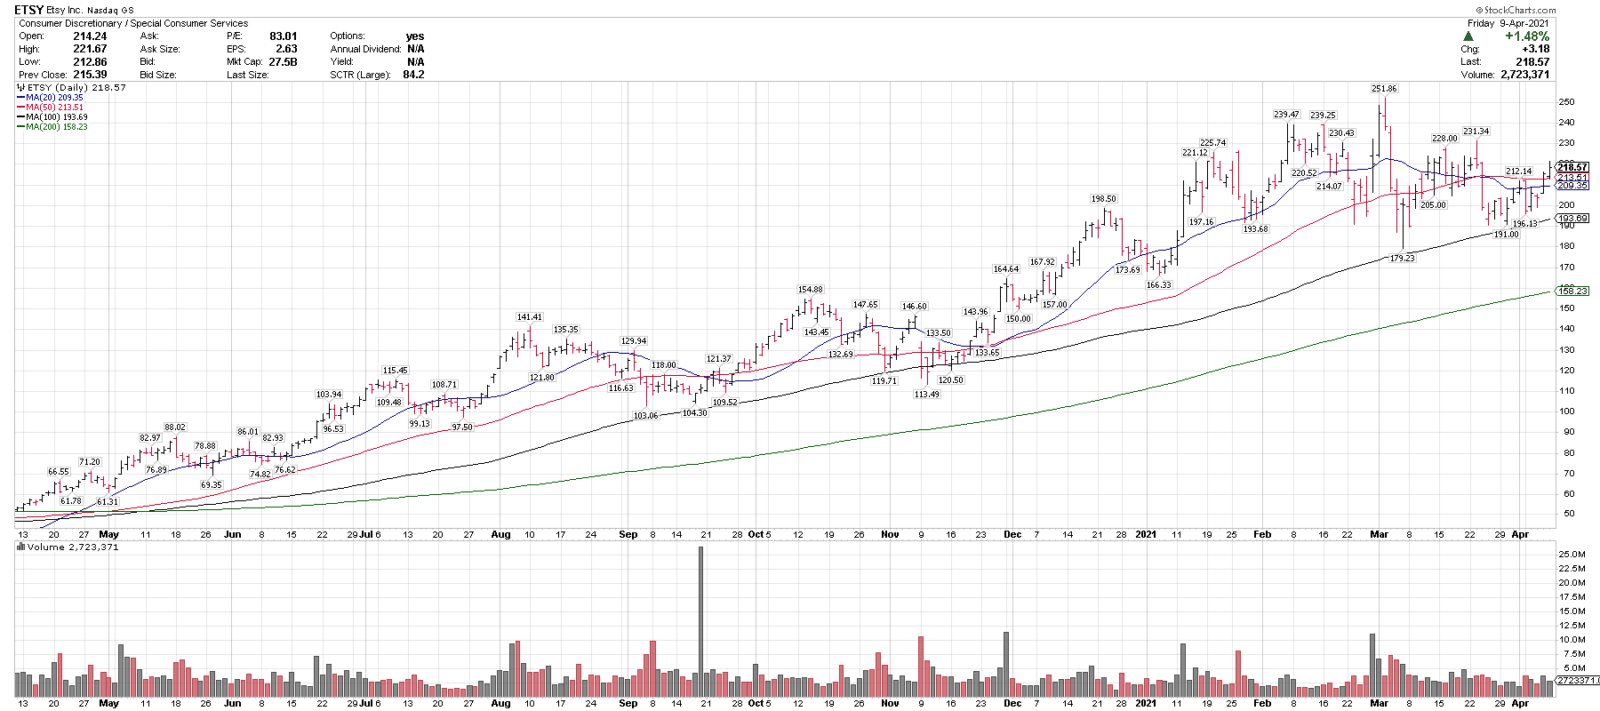
- Etsy Inc., (ETSY) is one of our top technical ideas coming into the week, was our Member’s Chart of the Day last Friday and is on this week’s Members Top 25 Stocks List.
- ETSY is currently trading over the 20, 50, 100 & 200-day moving averages.
- ETSY recently had a very sharp 28.8% correction and is showing signs of trying to build a base and recover.
- ETSY recently put in two higher lows vs the early March low, and reclaimed the 20 & 50-day moving averages. These are all constructive developments.
- 190-200 is key support and over 240 could signal a breakout.
- Key Note: ETSY is considered a high growth stock and can be more volatile.
4/9/21
Etsy, ETSY
Close: 215.39
Pre: 215.12
Stop: 178.77
ETSY is in a longer-term uptrend, is trading over 4 MAs & recently corrected 28.8% off of all-time highs. It has key support at 190-200 and over 240 could signal a breakout higher.
4/9/21 (Best Ideas List, equivalent to COTD)
FedEx Corp, FDX
Close: 284.44
Pre: 284.50
Stop: 238.92
FDX is in an uptrend above 4 rising MAs & recently corrected 23.0% off of all-time highs. 250-270 is support & over 300 could signal a breakout.
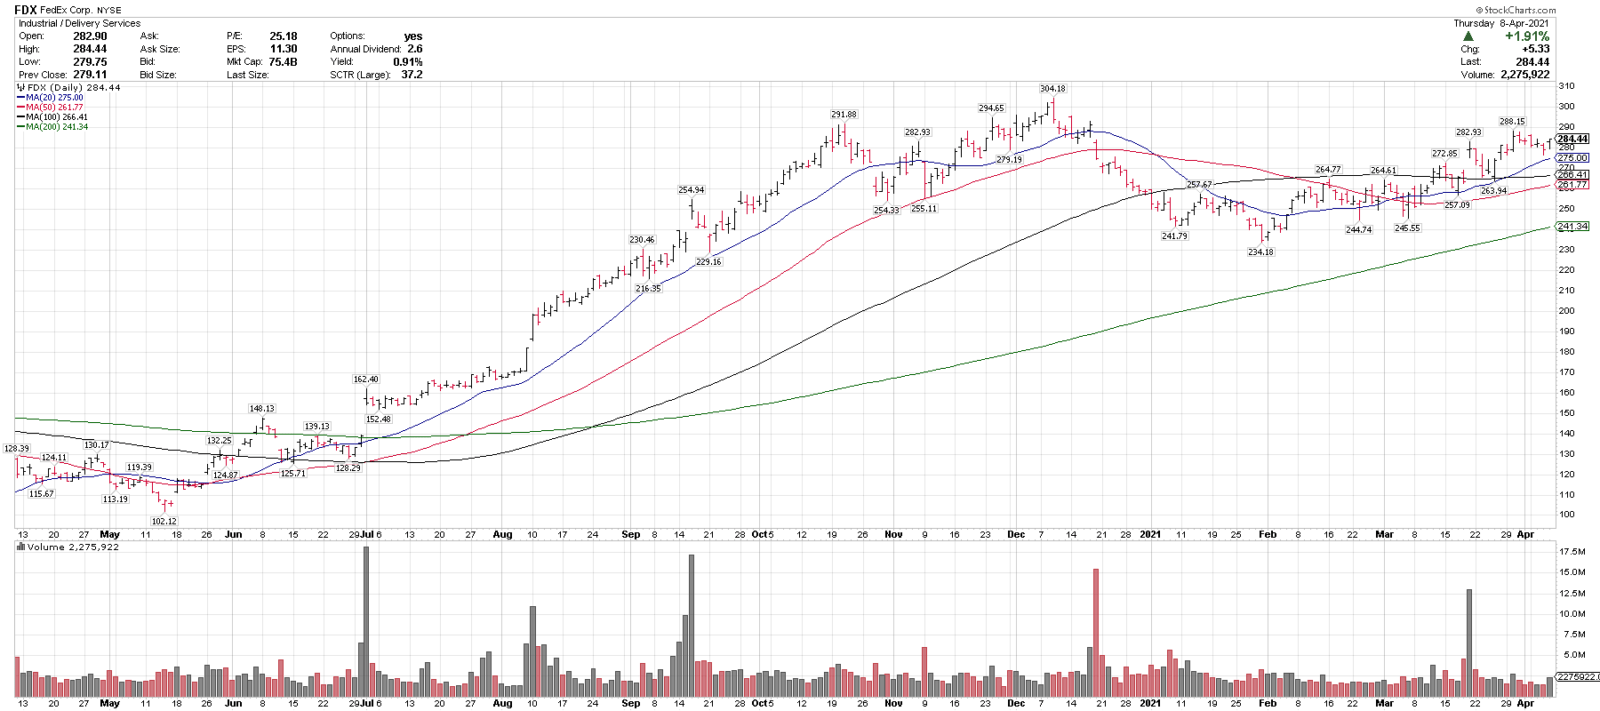
$FDX Close: 284.44 Pre: 284.50 Stop: 238.92 $FDX is in an uptrend above 4 rising MAs & recently corrected 23.0% off of all-time highs. 250-270 is support & over 300 could signal a breakout.
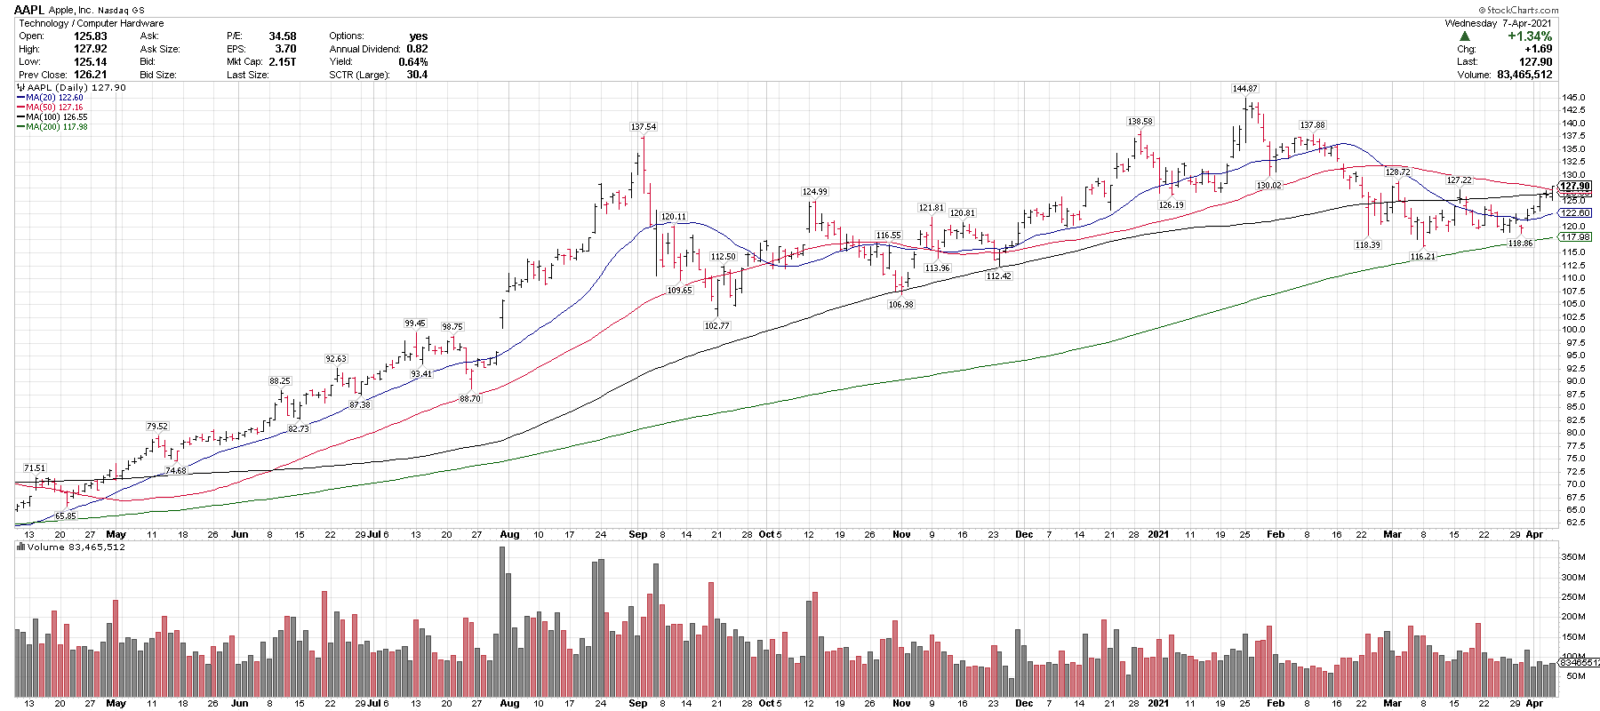
4/8/21
Apple, AAPL
Close: 127.90
Pre: 128.90
Stop: 112.45
AAPL is trading above 4 MAs, cleared the 50-sma yesterday and held the 200-sma after a 19.7% pullback off of all-time highs. 118 is key support.
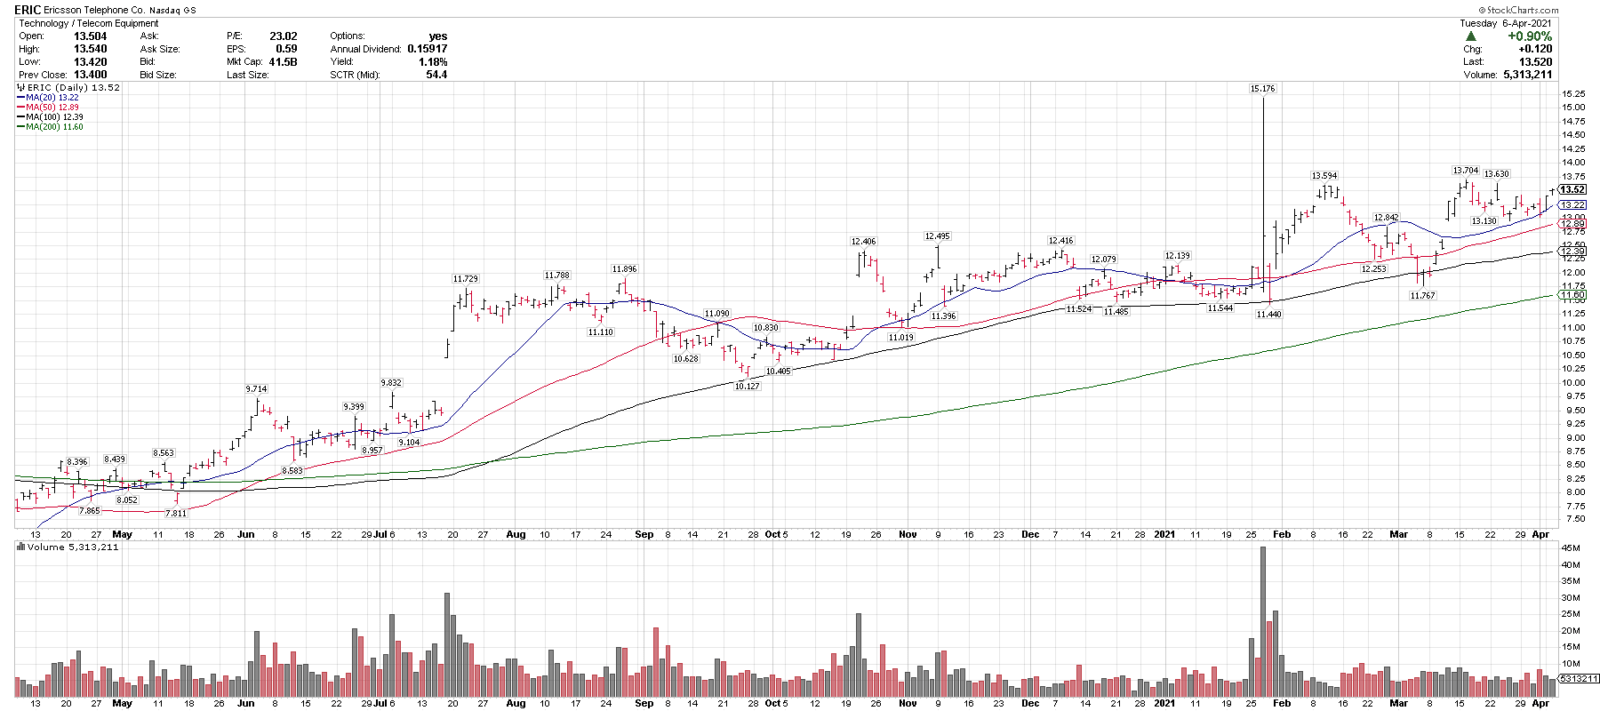
4/7/21
Ericsson, ERIC
Close: 13.52
Pre: 13.54
Stop: 11.44
ERIC is in an uptrend above 4 rising MAs and recently pulled back 5.1% into the rising 20-sma. 12.50 – 13 is support and over 13.75 could signal a breakout higher.
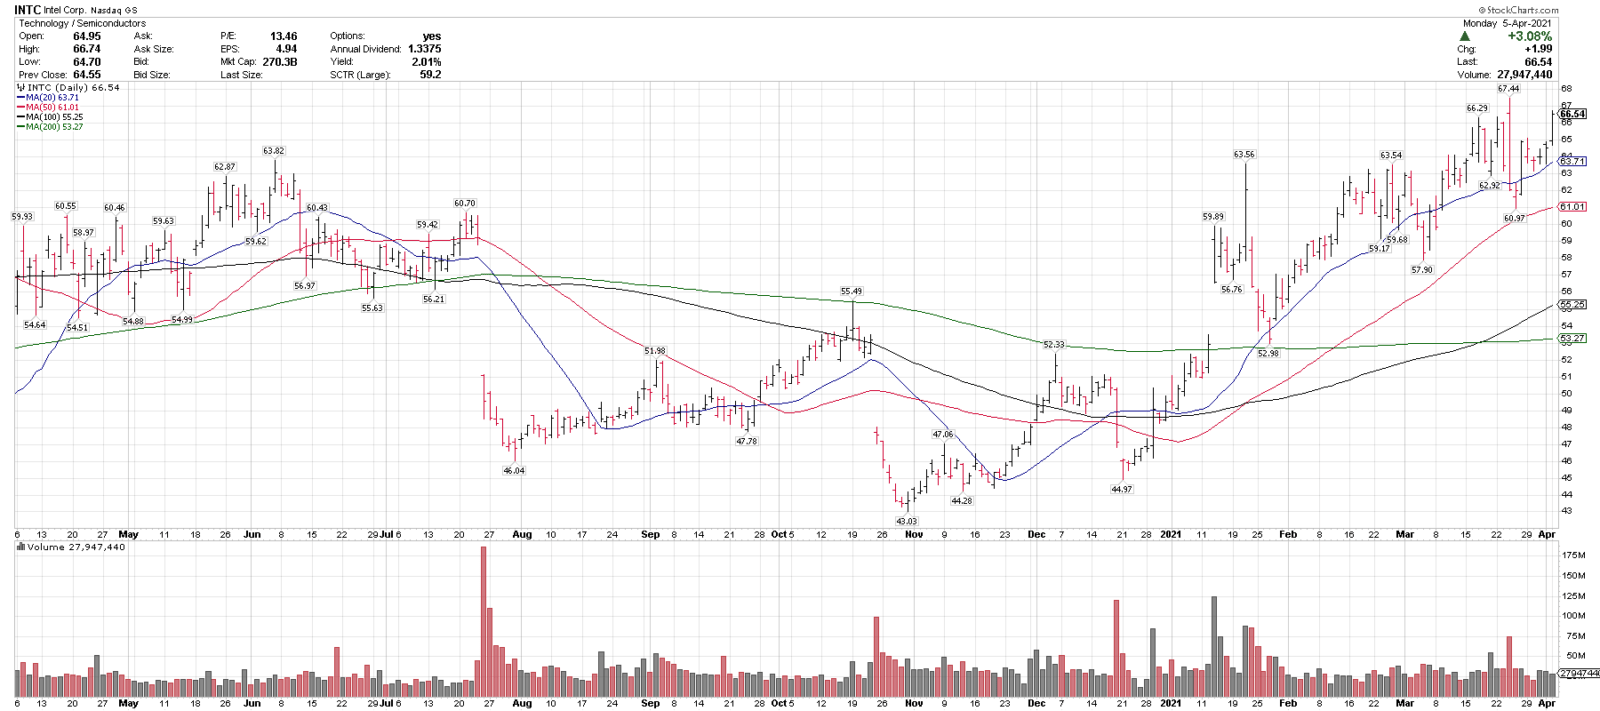
4/6/21
Intel, INTC
Close: 66.54
Pre: 66.75
Stop: 56.45
INTC is a tech sector leader YTD and is in an uptrend above 4 rising MAs. It just corrected 9.5% off of new highs into the 50-sma. 60-64 is support. Over 68 would signal new highs. INTC was on last week’s Top 25 list.
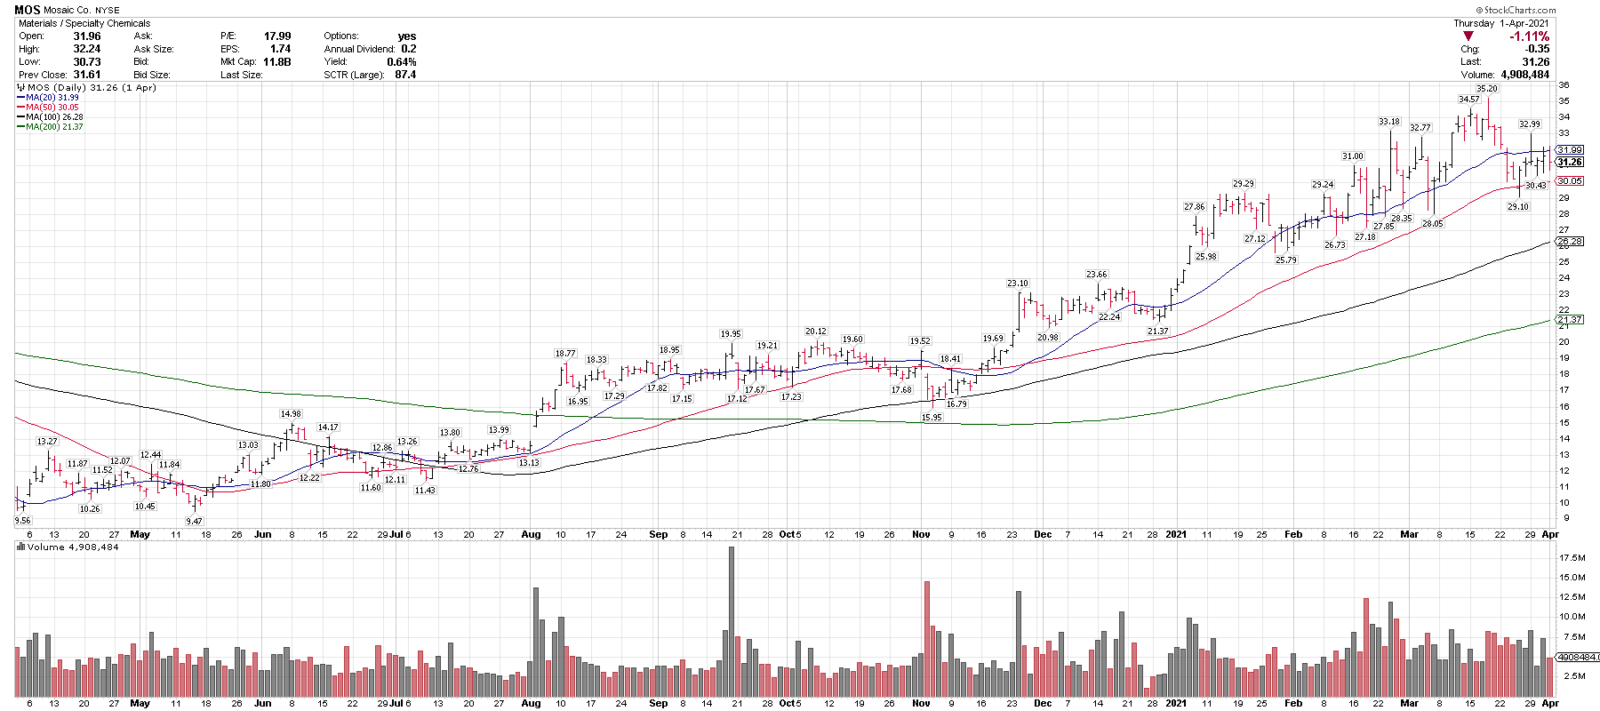
4/5/21
Mosaic, MOS
Close: 31.26
Pre: 32.17
Stop: 26.20
MOS is in an uptrend above the rising 50, 100 & 200-sma & recently corrected 17.3% into the 50-sma. 27-30 is support & over 35 could signal a breakout. On this week’s Top 25 list.
04/4/21
Blue Chip Daily Chart of the Week:
Pinterest, (PINS)
Close: 77.73
Stop level for position traders and investors: 64.41 (wider than average, due to recent volatility in this stock)
please see chart analysis below
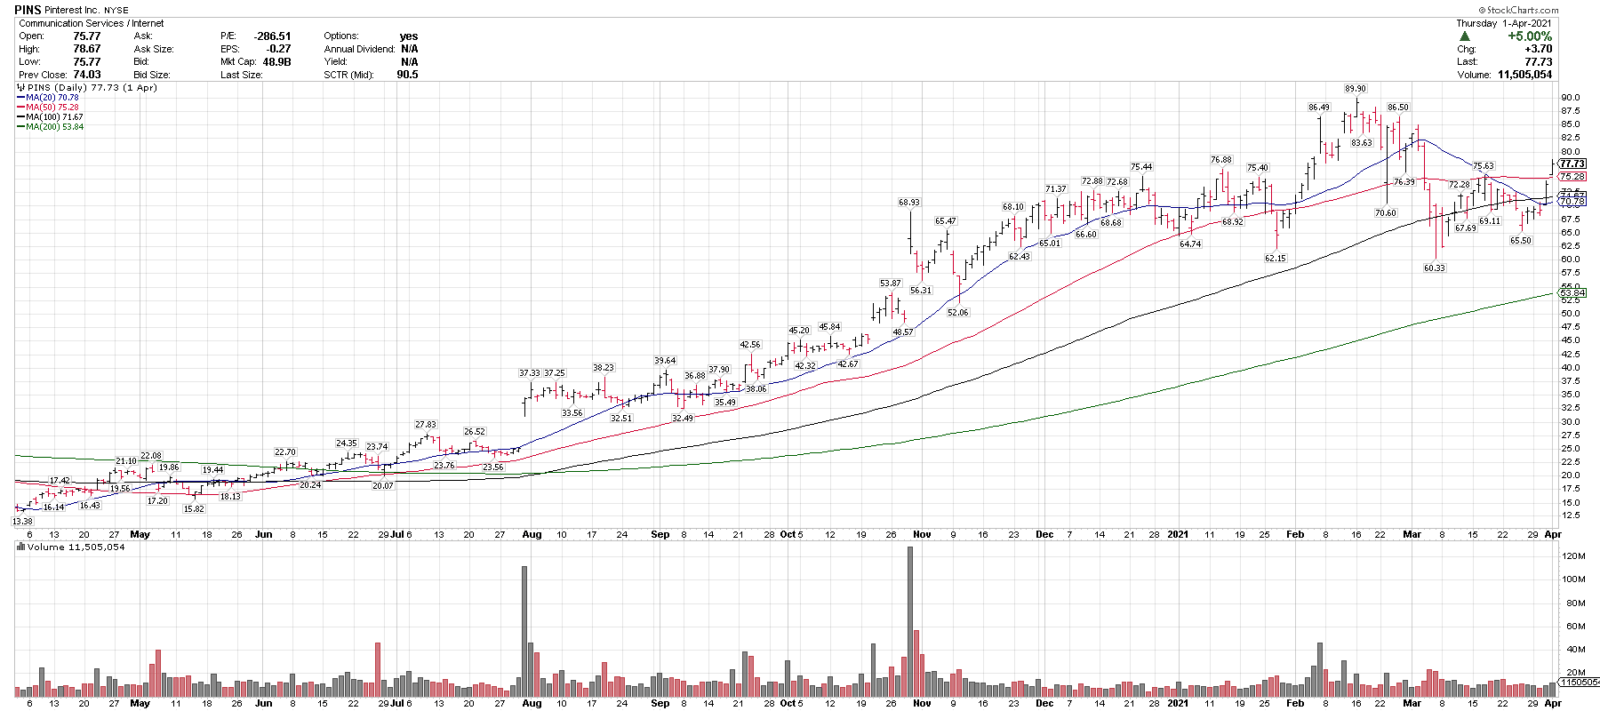
- Pinterest (PINS) is one of our top technical ideas coming into the week and is on this week’s Members Top 25 Stocks List.
- PINS is currently trading over the 20, 50, 100 & 200-day moving averages.
- PINS recently had a very sharp 32.8% correction over a three week period and is showing signs of trying to build a base and recover.
- PINS recently put in a higher low on 3/25 vs the 3/5 reaction low, has reclaimed the 20 & 50-day moving averages and the 20-SMA has also turned up. These are all constructive developments.
- PINS is also trading above a 4-month support base.
- Key Note: PINS is considered a high growth stock and can be very volatile. High growth stocks have been more volatile over the last few weeks as 10-year US Treasury yields (TNX) have risen. If TNX breaks out to the upside for some reason, it could put renewed pressure on higher growth stocks. This is not a prediction, just an observation and something to be aware of.
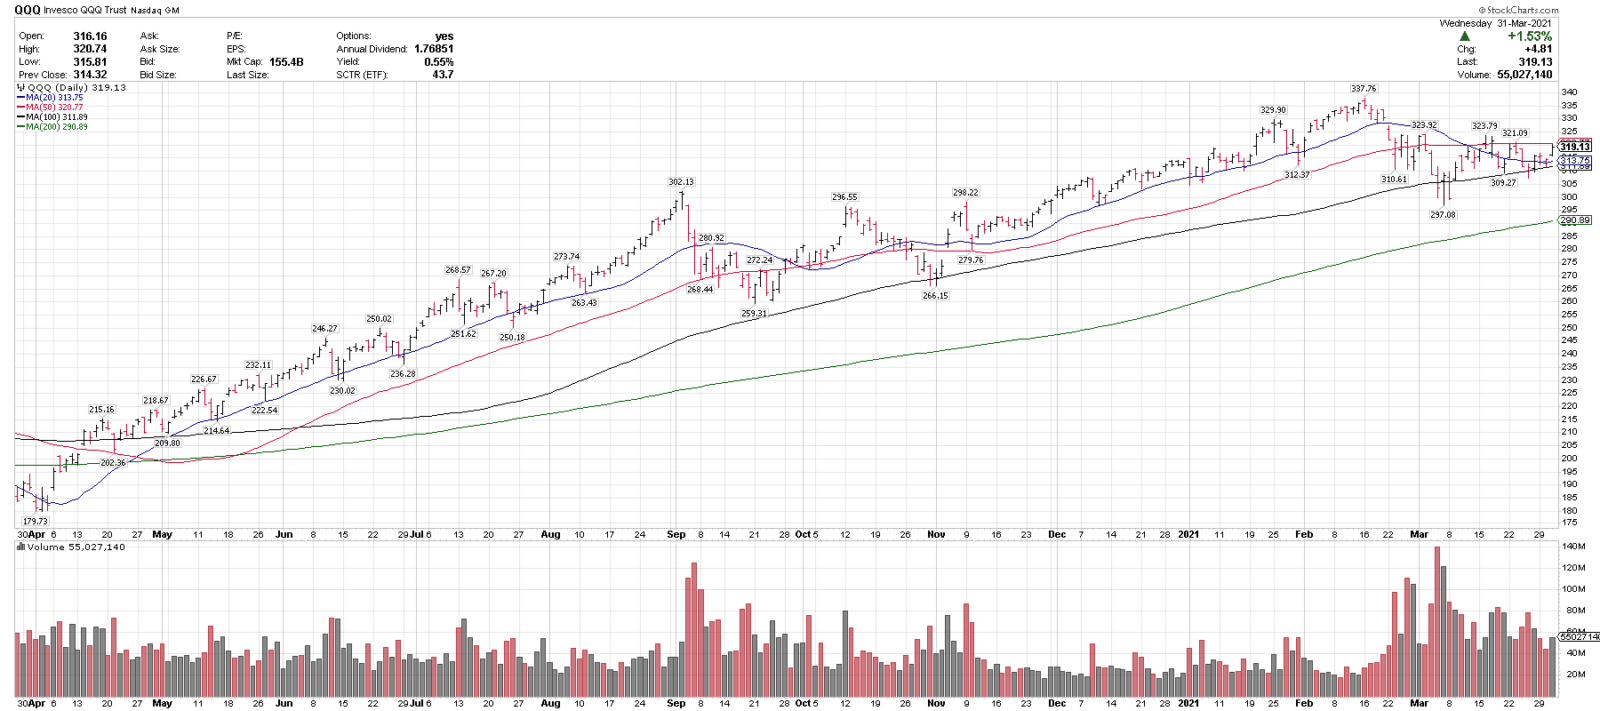
4/1/21
Nasdaq 100 ETF, QQQ ( a good proxy for tech and growth stocks overall)
Close: 319.13
Pre: 322.60 (+1.10%)
Stop: 294.40
QQQ is in a longer-term uptrend testing over all MAs pre-market, recently corrected 12% off of all-time highs, held the early March lows & the 20-sma has turned up. QQQ is a good proxy for tech and growth stocks overall.
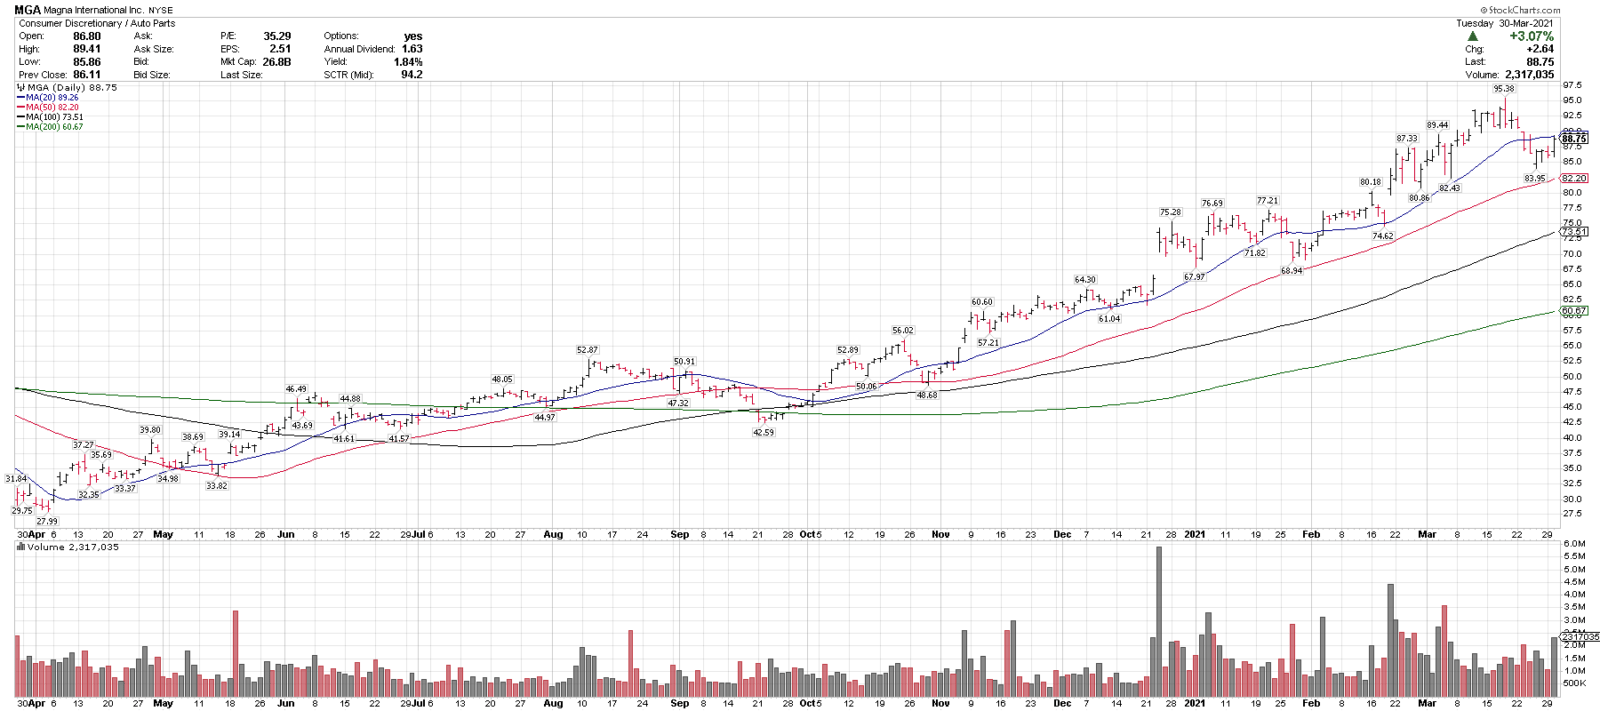
3/31/21
Magna International Inc., (MGA)
Close: 88.75
Pre: 90.00
Stop: 74.45
MGA is in an uptrend above 3 rising MAs & recently pulled back 11.9% off of all-time highs, and over the 50-sma. 80-85 is support and over 95 could signal a breakout. MGA has exposure to the EV industry as well.
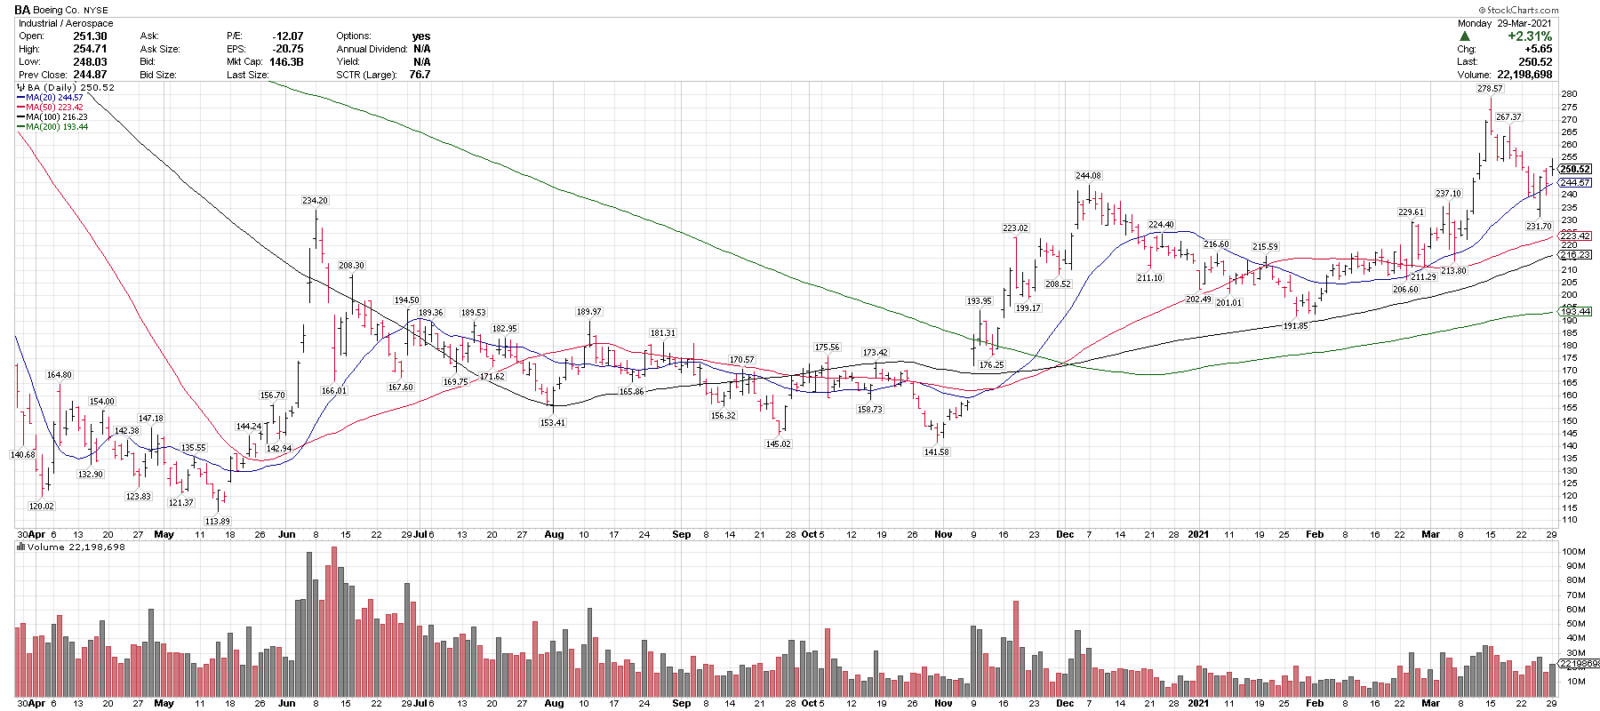
3/30/21
Boeing, BA
Close: 250.52
Pre: 251.40
Stop:212.94
BA is in an uptrend above 4 rising MAs & recently pulled back 16.8% off of 52-week highs. 230-245 is a key support range.
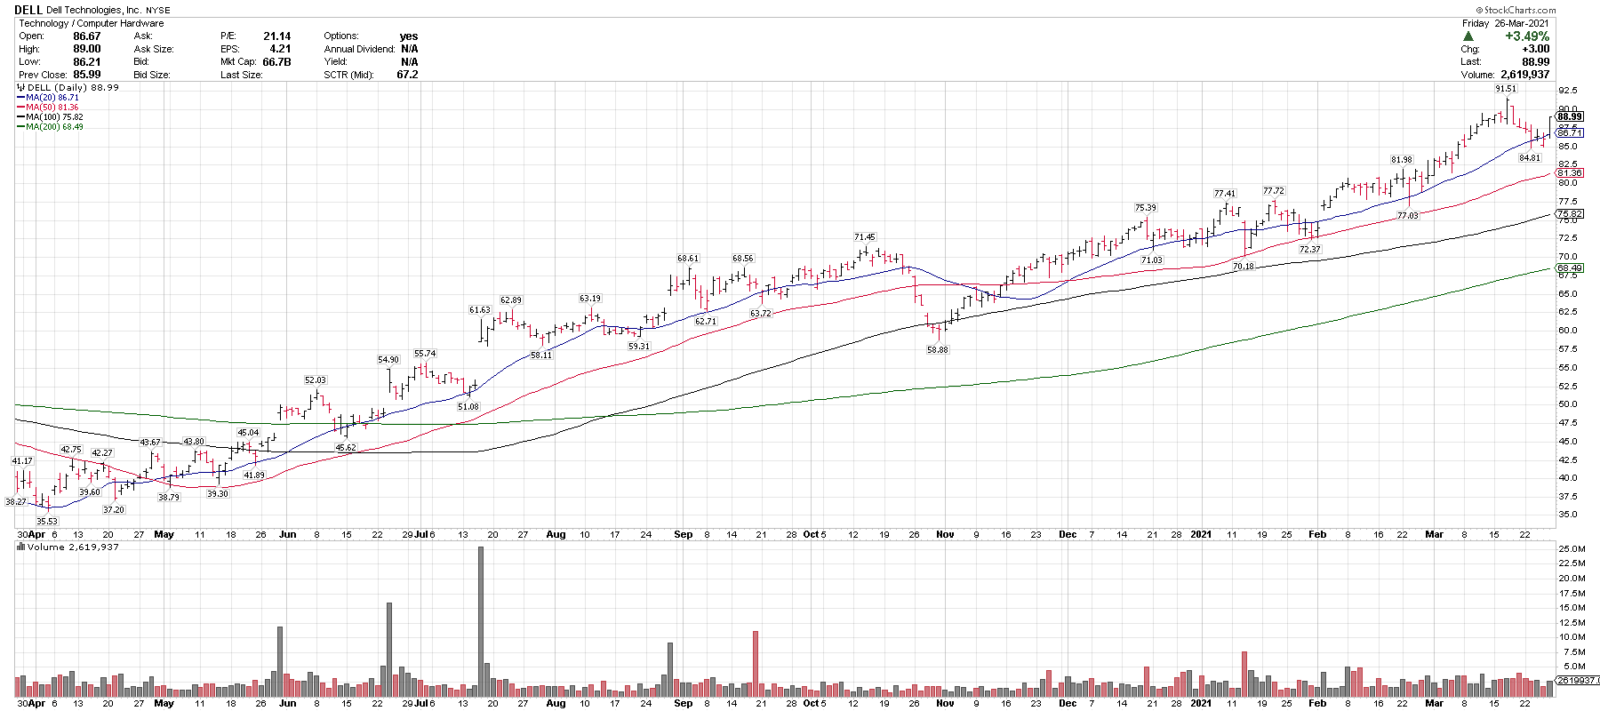
3/29/21
Dell Technologies, DELL
Close/Pre: 88.99
Stop: 74.74
DELL is in an uptrend above 4 rising MAs, is leading the tech sector YTD and recently pulled back 7.3% off of new highs. 80-85 is support, over 92.50 could signal a breakout.
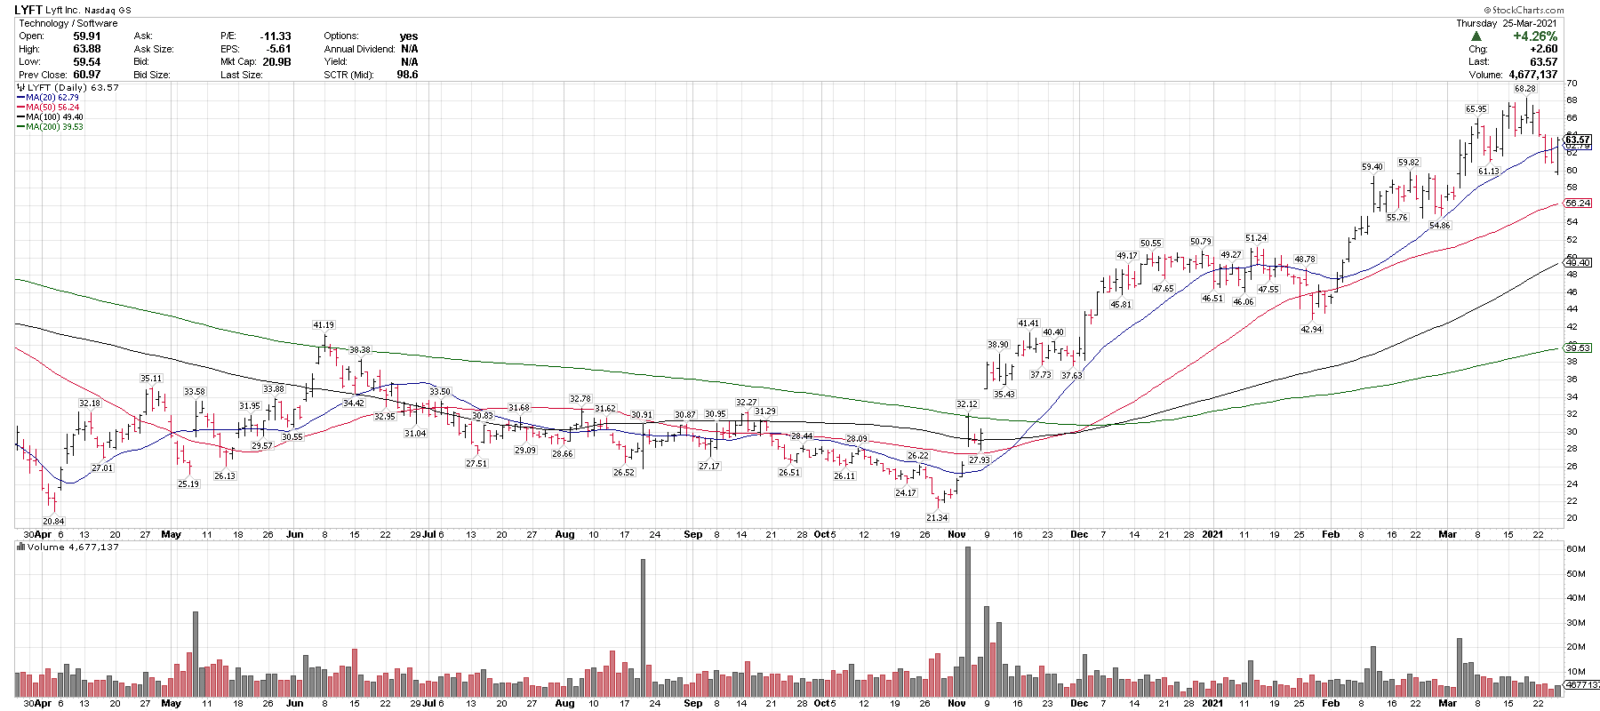
3/26/21
Lyft Inc., LYFT
Close: 63.57
Pre: 63.85
Stop: 53.39
LYFT is in an uptrend above 4 rising MAs, is the #3 tech large cap YTD and recently pulled back 10.7% off of 20-month highs. LYFT is also a core re-opening idea.
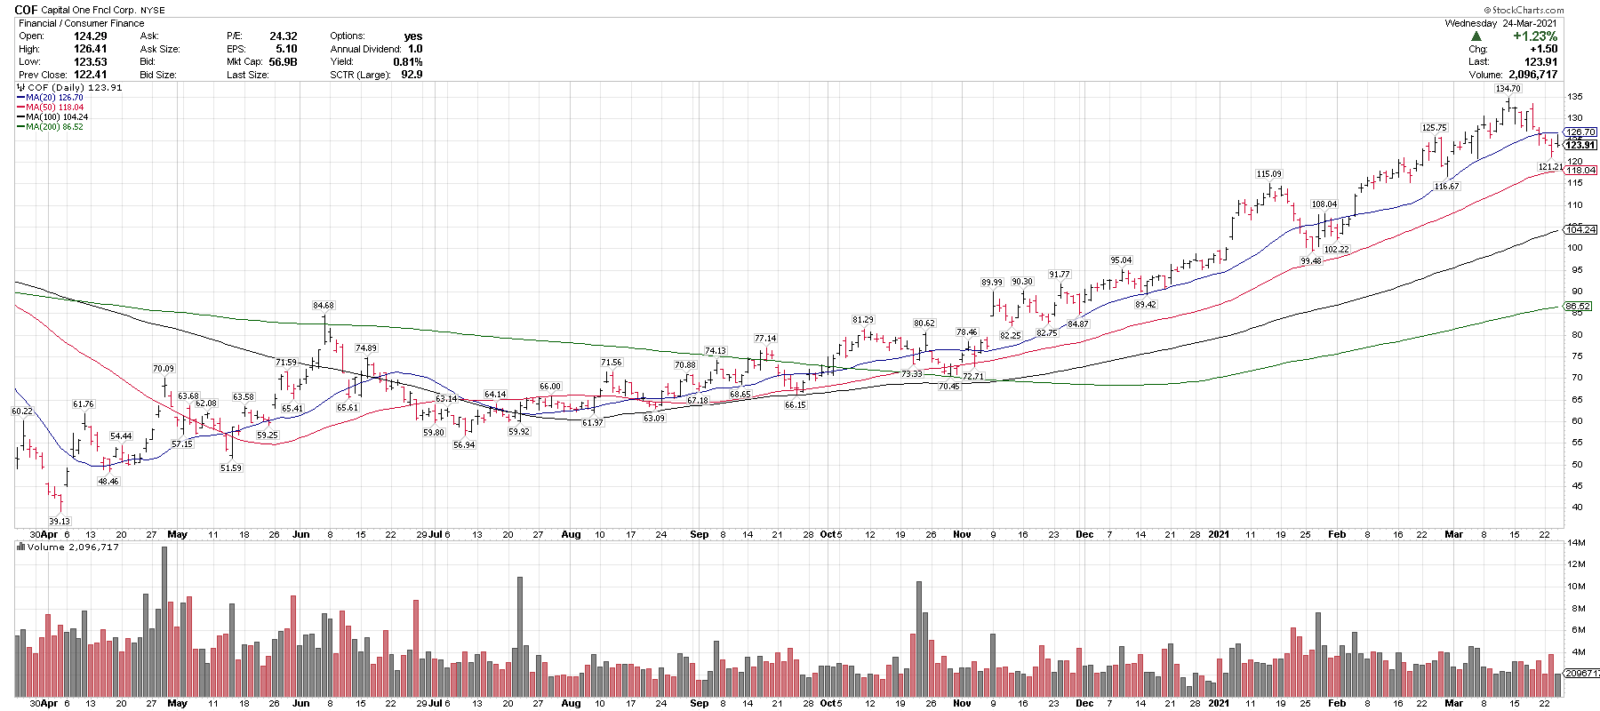
3/25/21
Capital One, COF
Close/Pre: 123.92
Stop: 103.98
COF is in an uptrend above 3 rising MAs and recently pulled back 10% off of new highs into the rising 50-sma. 110-115 is support on any pullbacks, over 135 could signal a breakout.
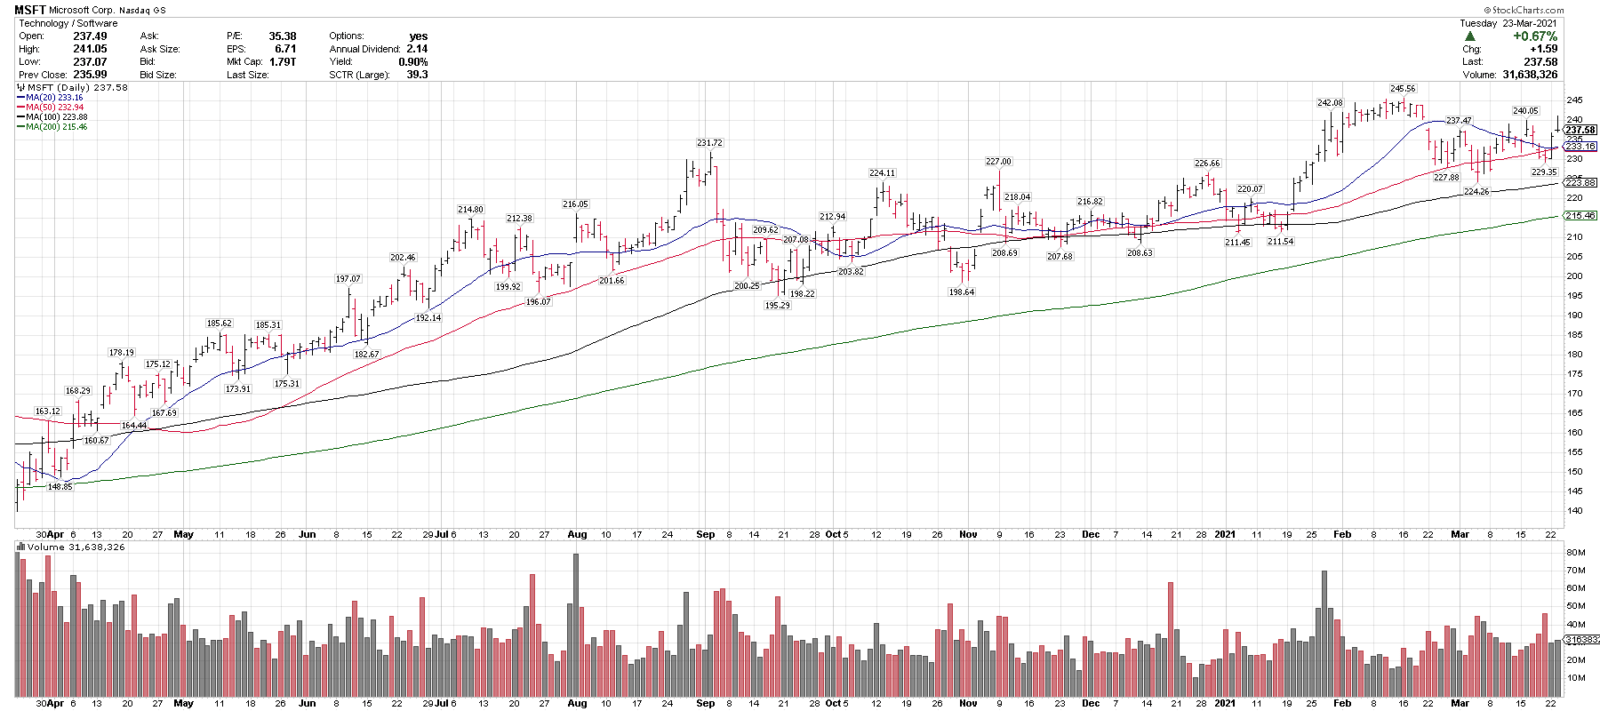
3/24/21
3/24/21
Microsoft, MSFT
Close: 237.58
Pre: 238.65
Stop: 199.46
MSFT is trading in a longer-term uptrend above 4 rising MAs & recently pulled back 8.6% off of all-time highs. 220-225 is support and over 145 could signal a breakout.
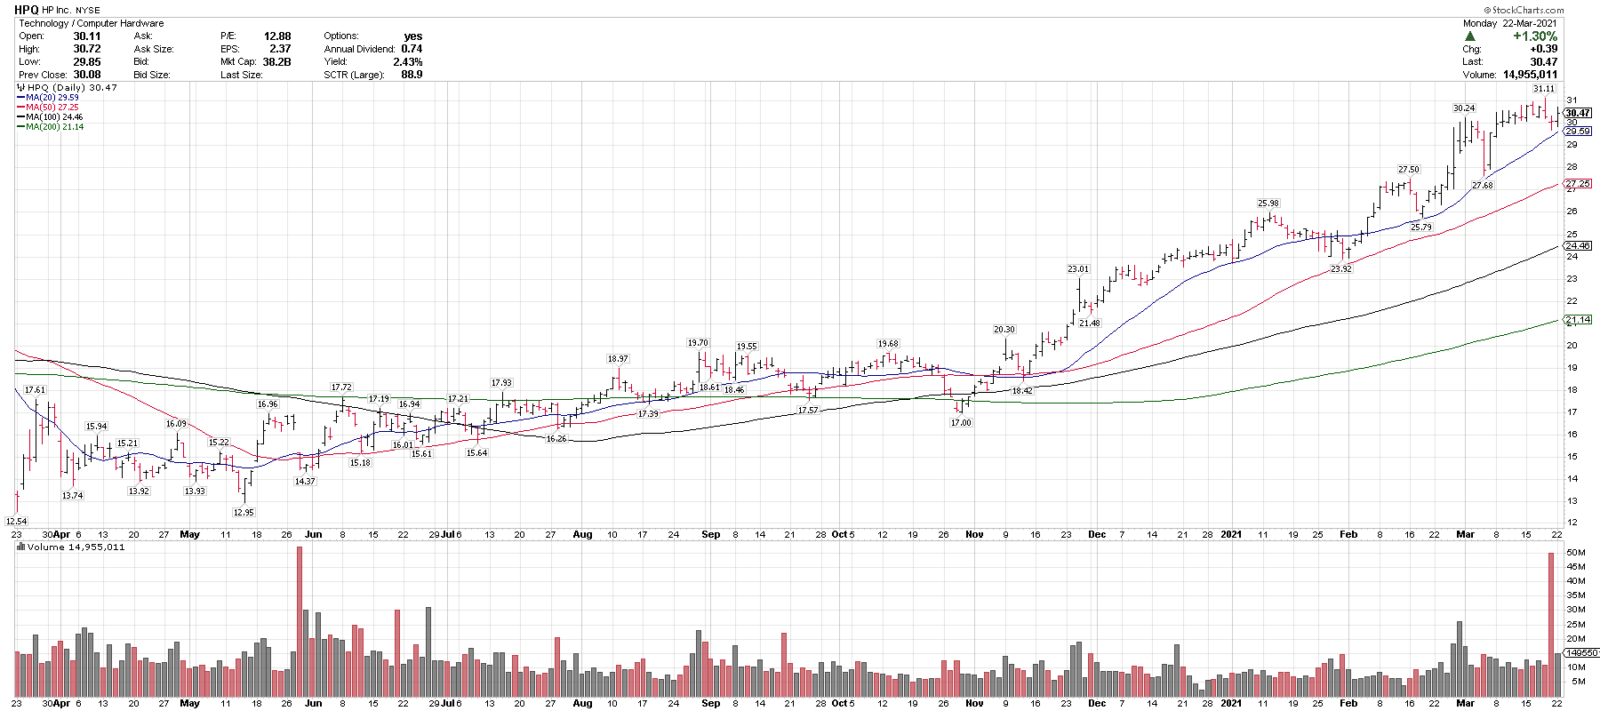
3/23/21
HP Inc., HPQ
Close/Pre: 30.47
Stop: 25.49
HPQ is an uptrend above 4 rising MAs and is leading the tech sector YTD. It recently pulled back 4% off of all-time highs. 26-28 is support and over 31 could signal a breakout. Is on this week’s Top 25 list.
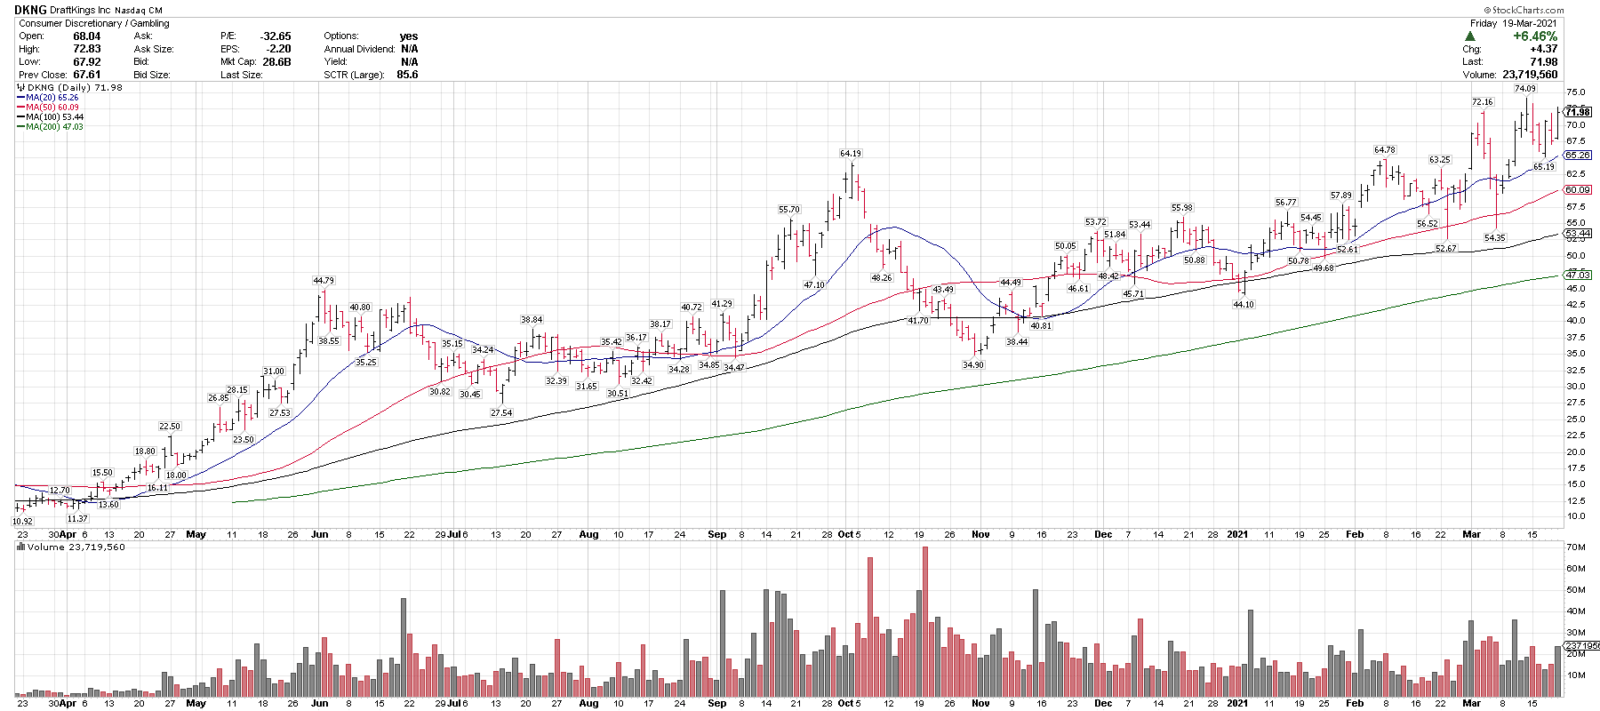
3/22/21
DraftKings, DKNG
Close: 71.98
Pre: 73.01
Stop: 59.74
DKNG is in an uptrend above 4 rising MAS & recently pulled back 12.0% off of all-time highs into the rising 20-sma. 60-65 is support, over 75 could signal a breakout. DKNG is on this week’s Top 25 list.
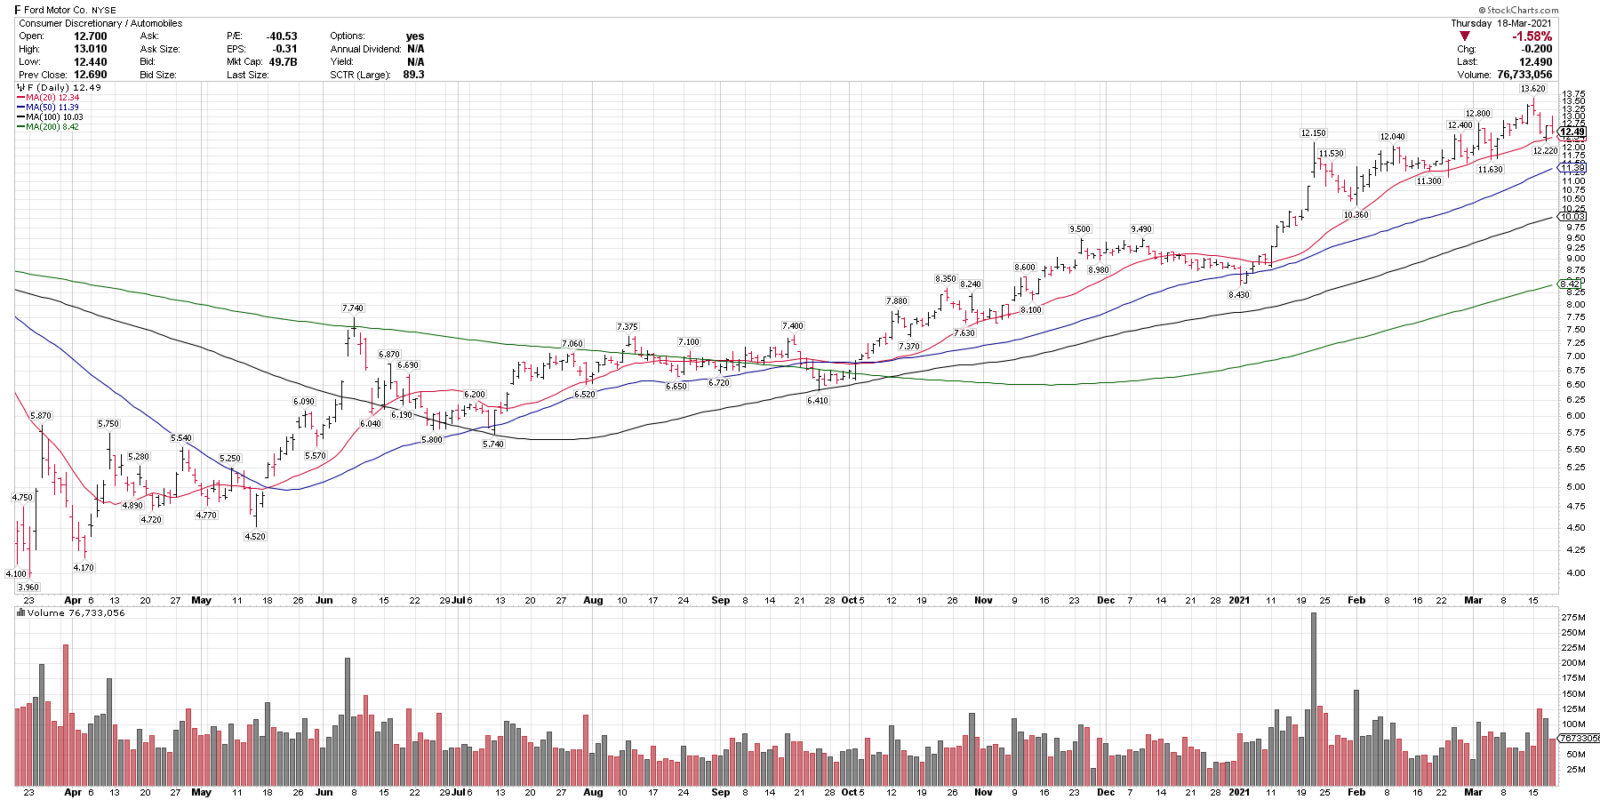
3/19/21
Ford Motor Co., F
Close: 12.49
Pre: 12.94
Stop: 10.48
F is in an uptrend above 4 rising MAS & recently pulled back 10.2% off of multi year highs. 11-12 is key support and over 13.50 could signal a breakout higher.
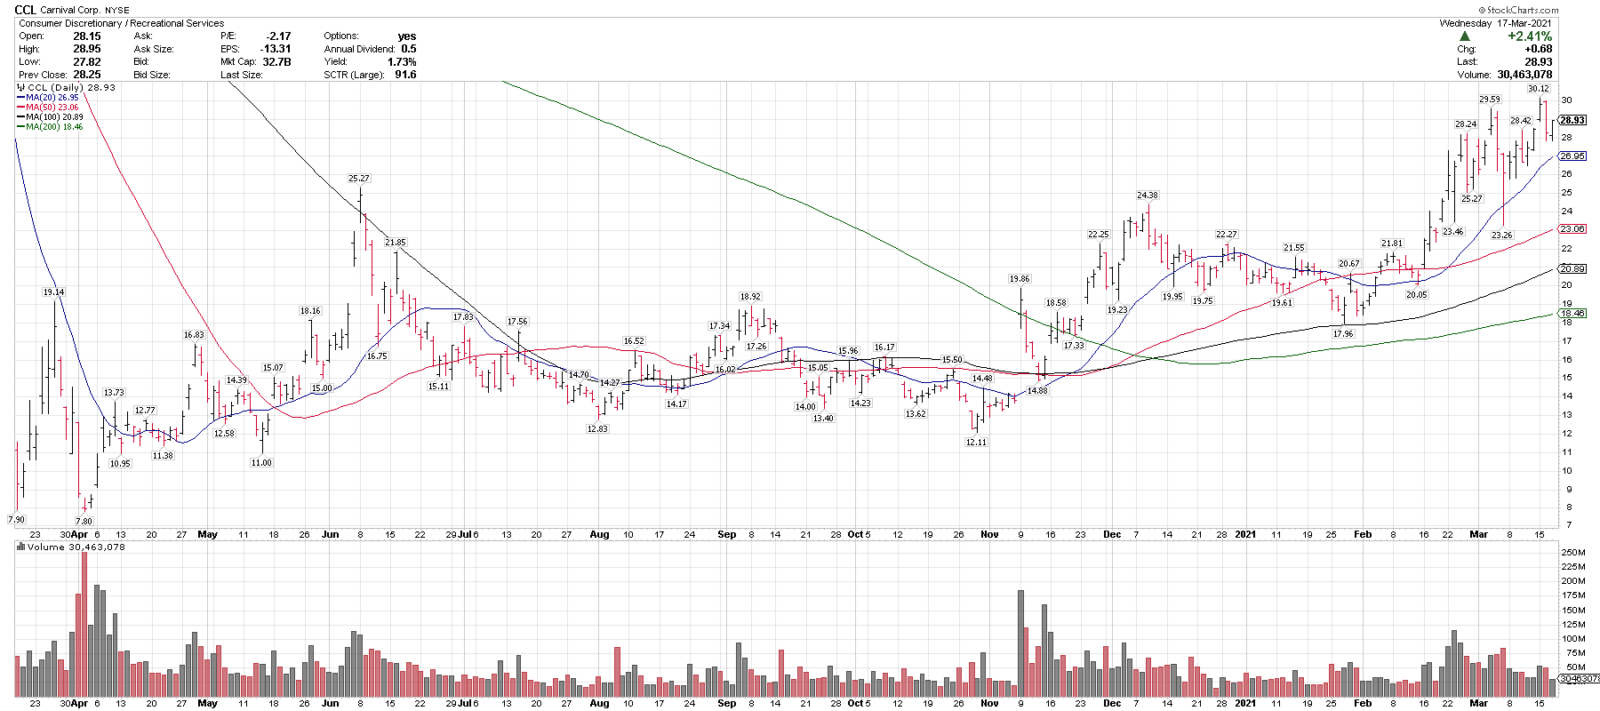
3/18/21
Carnival Corp, CCL
Sector: Consumer Discretionary
Close: 28.93
Pre: 29.52
Stop: 23.91
CCL is in an uptrend above 4 rising MAs & recently pulled back 7.6% off of 52-week highs. 24-26 is support, over 30 could signal a breakout. On this week’s Top 25 list.
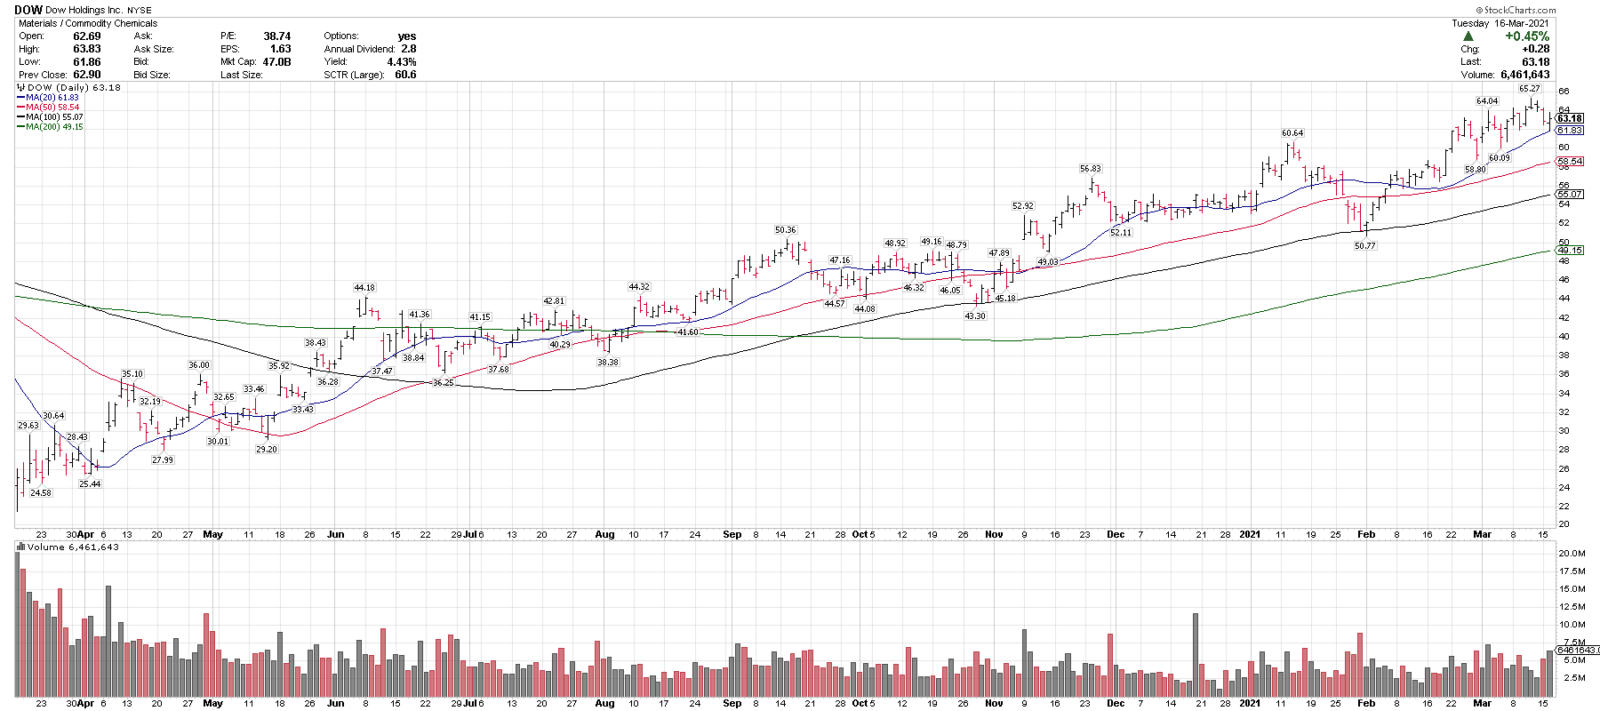
3/17/21
Dow Holdings, DOW
Sector: Materials
Close: 63.18
Pre: 63.55
Stop: 53.64
DOW is in an uptrend above 4 rising MAs and recently pulled back 5.2% off of new highs into the rising 20-sma. DOW is a lower volatility materials/cyclical chart. 56-60 is support, over 66 could signal a breakout.
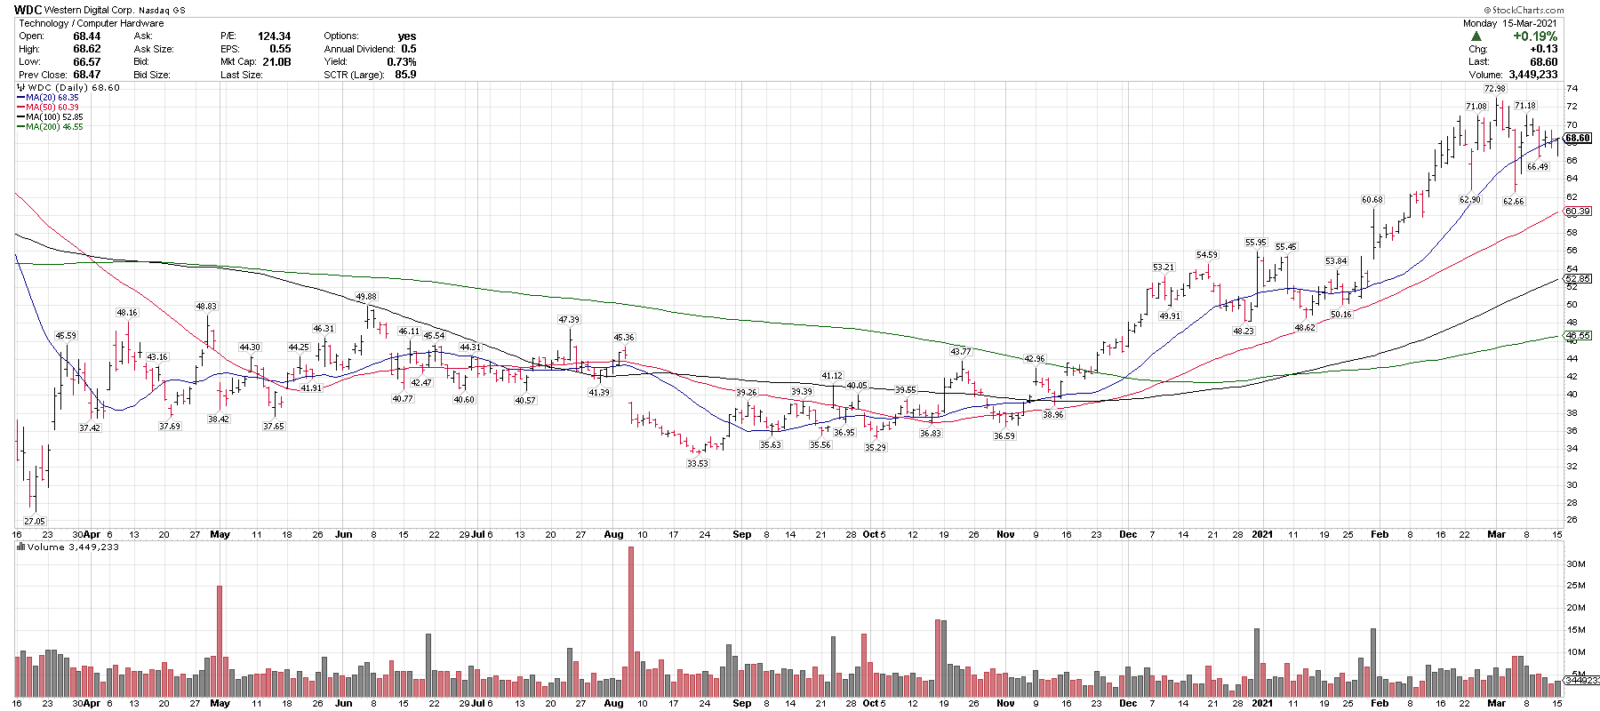
3/16/21
Western Digital, WDC
Sector: Technology
Close: 68.60
Pre: 69.16
Stop: 57.62
WDC is in an uptrend above 4 rising MAs and recently pulled back 14.1% off of 30 month highs. 60-62 is support and over 74 could signal a breakout. Is on this week’s Top 25 list.
3/15/21
Chart of the Day (also Chart of the Week)
Marriott International, MAR
Close: 150.20
Pre: 152.84
Stop: 124.86
MAR is in an uptrend above 4 rising MAs & recently pulled back 13.1% off all-time highs.
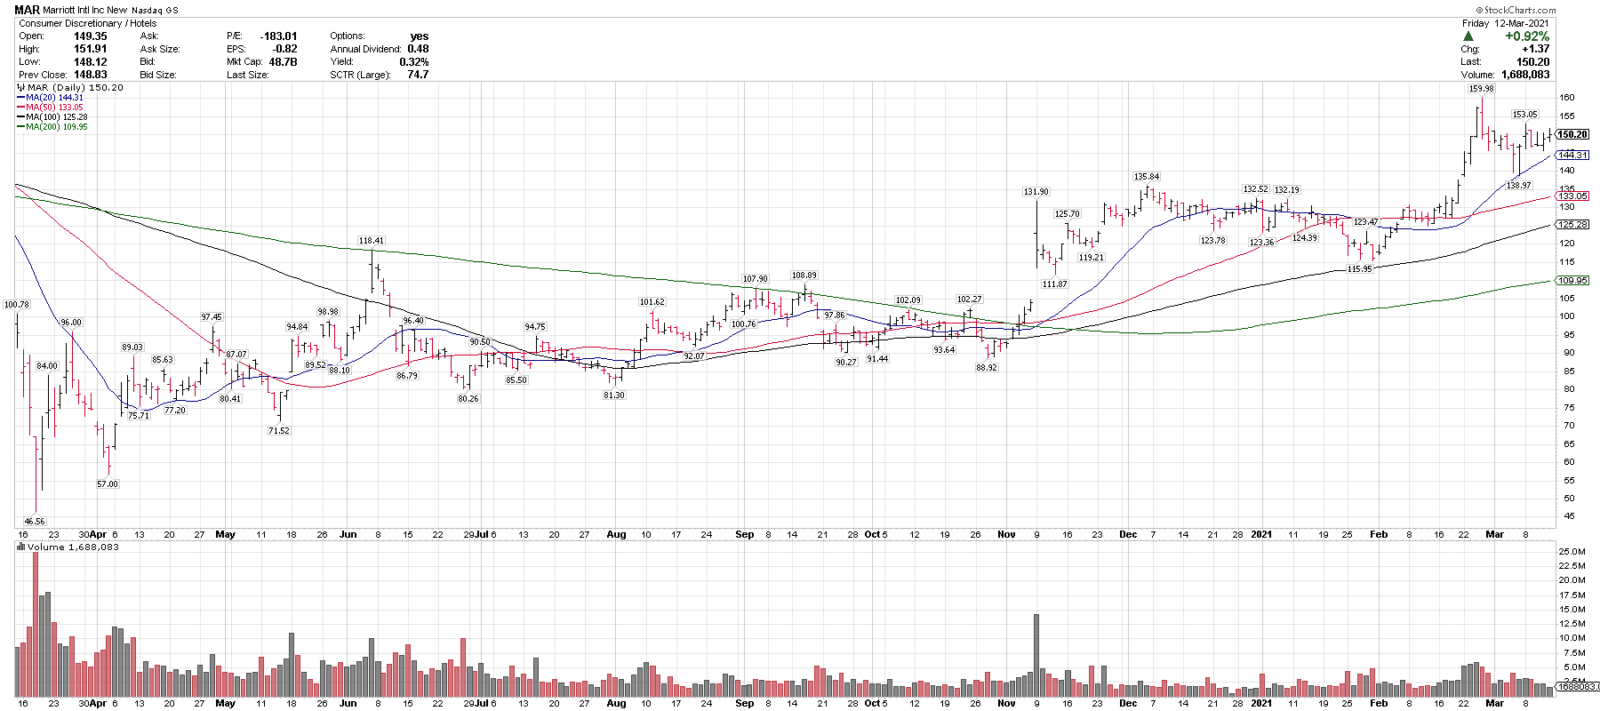
03/14/21
Blue Chip Daily Chart of the Week:
Marriott International, MAR
Close: 150.20
Stop level for position traders and investors: 124.86
please see chart analysis below

- Marriott International (MAR) is one of our top technical ideas coming into the week and is on this week’s Members Top 25 List.
- MAR is in a technical uptrend above the rising 20, 50, 100 and 200-day moving averages, indicating an uptrend on multiple time frames.
- MAR recently pulled back 13.1% off of all-time highs and held at the rising 20-sma.
- MAR is a top cyclical and reopening idea here and is testing over a key $150 breakout level.
- We have been moving into the cyclical stocks since last August and continue to believe that this move is in the early stages.
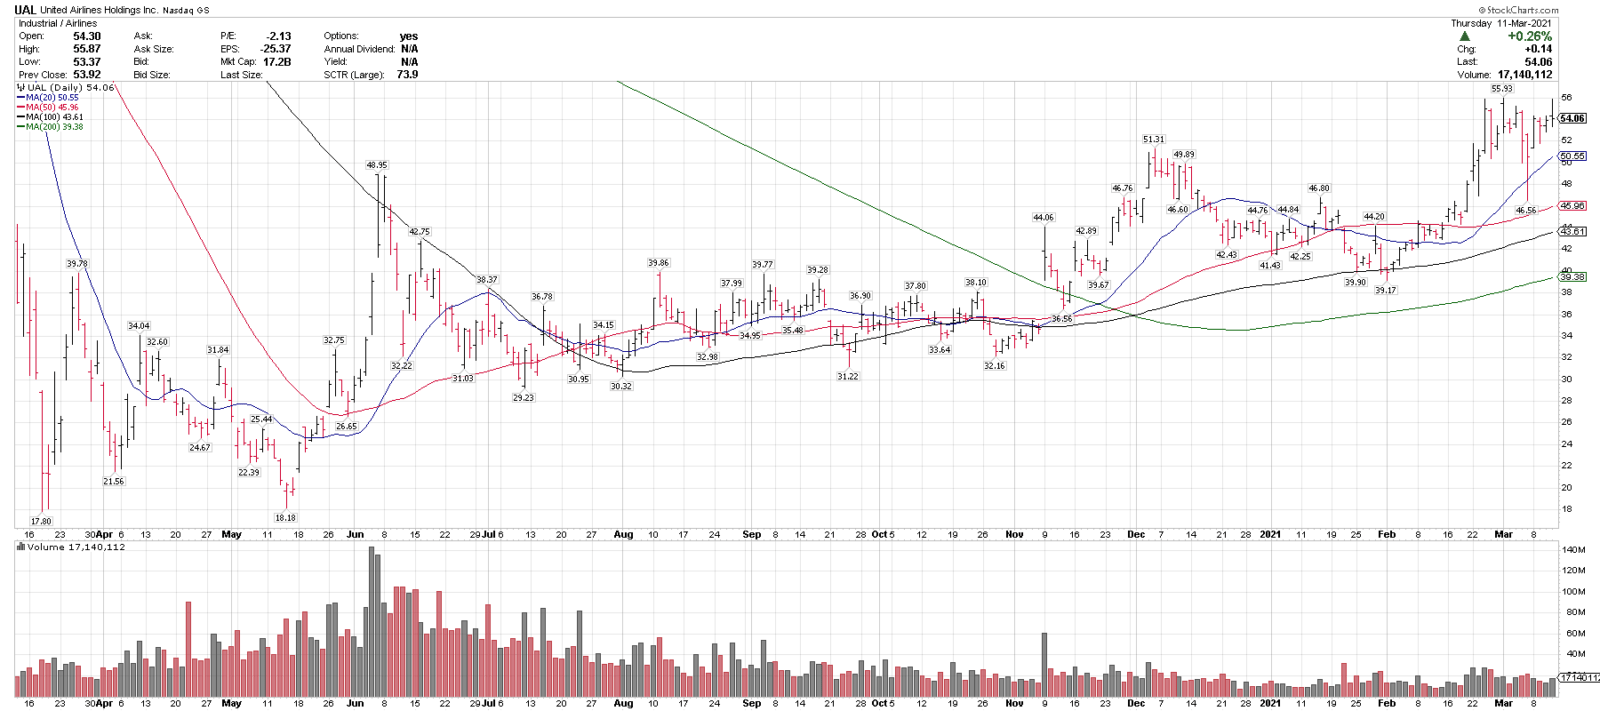
3/12/21
United Airlines, UAL
Close: 54.06
Pre: 54.36
Stop: 44.86
UAL is in an uptrend above 4 rising MAs and recently broke out to a 52-week high. 46-50 is a support level, over 56 could signal a breakout.
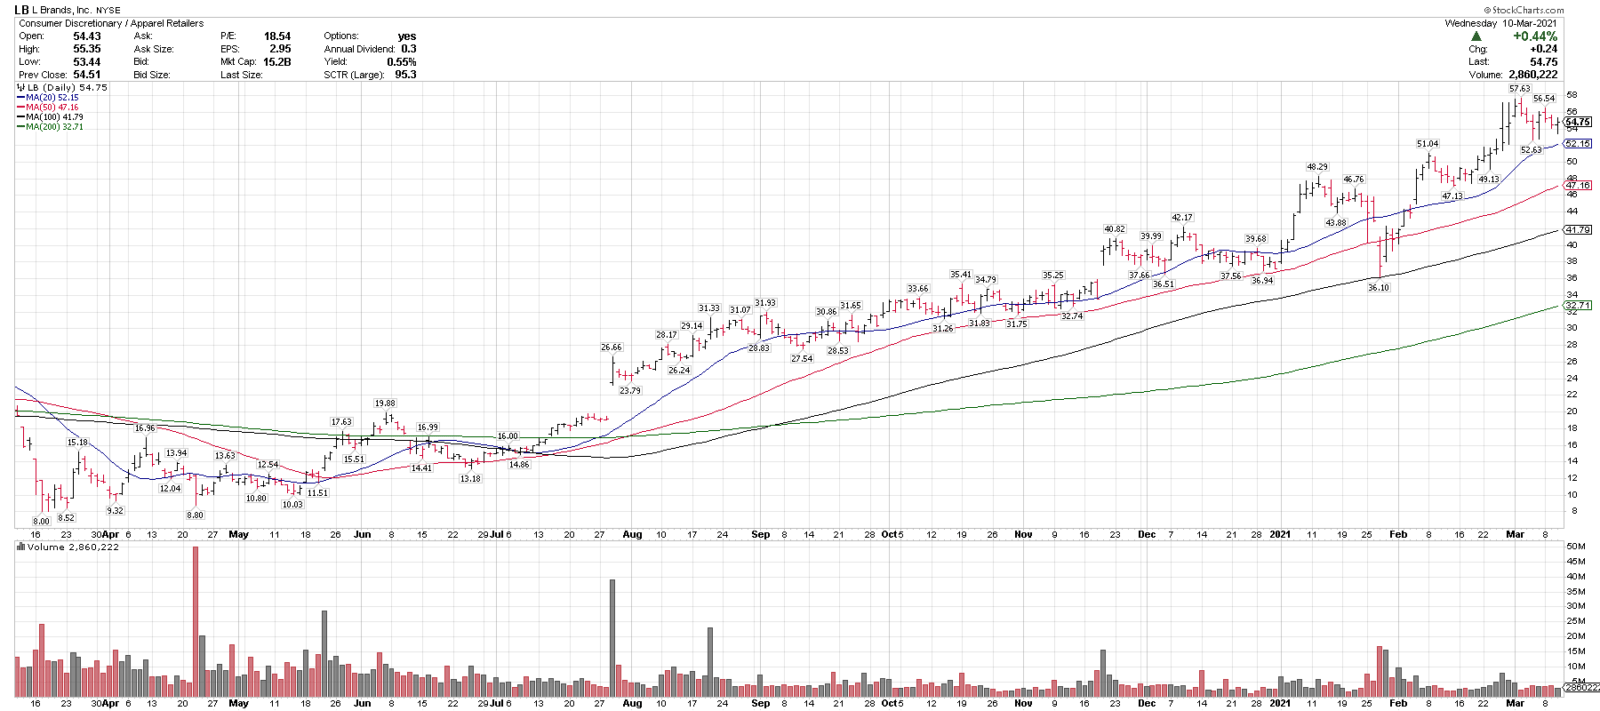
3/11/21
L Brands, Inc., LB
Close: 54.75
Pre: 55.11
Stop: 45.84
LB is in an uptrend above 4 rising MAs & recently pulled back 8.6% off of 4-year highs. 48-52 is support, over 58 could signal a breakout.
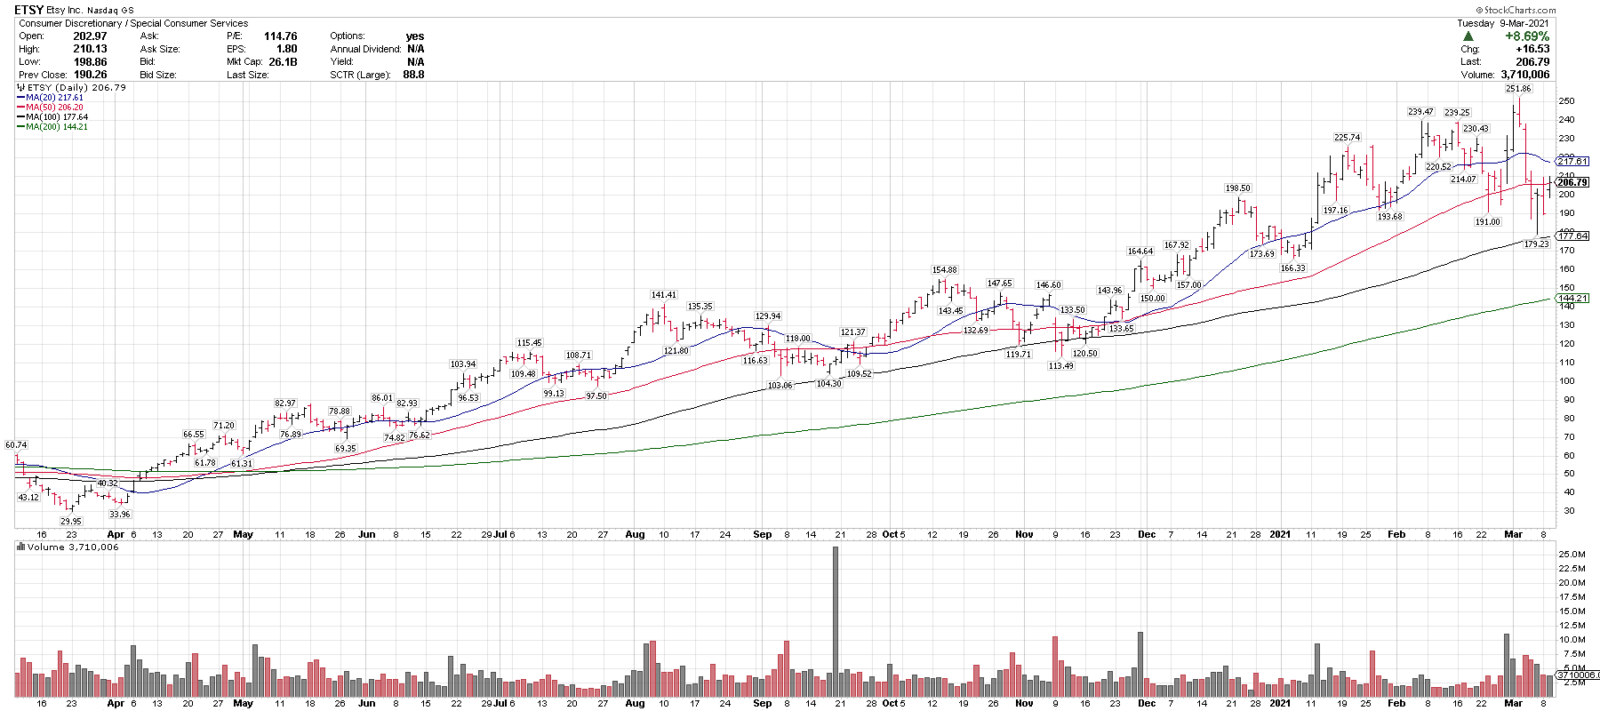
3/10/21 Best Ideas List
Etsy Inc, ETSY
Close: 206.79 (> 50-sma)
Pre: 209.76 (+1.44%)
Stop: 173.40
ETSY reclaimed the 50-sma yesterday after a 28.83% pullback from new highs. This is a higher R/R growth idea. 190 & 180 are key support levels.
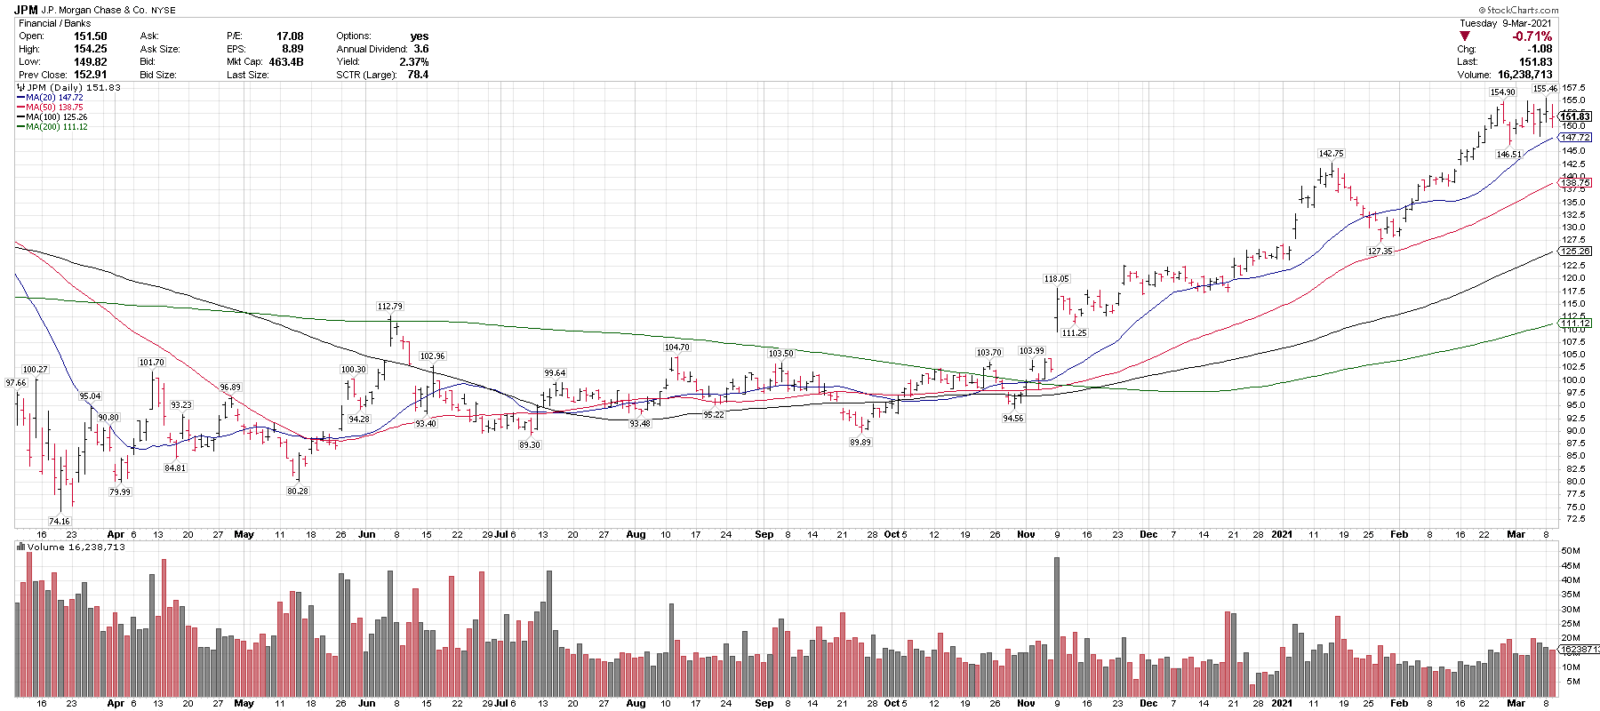
3/10/21
JP Morgan Chase, JPM
Close: 151.83
Pre: 152.95
Stop: 128.85
JPM is in an uptrend above 4 rising MAs & is testing a breakout to all time highs. 145 is near-term support and the rising 50-sma is a key trend gauge. JPM is on this week’s Top 25 list.
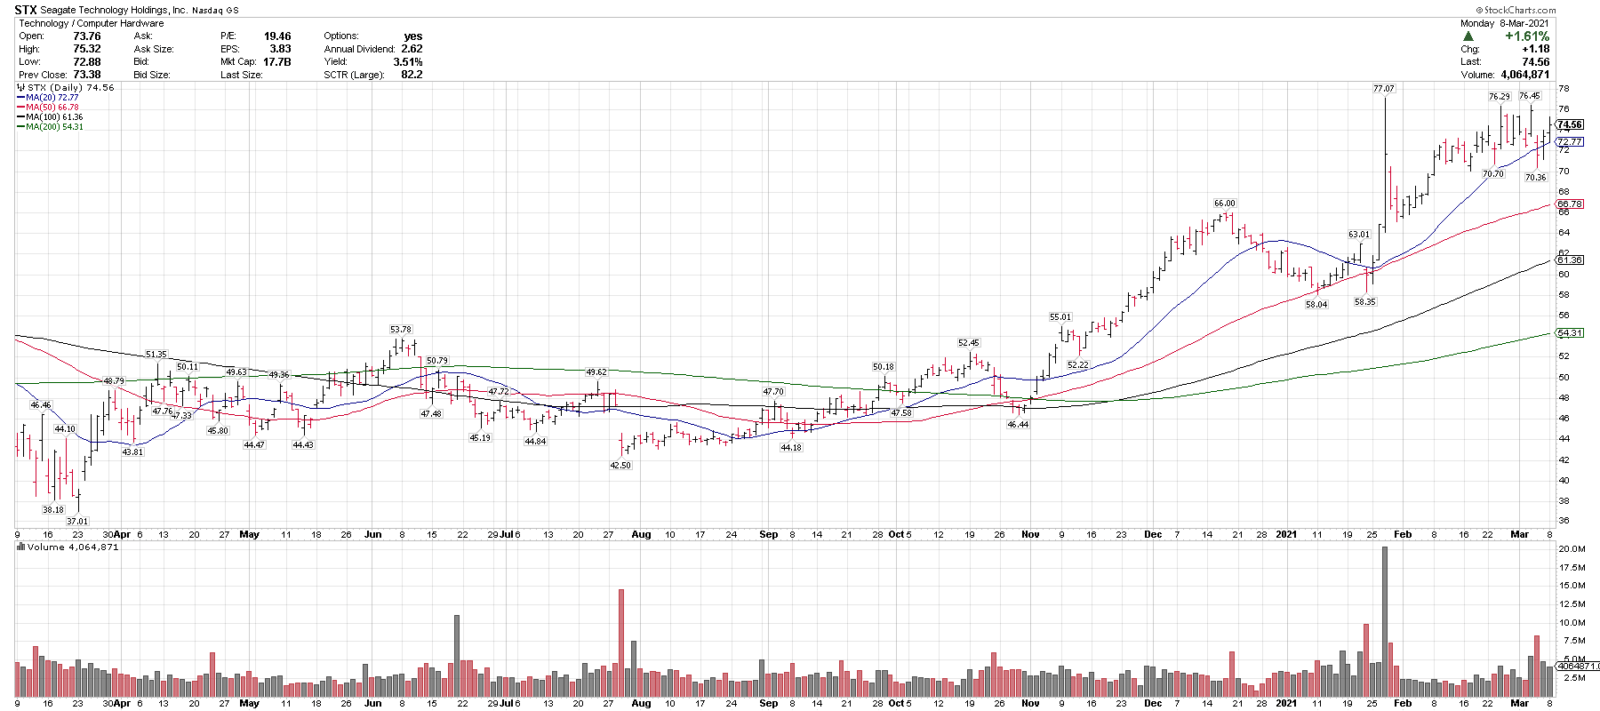
3/9/21
Seagate Technology, STX
Close: 74.56
Pre: 76.09
Stop: 62.63
STX is in an uptrend above 4 rising MAs & recently pulled back 7.9% into the rising 20-sma. 66-70 is a support range. 76-78 is a breakout level. One of the stronger tech charts on my screen.
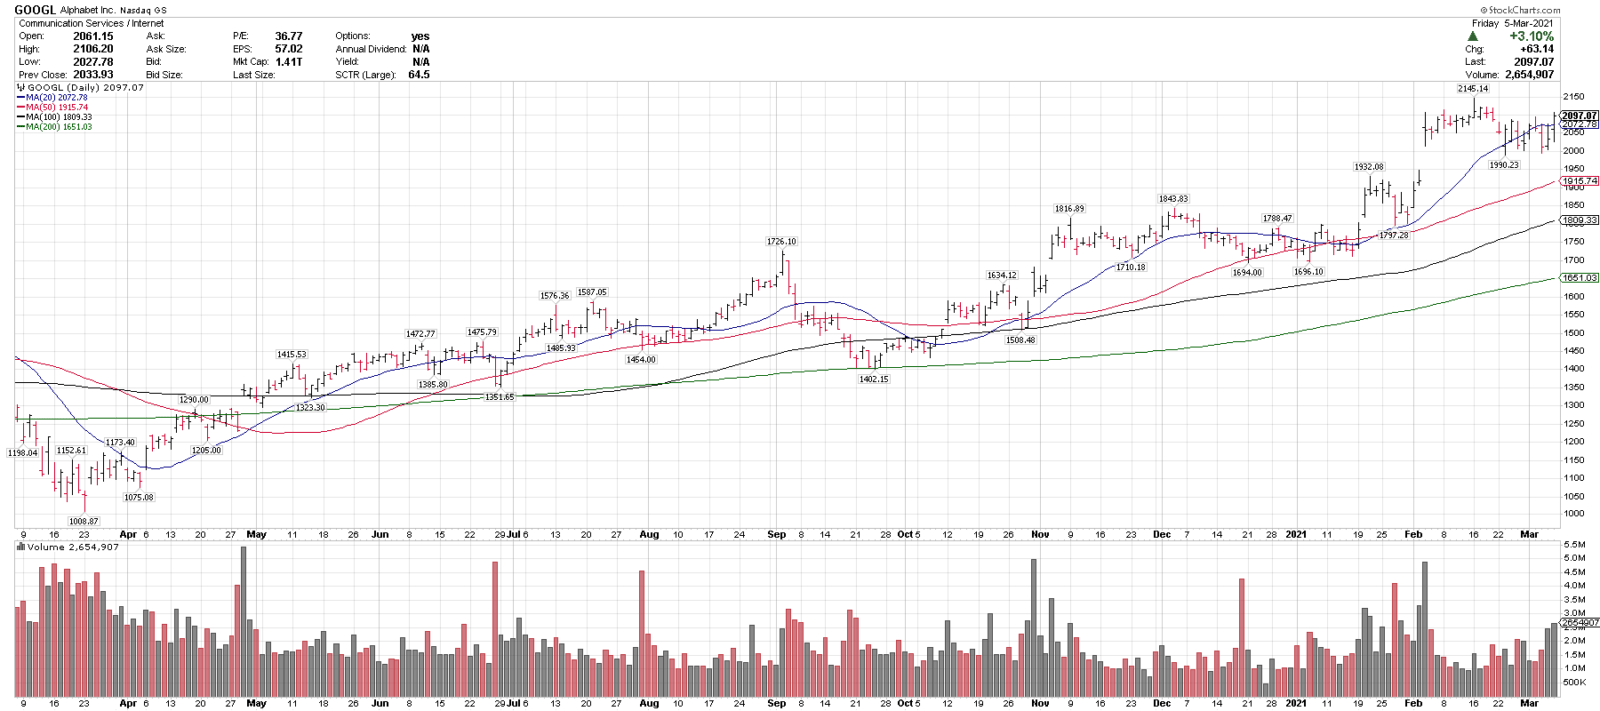
3/8/21
Google, GOOGL
Close: 2097.07
Pre: 2085.74 (-.54%)
Stop: 1782.45
GOOGL is in an uptrend above 4 rising MAs, and recently pulled back 7.2% from all-time highs. GOOGL is an out-performer YTD. 2000 & 1900 is near term support. 2150 is a potential break out level.
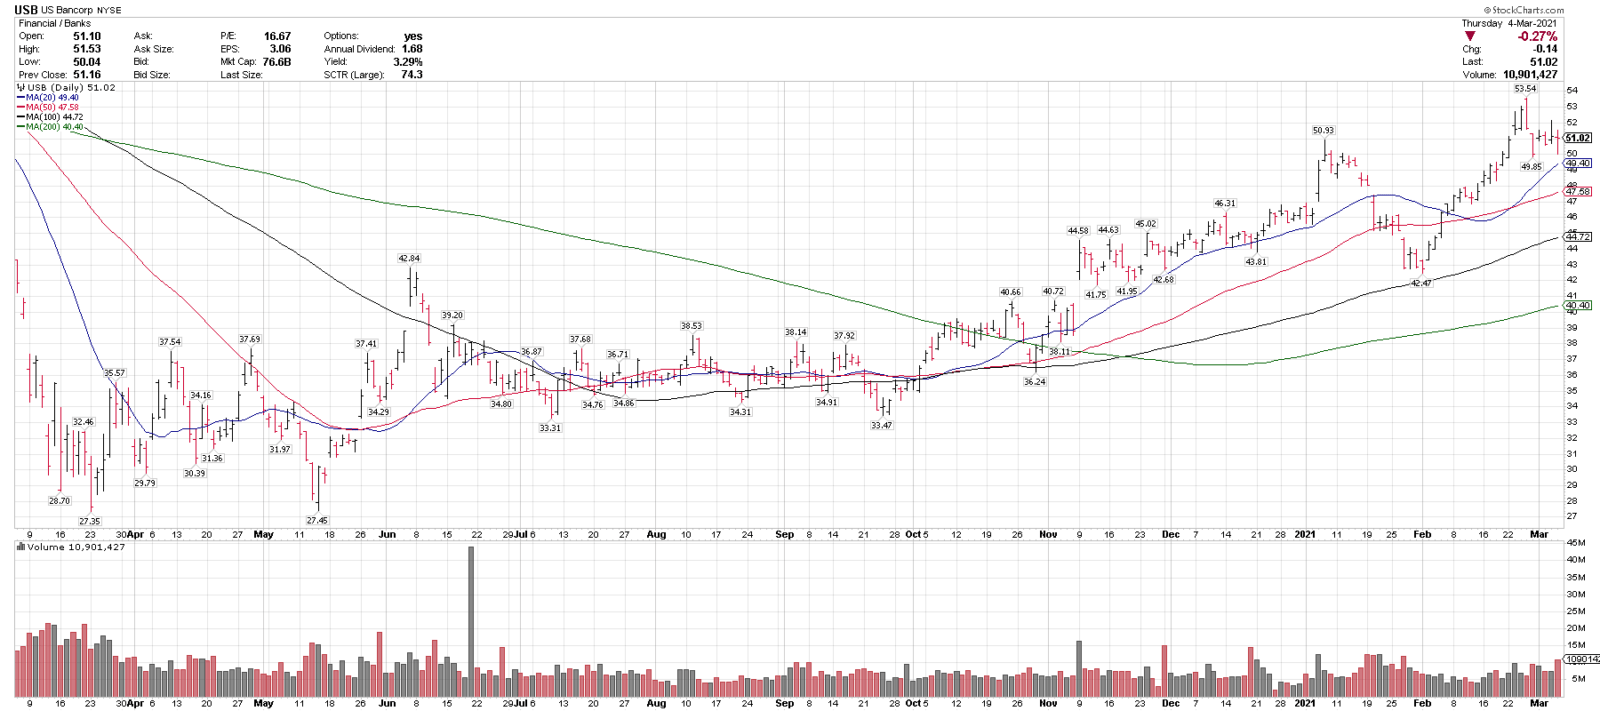
3/5/21
US Bancorp, USB
Close: 51.02
Pre: 51.16
Stop: 43.42
USB is in an uptrend above 4 rising MAs & recently pulled back 6.8% of off 52-week highs. 46-48 is support. KRE is the ETF alternative.
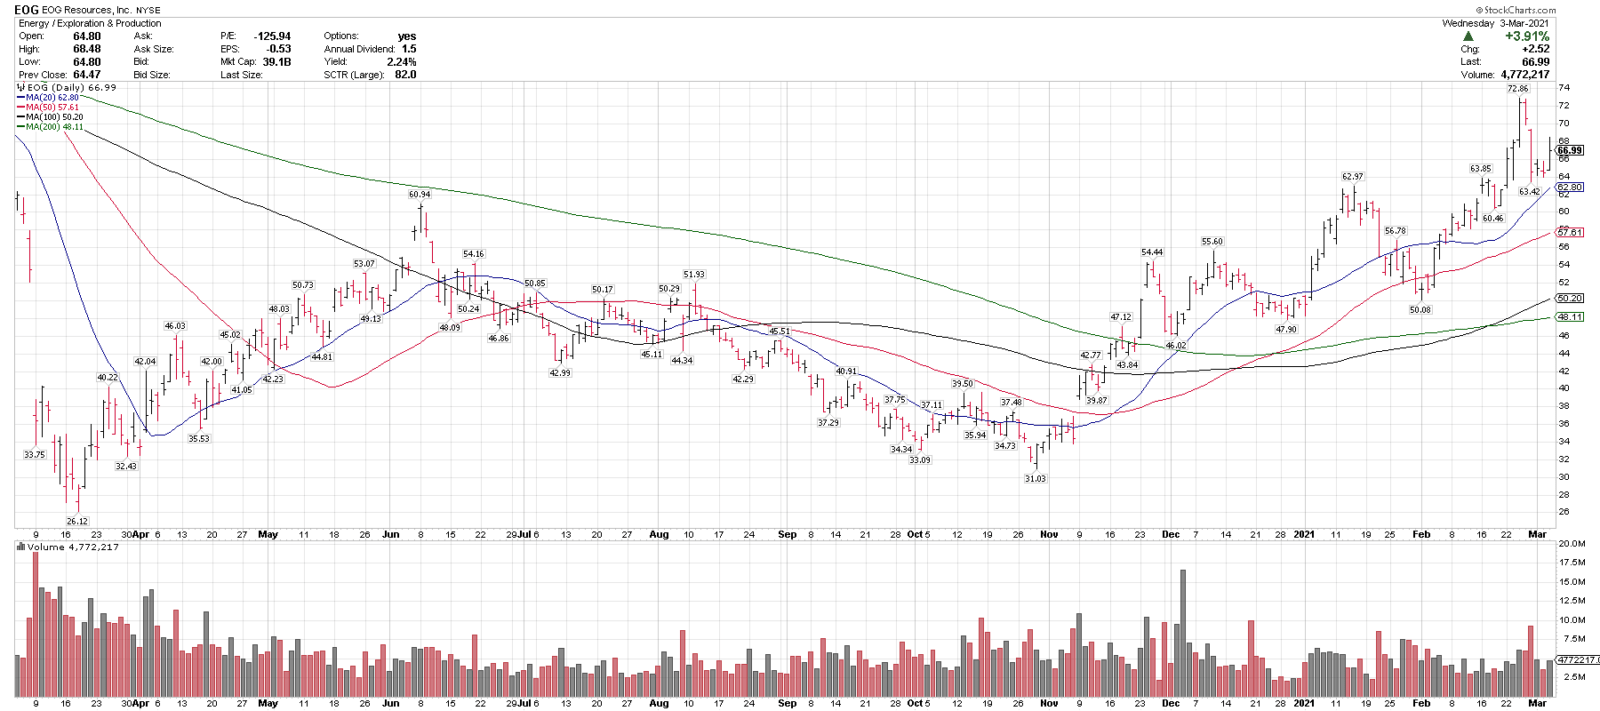
3/4/21
EOG Resources, EOG
Close: 66.99
Pre: 67.85
Stop: 55.80
EOG is in an uptrend above 4 rising MAs. It recently pulled back 12.9% and held over the 20-sma. 58-64 is a support range.
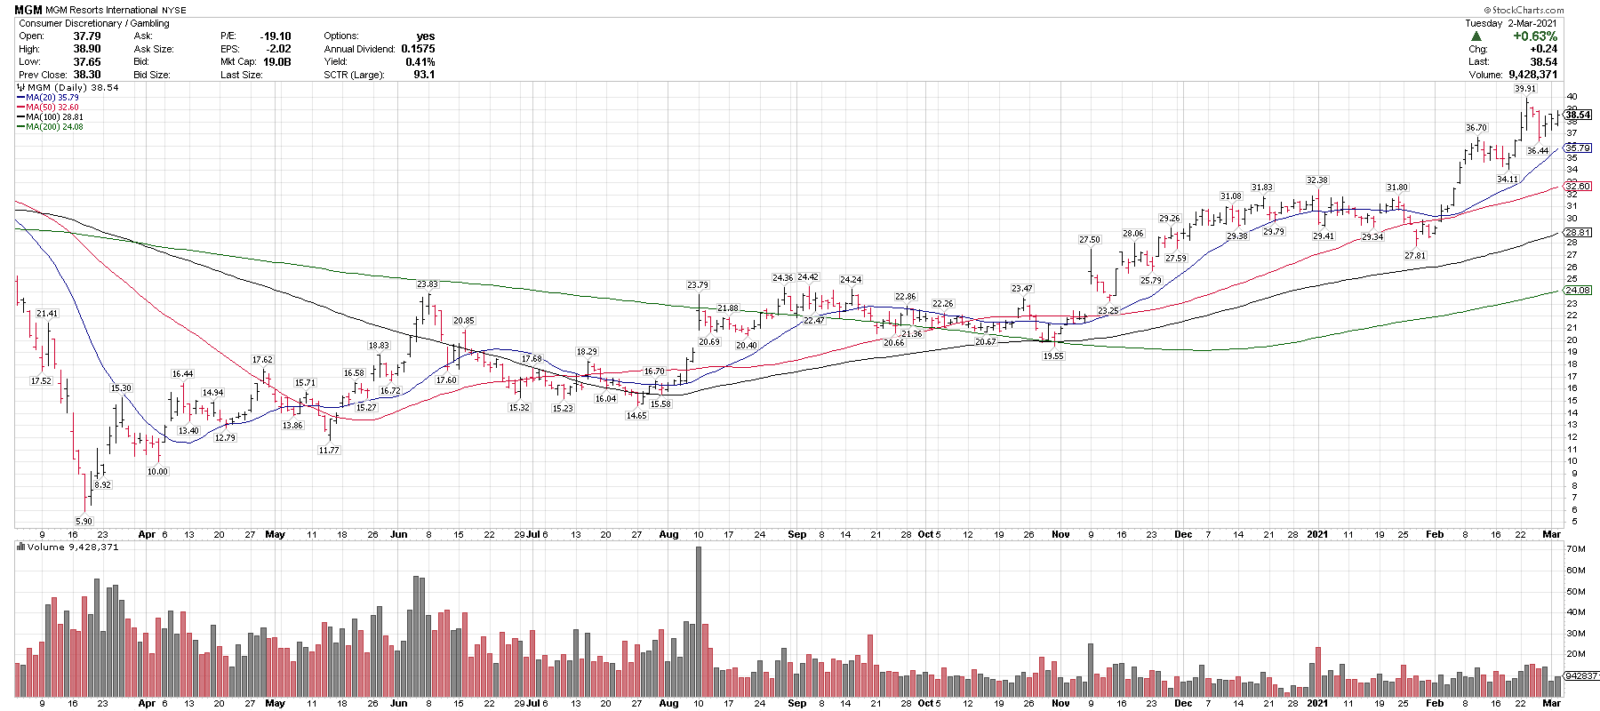
3/3/21
MGM Resorts International, MGM
Close: 38.54
Pre: 39.26
Stop: 32.37
MGM is in an uptrend above 4 rising MAs & recently pulled back 8.6% off of multi-year highs. It is breaking out on the monthly chart and is set up well for a potential uptick in consumer spending.
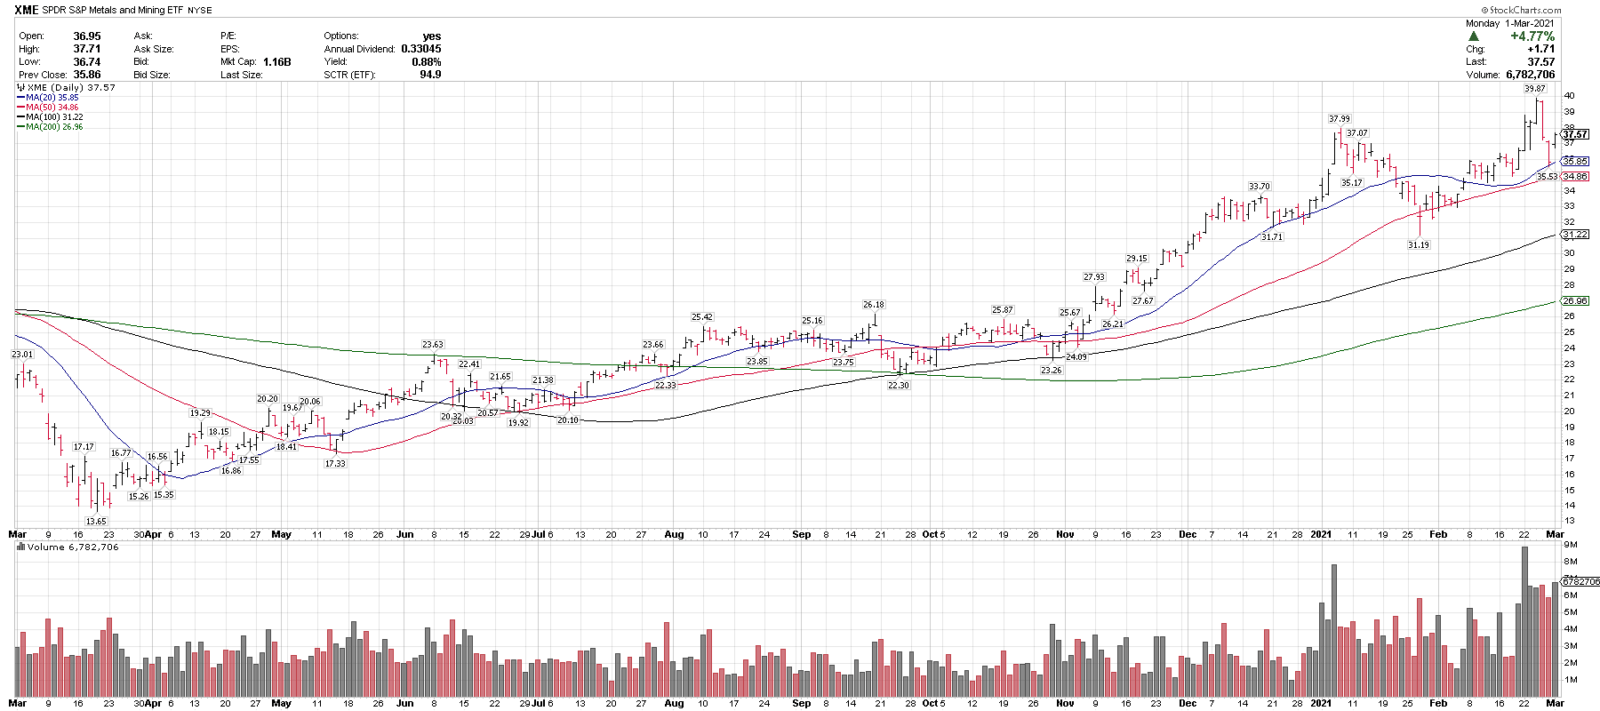
3/2/21
SPDR Metals and Mining ETF, XME
Close: 37.57
Stop: 31.93
XME is in a technical uptrend above 4 rising MAs & recently pulled back 10.8% off of 6 year highs. It is currently testing a major monthly breakout over 37.50. This ETF is well positioned for any potential cyclical follow through.
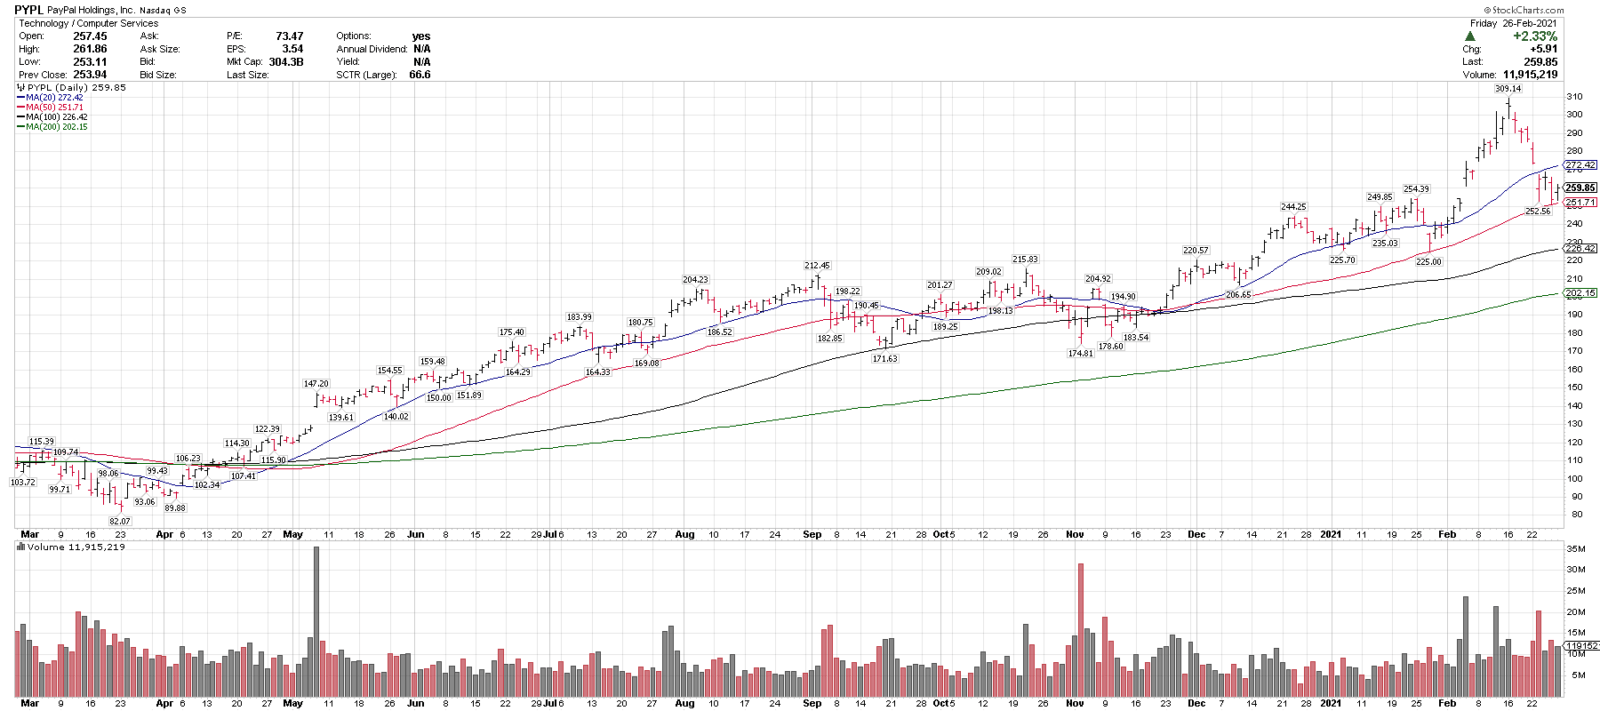
3/1/21
Paypal, PYPL
Close: 259.85
Pre: 266.10 (+2.49%)
Stop: 219.87
PYPL is on this week’s Top 25 list and is in an uptrend above rising 50, 100 & 200-sma. It recently pulled back 18.3% off all-time highs into the rising 50-sma. 240-250 is near term support.
FEBRUARY 2021 “CHART OF THE DAY”
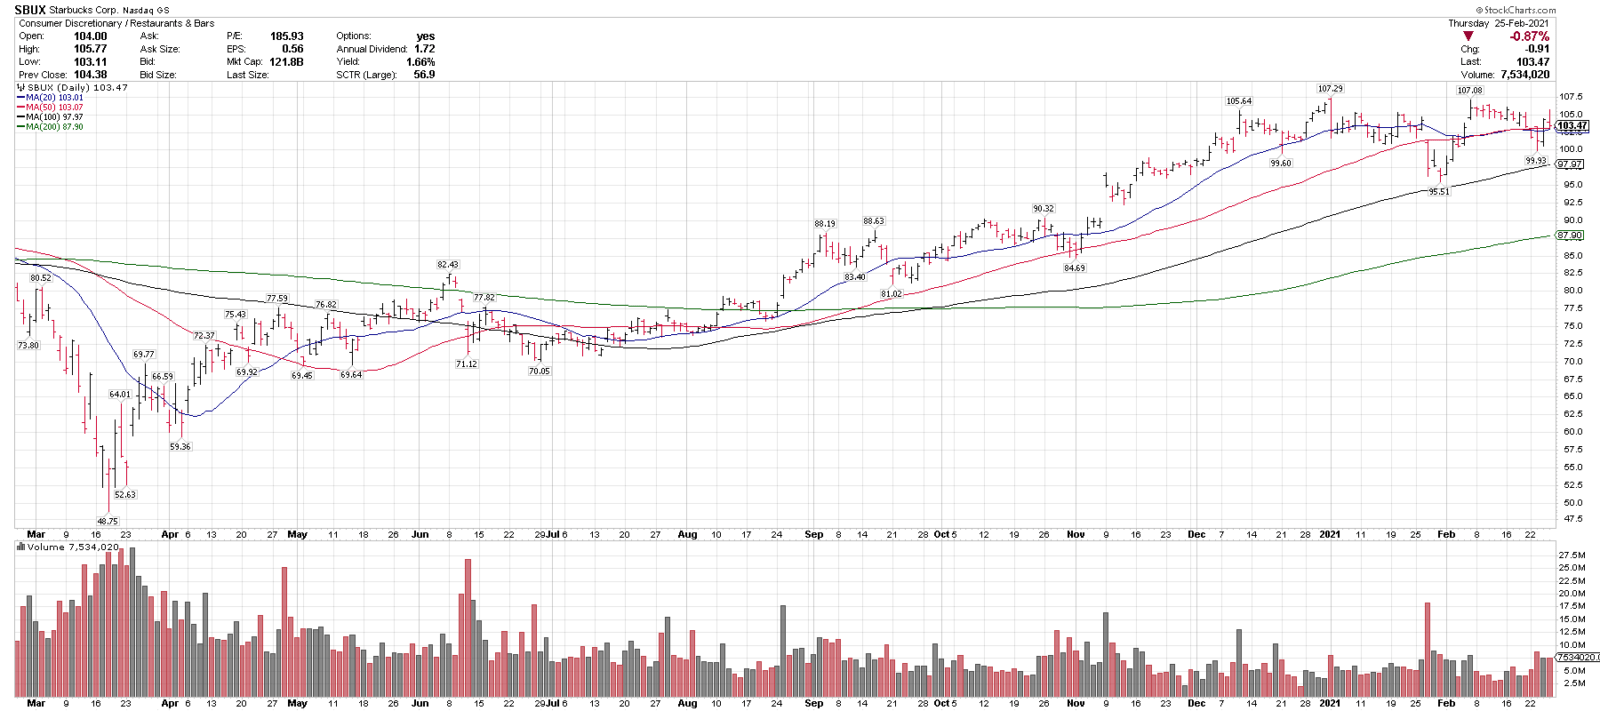
2/26/21
Starbucks, SBUX
Close: 103.47
Pre: 103.61
Stop: 87.44
SBUX is consolidating in a longer-term uptrend above 4 MAs. It recently corrected 6.6% off of all-time highs. 95-100 is key support on any pullbacks and over 107.50 could signal a breakout higher.
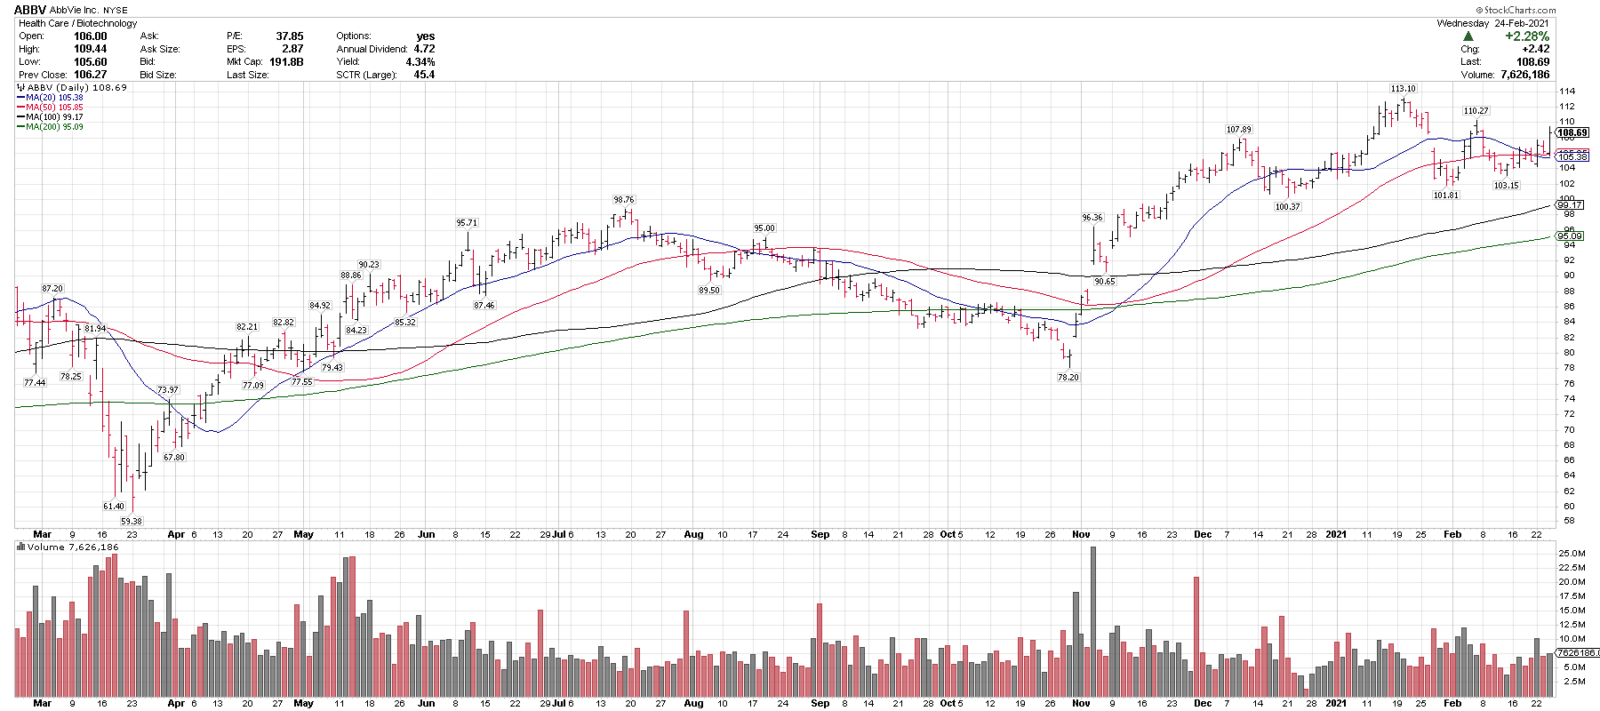
2/25/21
AbbVie, ABBV
Close: 108.69
Pre: 108.80
Stop: 92.38
ABBV is consolidating in a longer-term uptrend above 4 MAs and recently pulled back 9.98% off of all time highs. $100 is a key near-term support level & over $114 would signal a breakout.
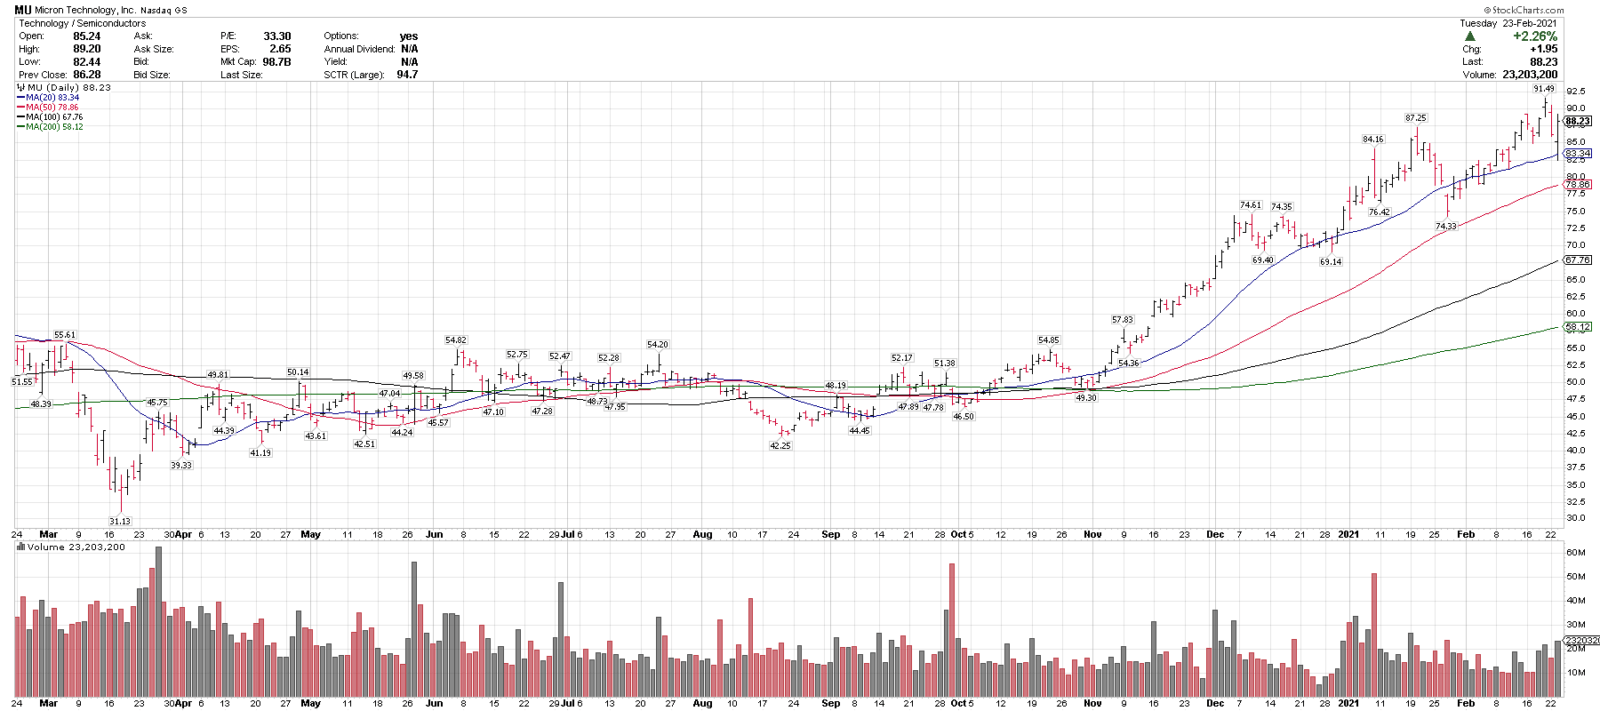
2/24/21
Micron Technology, MU
Close: 88.23
Pre: 89.75
Stop: 73.91
MU is in an uptrend above 4 rising MAs & recently pulled back 9.8% off of multi-year highs into the rising 20-sma. 82.50 & 75.00 are support levels & over 92.50 could signal a breakout. On this week’s top 25 list.
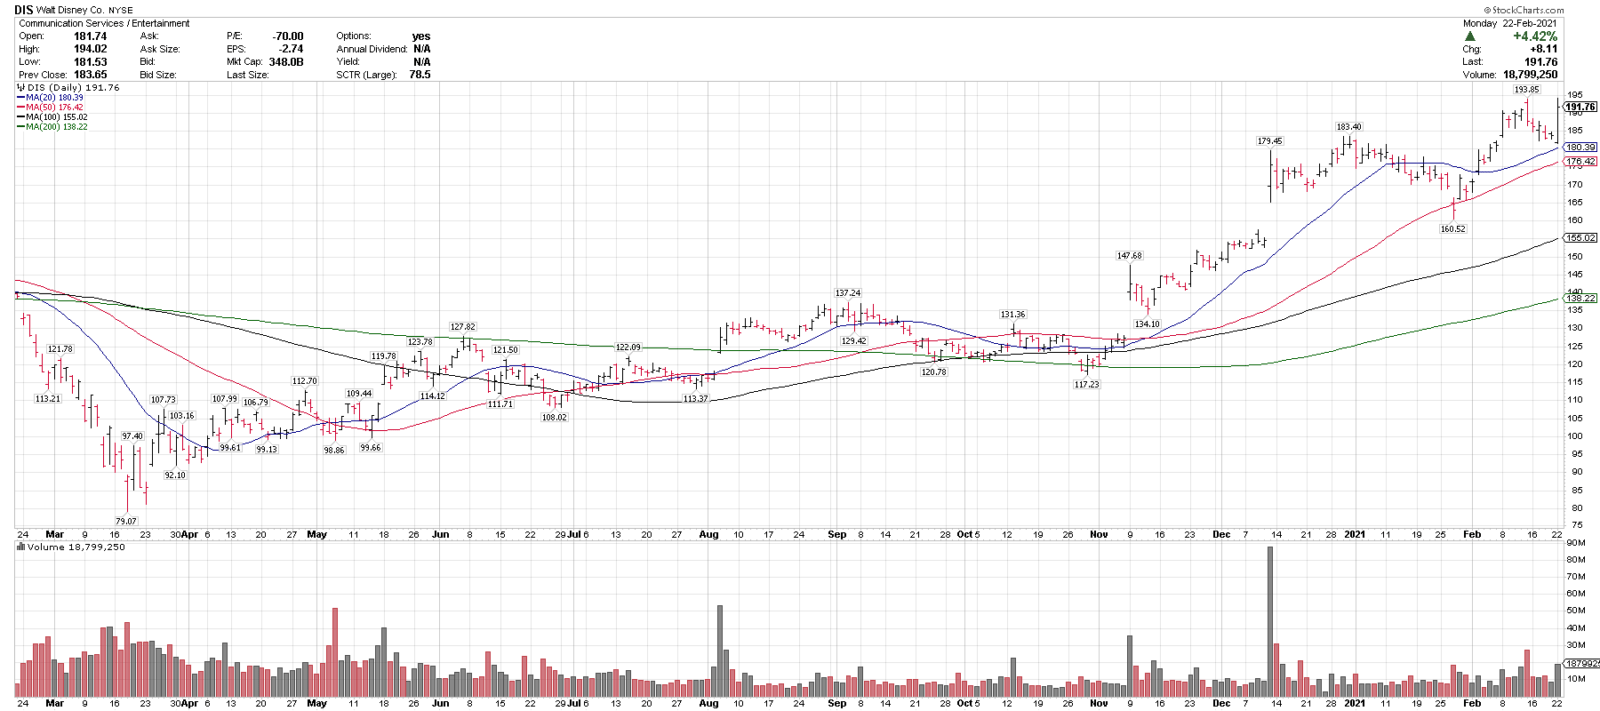
2/23/21
Walt Disney Co., DIS
Close: 191.76
Pre: 192.41
Stop: 161.42
DIS is in an uptrend above 4 rising MAS and made a new all-time closing high yesterday, giving a breakout signal. It is well positioned as a reopening name as well.
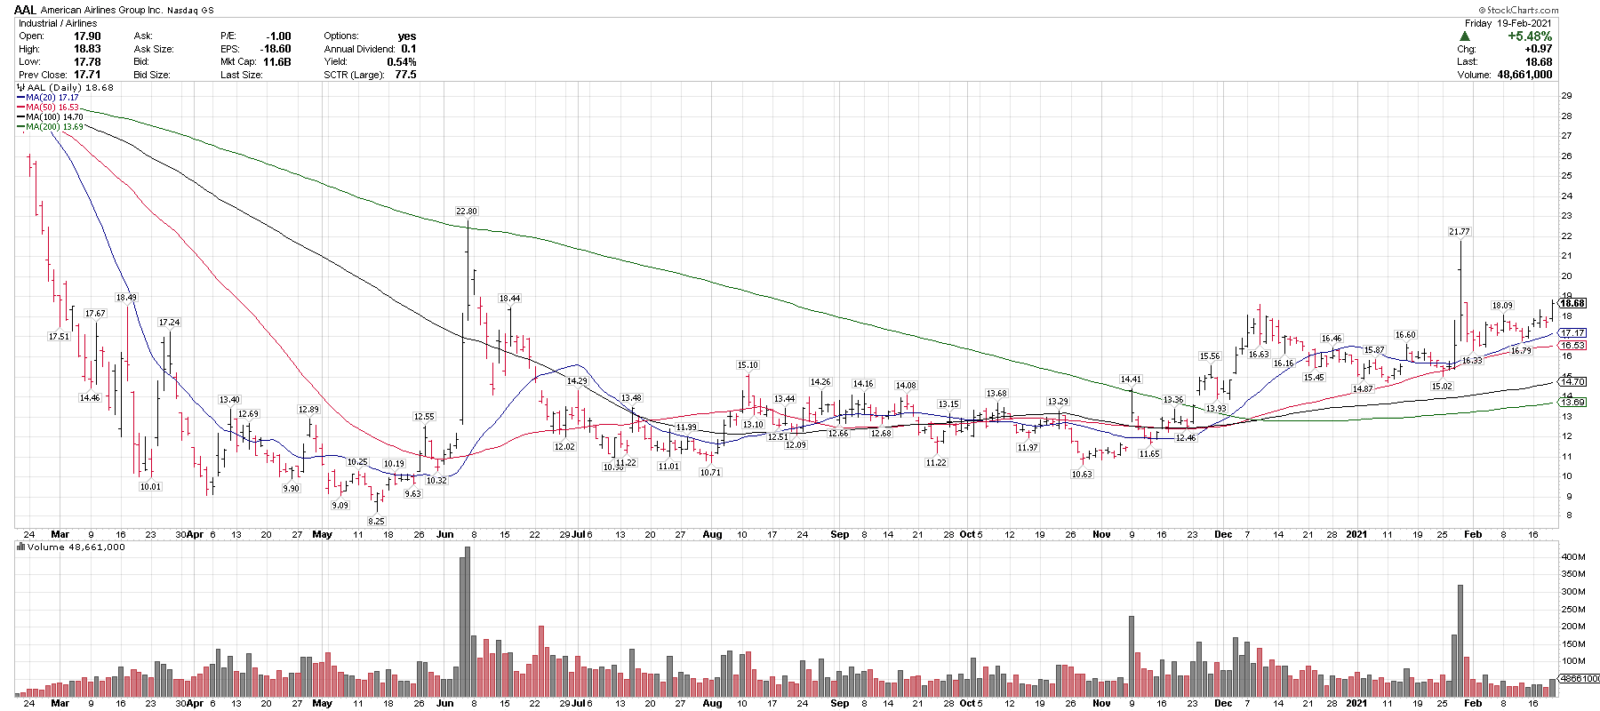
2/22/21
American Airlines, AAL
Close: 18.68
Pre: 19.88
Stop: 15.69
AAL & the airline sector DAL, JETS, and LUV are testing breakouts pre-market. AAL closed at 8 month highs on Friday and is on this week’s Top 25 list and mid cap list. AAL is gapping up early, DAL and JETS not as much as of yet.
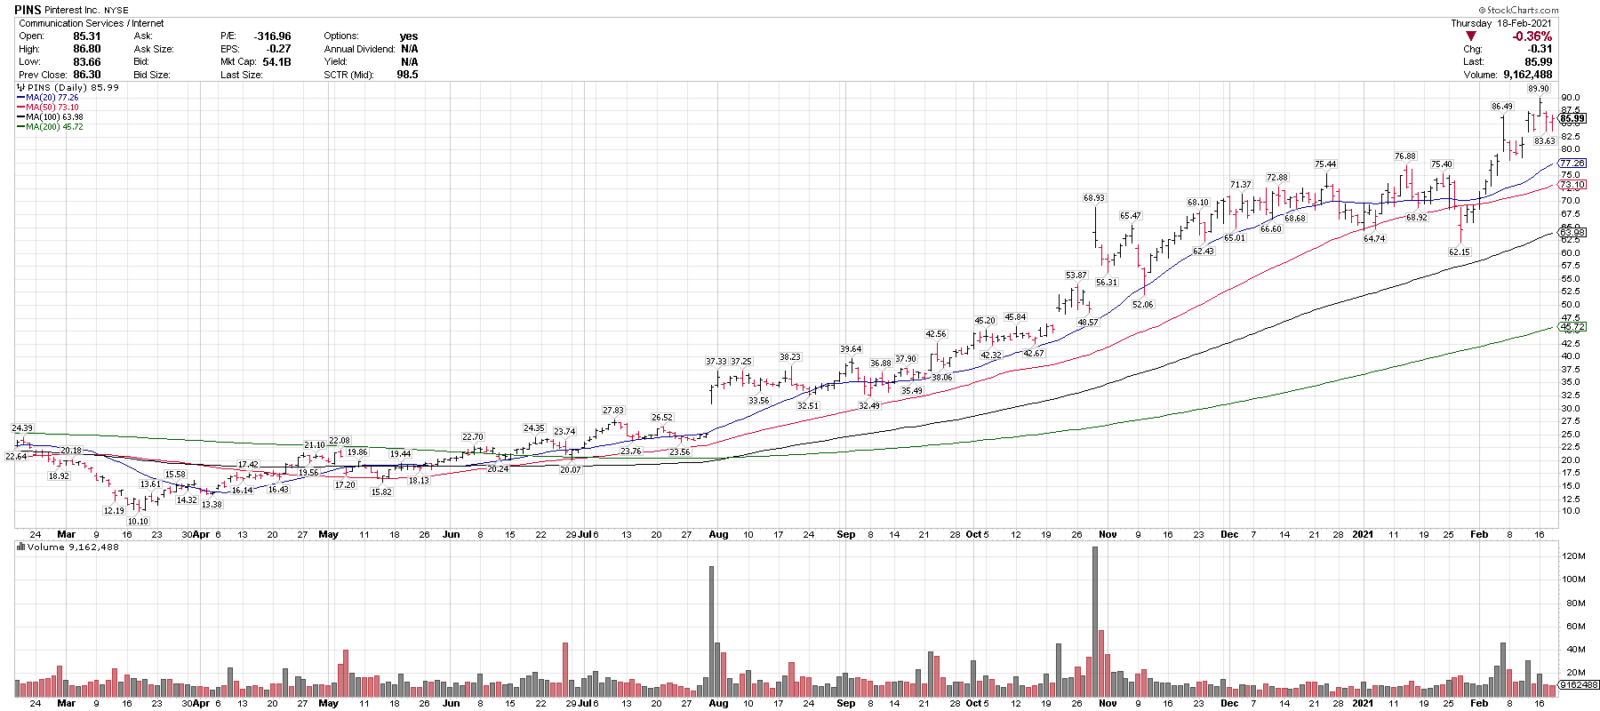
2/19/21
Pinterest, PINS
Close: 85.99
Pre: 86.97
Stop: 72.23
PINS is in an uptrend above 4 rising MAs & recently corrected 6.9% off of all-time highs. 75 & 77.50 are near term support levels, over $90 could signal a breakout. We took a position in PINS this week, as posted, from slightly lower, and that stop is at 71.23.
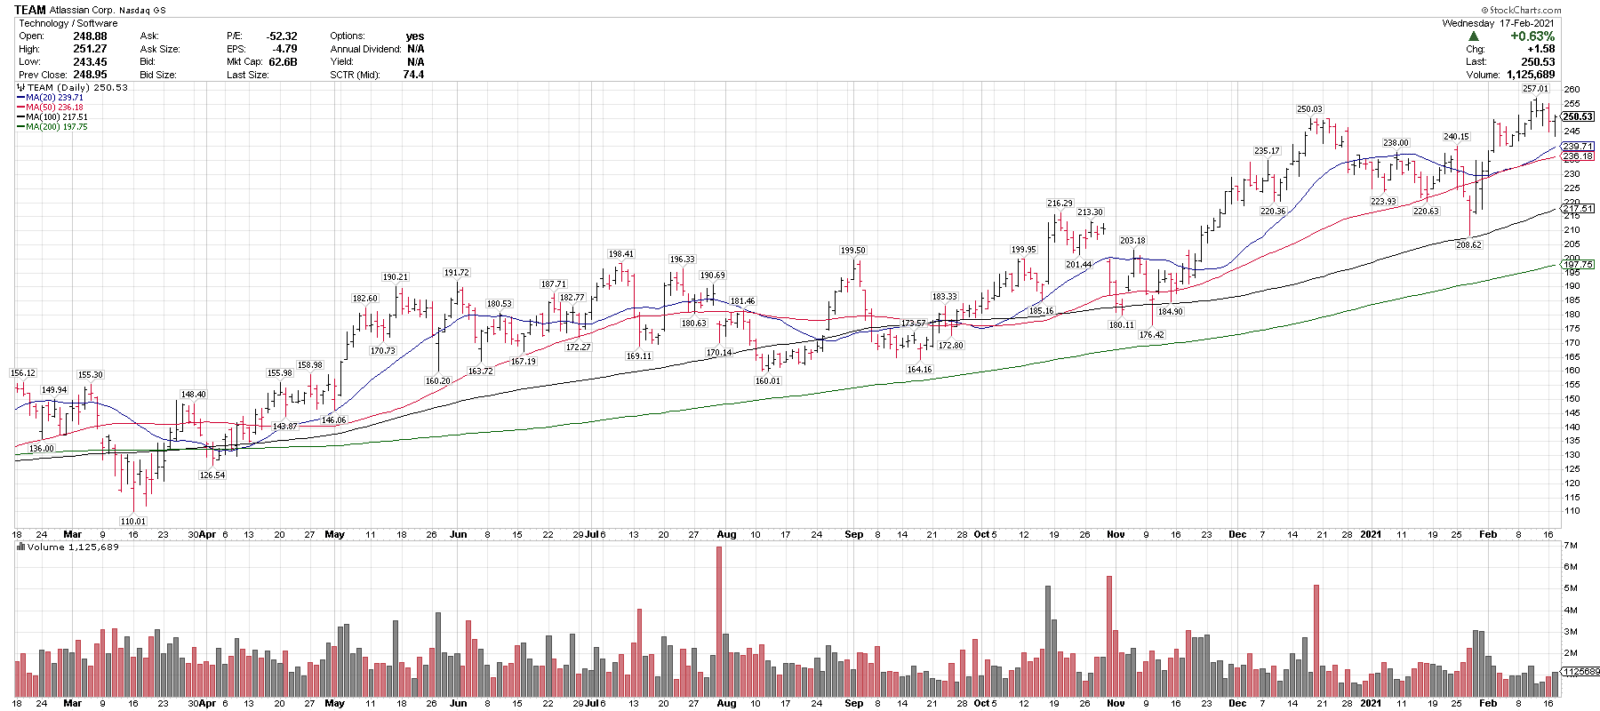
2/18/21
Altassian Corp., TEAM
Close/Pre: 250.53
Stop: 212.94
TEAM is in an uptrend above 4 rising MAs & recently pulled back 5.2% off of all-time highs. A close through 255-260 could signal a breakout higher and 220-235 is a support range.
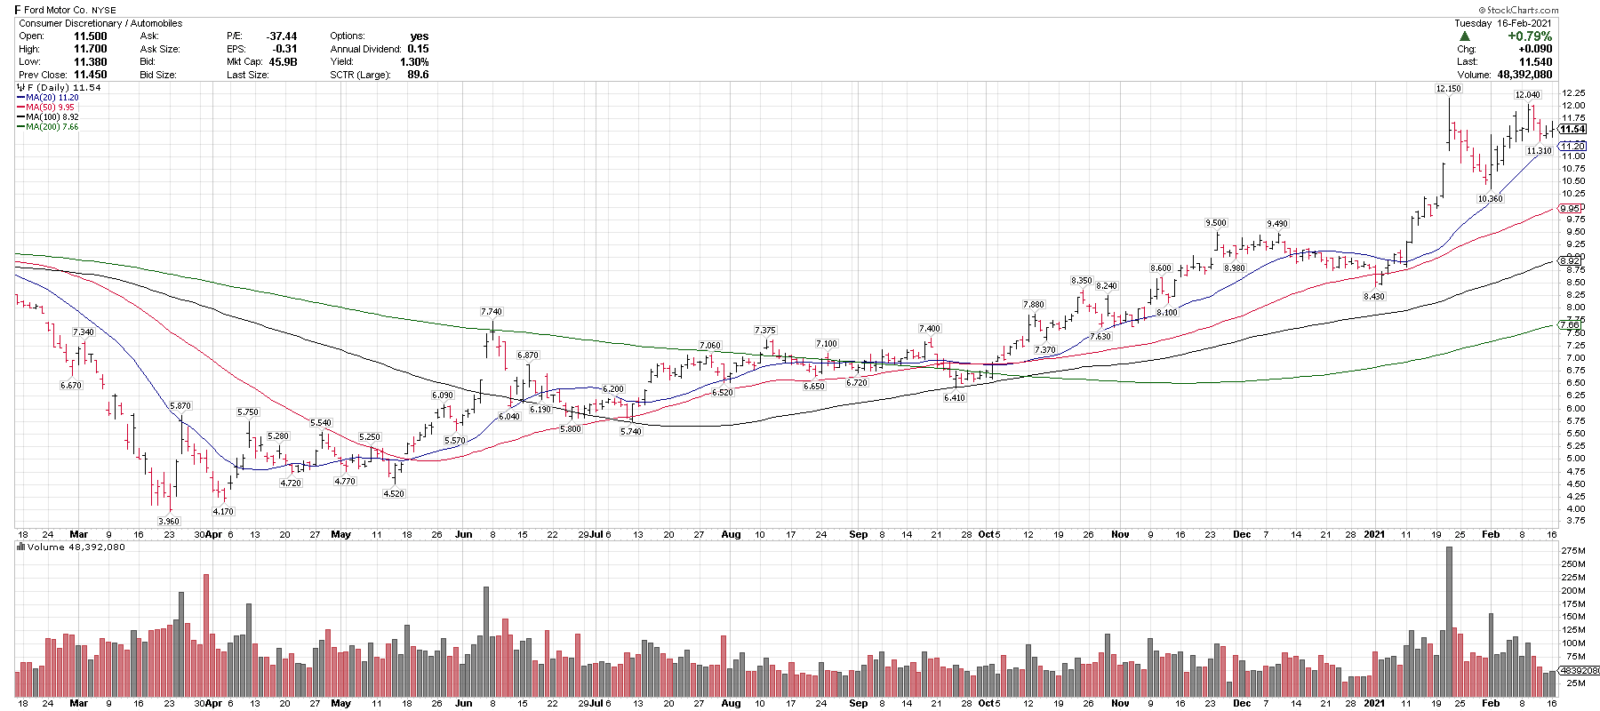
2/17/21
Ford, F
Close: 11.54
Pre-Market: 11.65
Stop: 9.78
F is in an uptrend above all key rising MAs & recently pulled back 14.7% off of 52-week highs into the rising 20-sma. A move over $13 would signal a 19 year breakout. F is increasing it’s exposure to EVs.
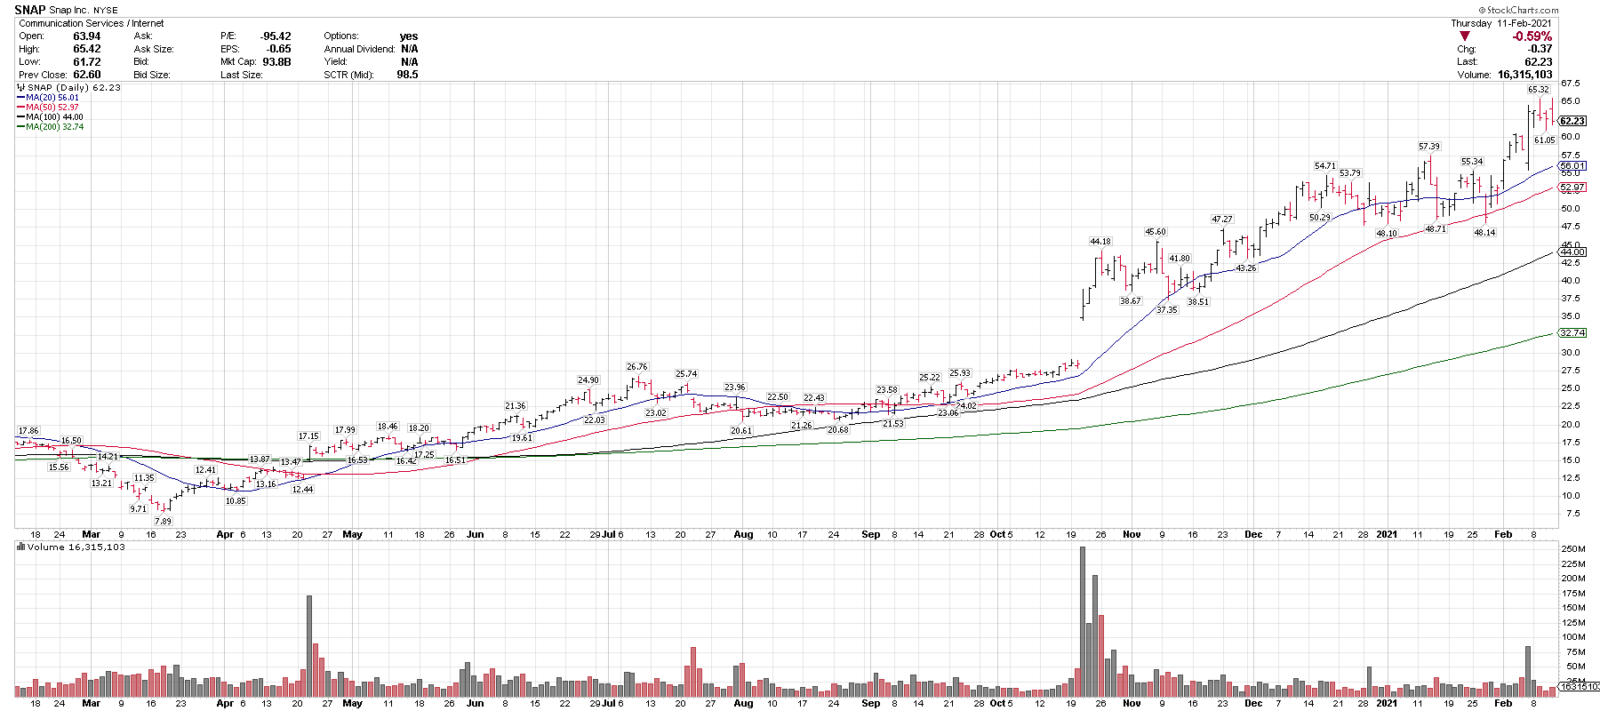
2/12/21
Snapchat, SNAP
Close: 62.23
Pre: 62.10
Stop: 51.89
SNAP is in an uptrend above 4 rising MAs and is consolidating off of all-time highs & reported earnings last week. 60, 56 and 54 are support levels. On this week’s Top 25 list.
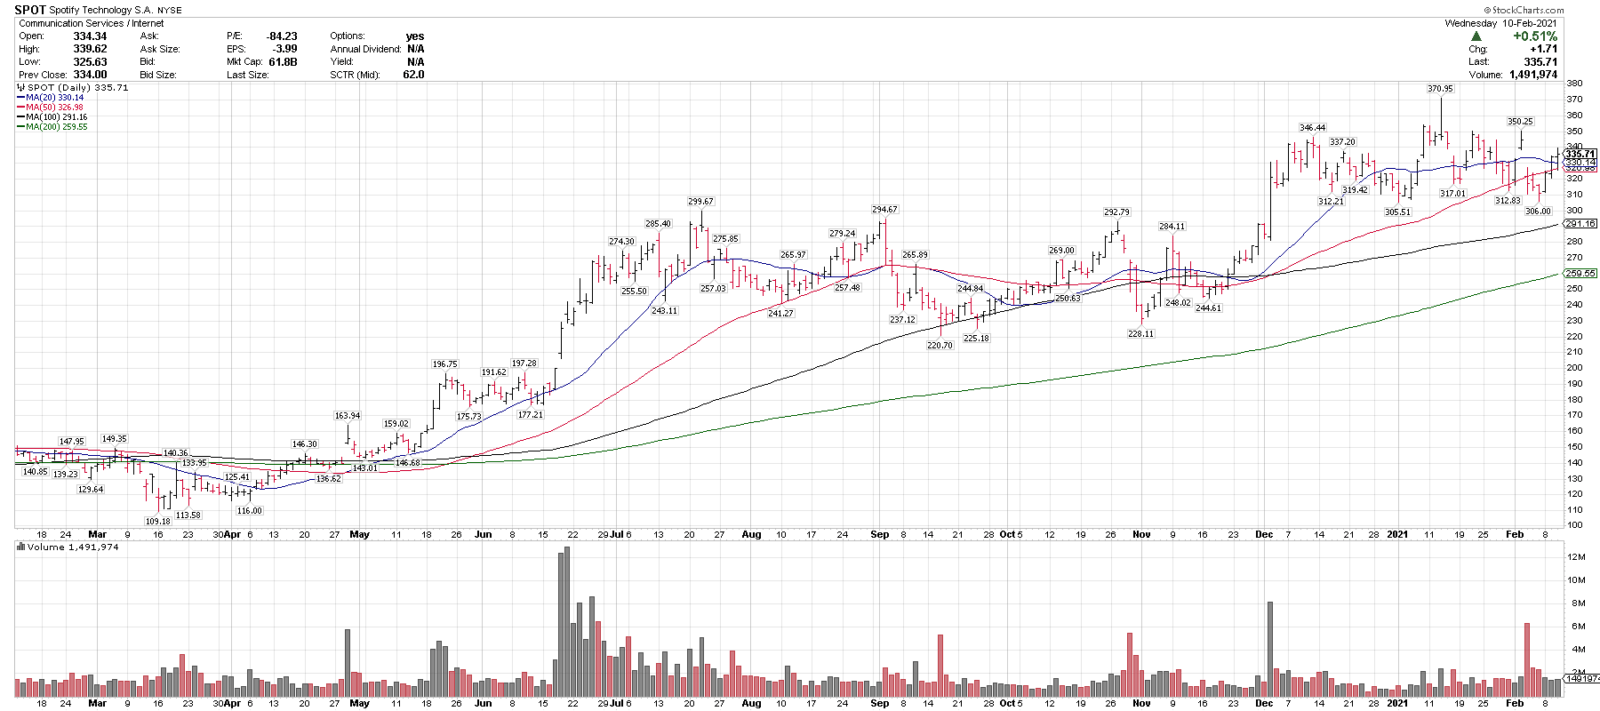
2/11/21
Spotify, SPOT
Close: 335.71
Pre: 336.31
Stop: 285.35
SPOT is consolidating in a longer-term uptrend and above 4 MAs. 310 is near term support, 300 is a key breakout support level and a close over 350 could signal a breakout higher.
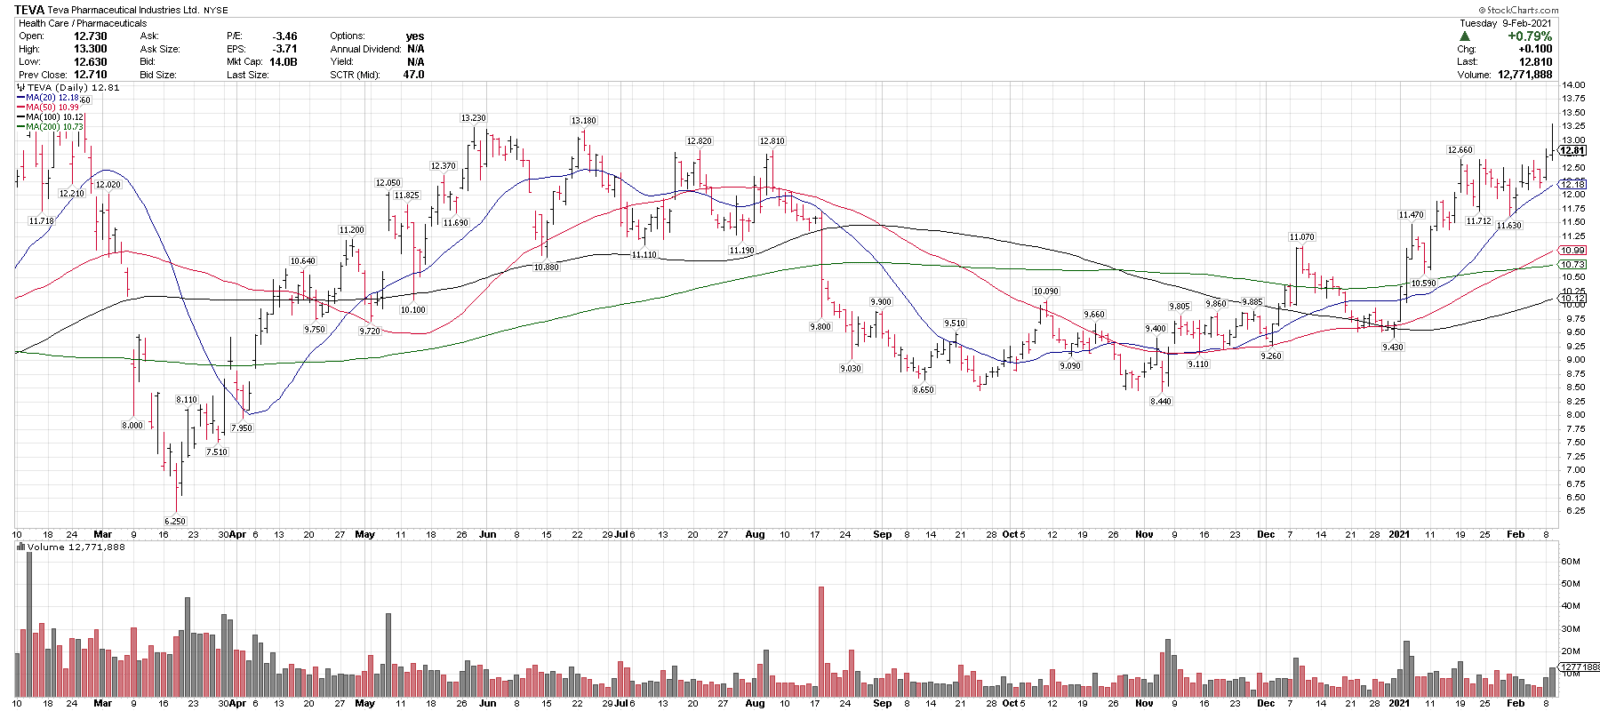
2/10/21
Teva Pharmaceuticals, TEVA
Close: 12.81
Pre: 13.25
Stop: 10.88
TEVA is in an uptrend above 4 rising MAs, and recently pulled back 8.1% into the 20-sma. It is testing a breakout to 52-week highs after earnings. TEVA was on our 1/17, 1/24 & 1/31 Top 25 lists.
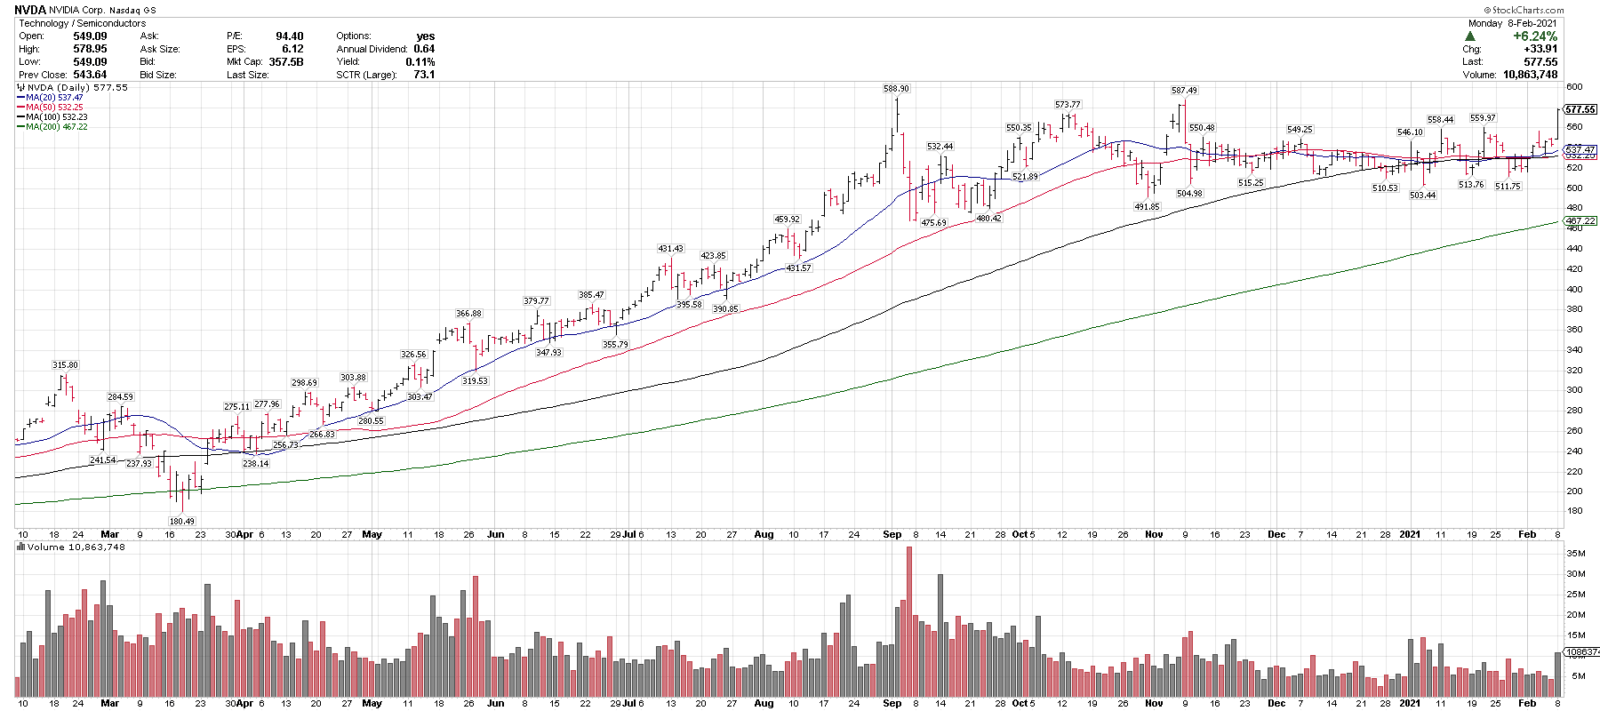
2/9/21
Nvidia, NVDA
Close: 577.55
Pre: 574.49
Stop: 488.31
NVDA broke out of a trading range yesterday to close at a 90-day high & over a 560 resistance level, on above average volume. It is trading > 4 rising MAs. 540/500 is support & a close over 600 could signal a breakout.
2/8/21
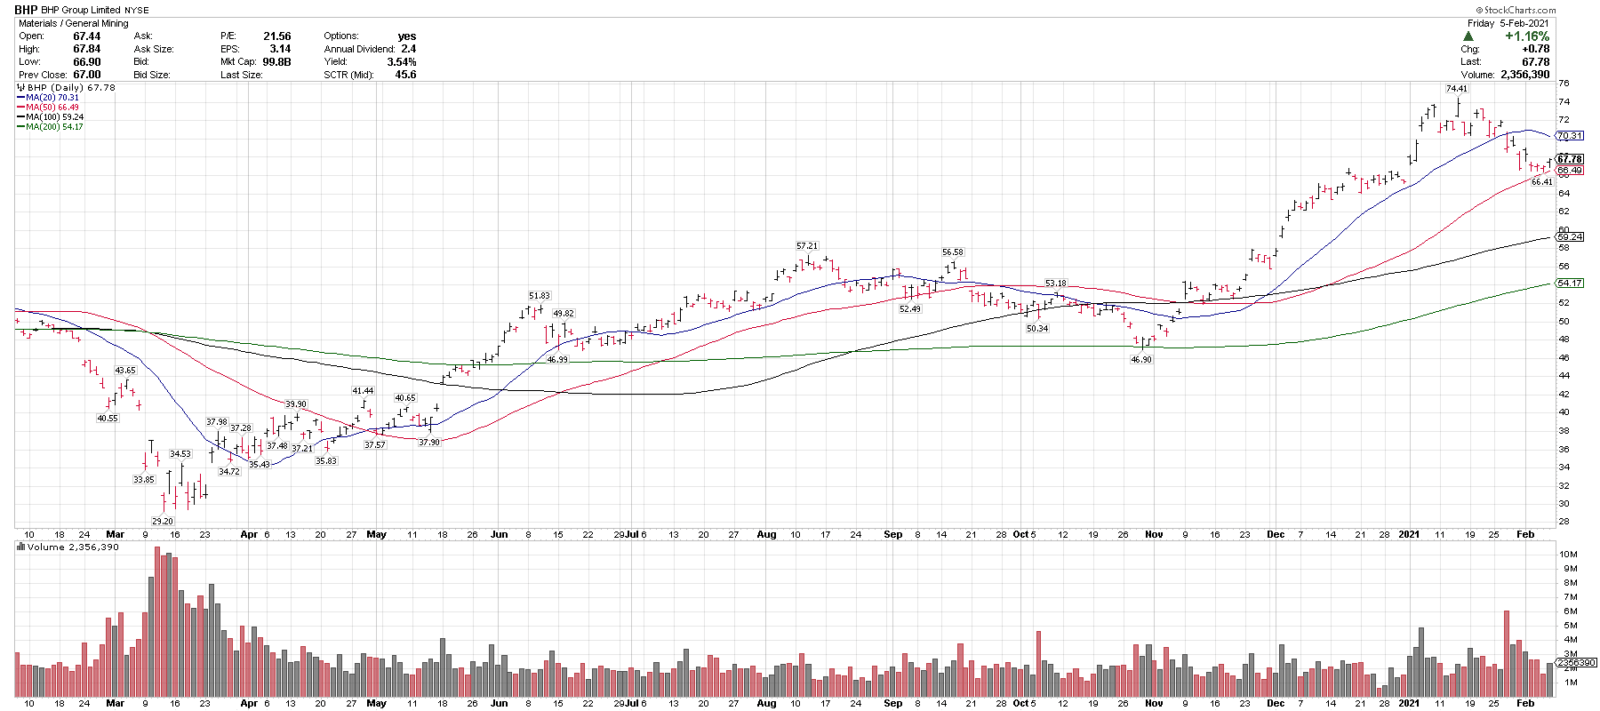
BHP Group, BHP
Close: 67.78
Pre: 69.00
Stop: 57.61
BHP is in a technical uptrend above the rising 50, 100 & 200-sma and recently pulled back 10.7% off of new highs, and held at the rising 50-sma. Over 62.50 is a major long-term breakout.
2/5/21
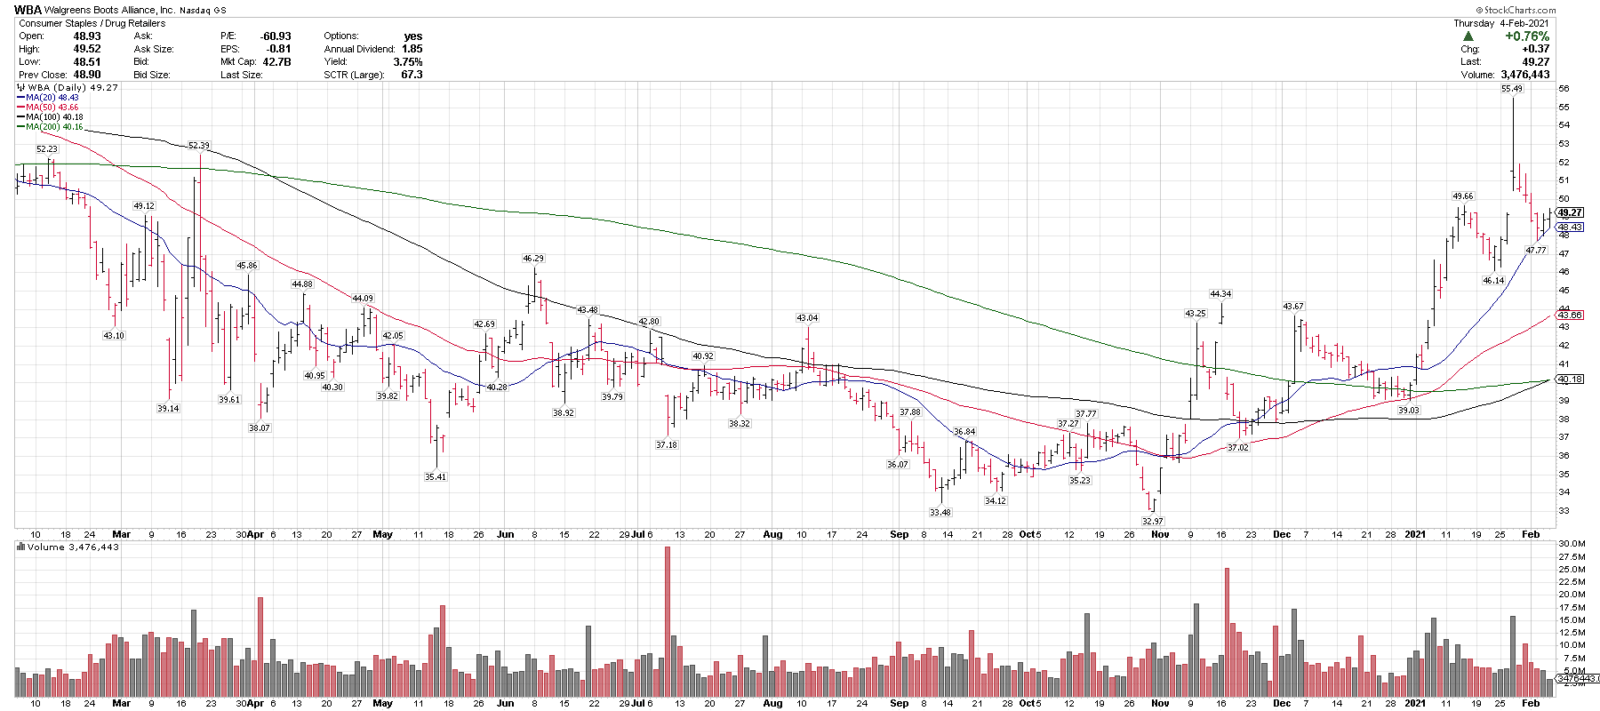
Walgreens Boots Alliance, WBA
Close: 49.27
Pre: 49.41
Stop: 41.87
WBA is in an intermediate-term uptrend, above 4 rising MAs and recently corrected 13.9% off of 52-week highs into the rising 20-sma. 44 & 46 is near-term support.
2/4/21
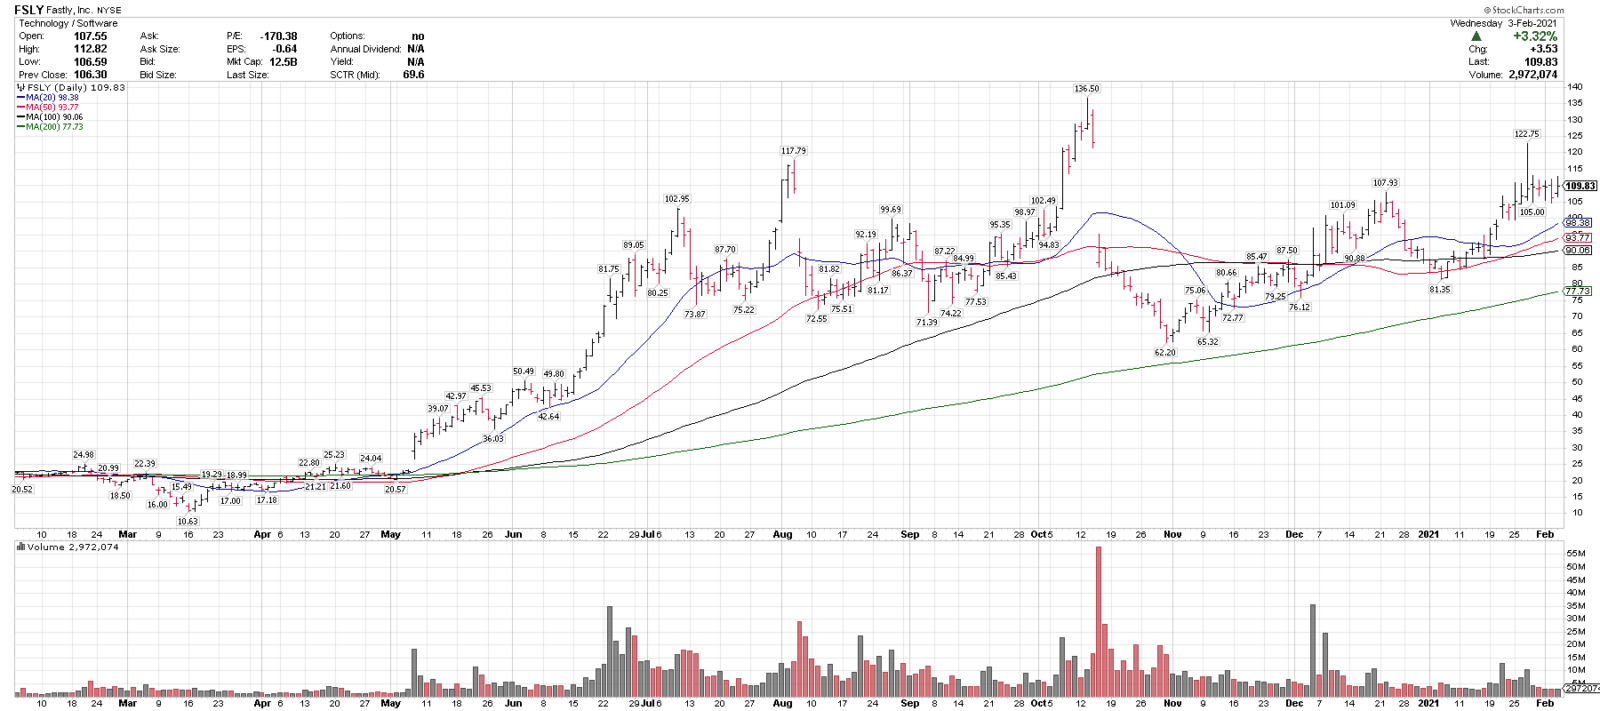
Fastly, FSLY
Close: 109.83
Pre: 111.90
Stop: 93.35
FSLY is trending higher over 4 rising MAs and is trying to break out of a 7 month range. 100 and 105 is near term support and over 115 could signal a breakout.
2/3/21
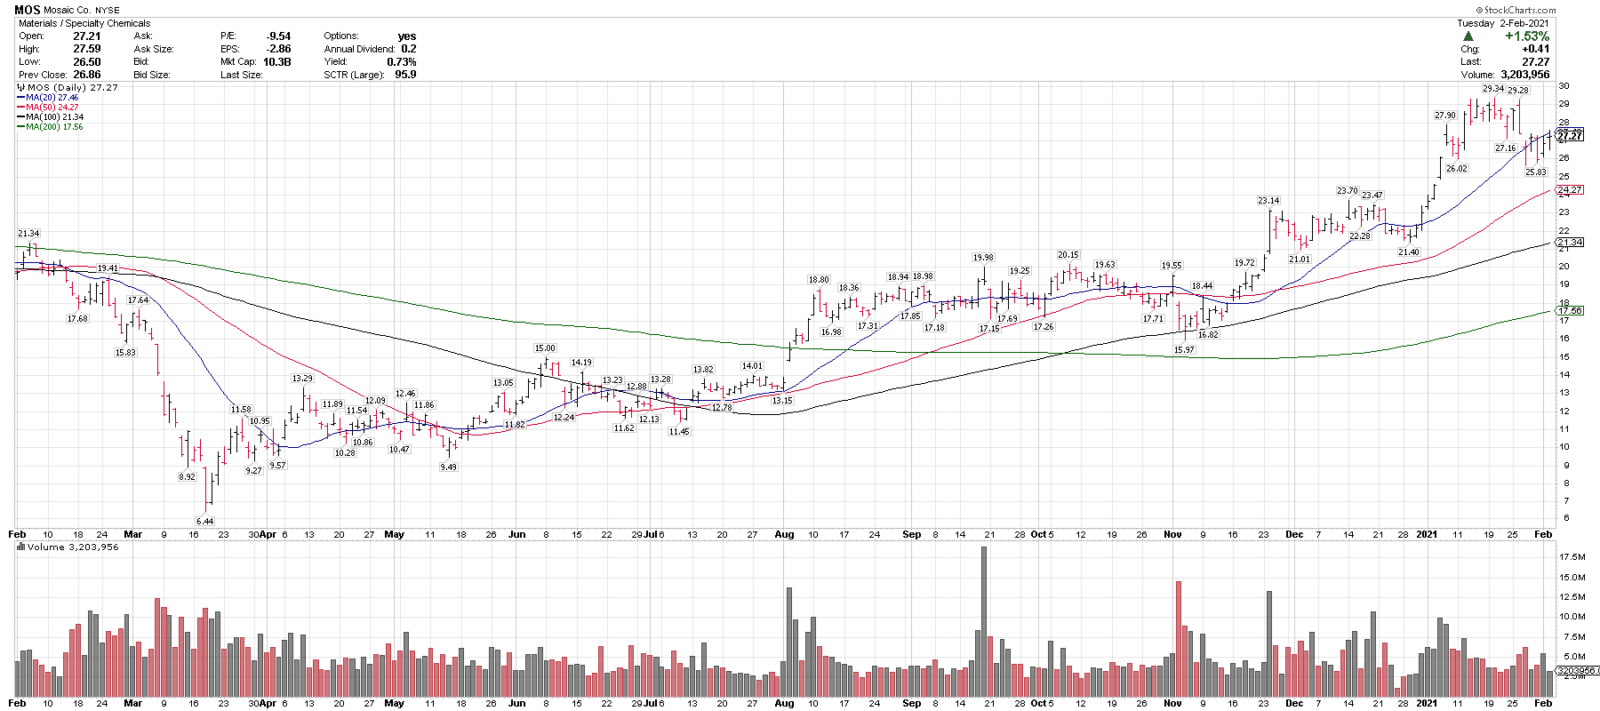
Mosaic, MOS
Close: 27.27
Pre: 27.33
Stop level: 22.90
MOS is in a technical uptrend above the rising 50, 100 & 200-sma & recently corrected 11.9% off the 52-week high. 26 & 23 are support levels.
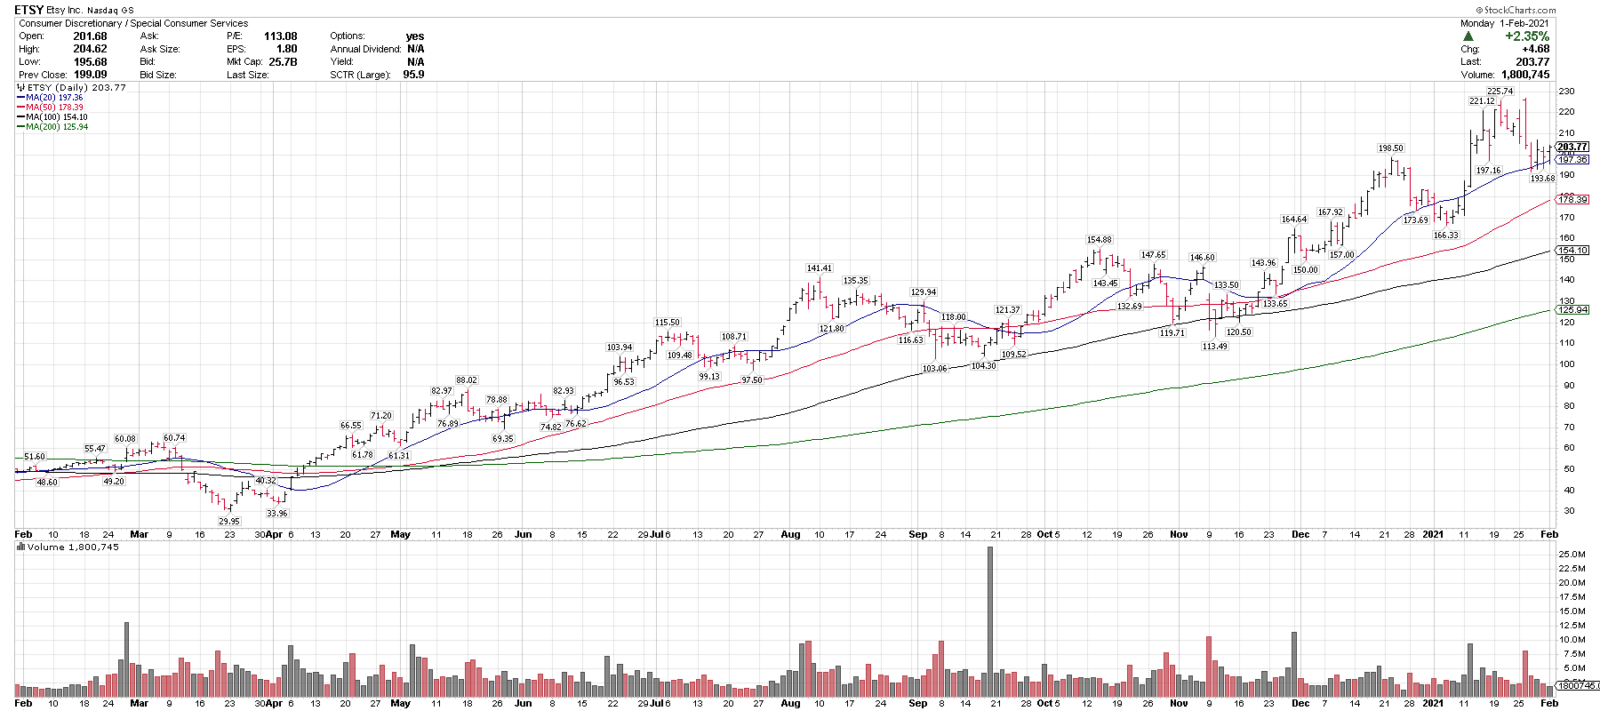
2/2/21
Etsy, ETSY
Close: 203.77
Pre: 206.05 (+1.12%)
Stop level: 173.20
ETSY is in a longer-term uptrend above all key rising MAs recently pulled back 14.2% into the rising 20-sma. 190 is a near-term support level. On this week’s Top 25 list.
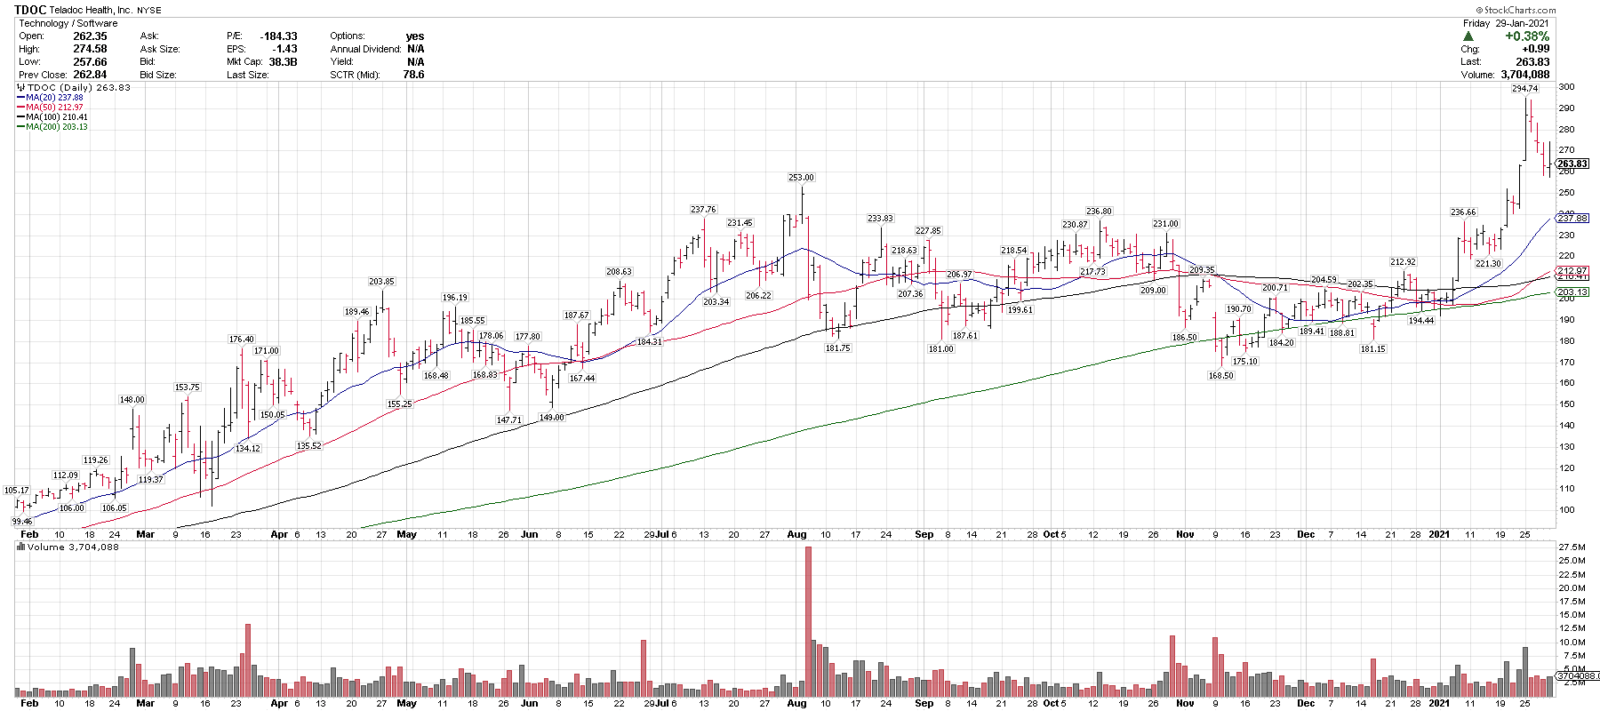
2/01/21
Teladoc, TDOC
Close: 263.83
Pre: 267.60 (+1.43%)
Stop: 221.61
TDOC is in a longer-term uptrend above all key rising MAs and recently pulled back 12.5% off of all-time highs. 250 & 230 are support levels. On the last 3 Weekly Top 25 lists, including this week.
JANUARY 2021 “CHART OF THE DAY”
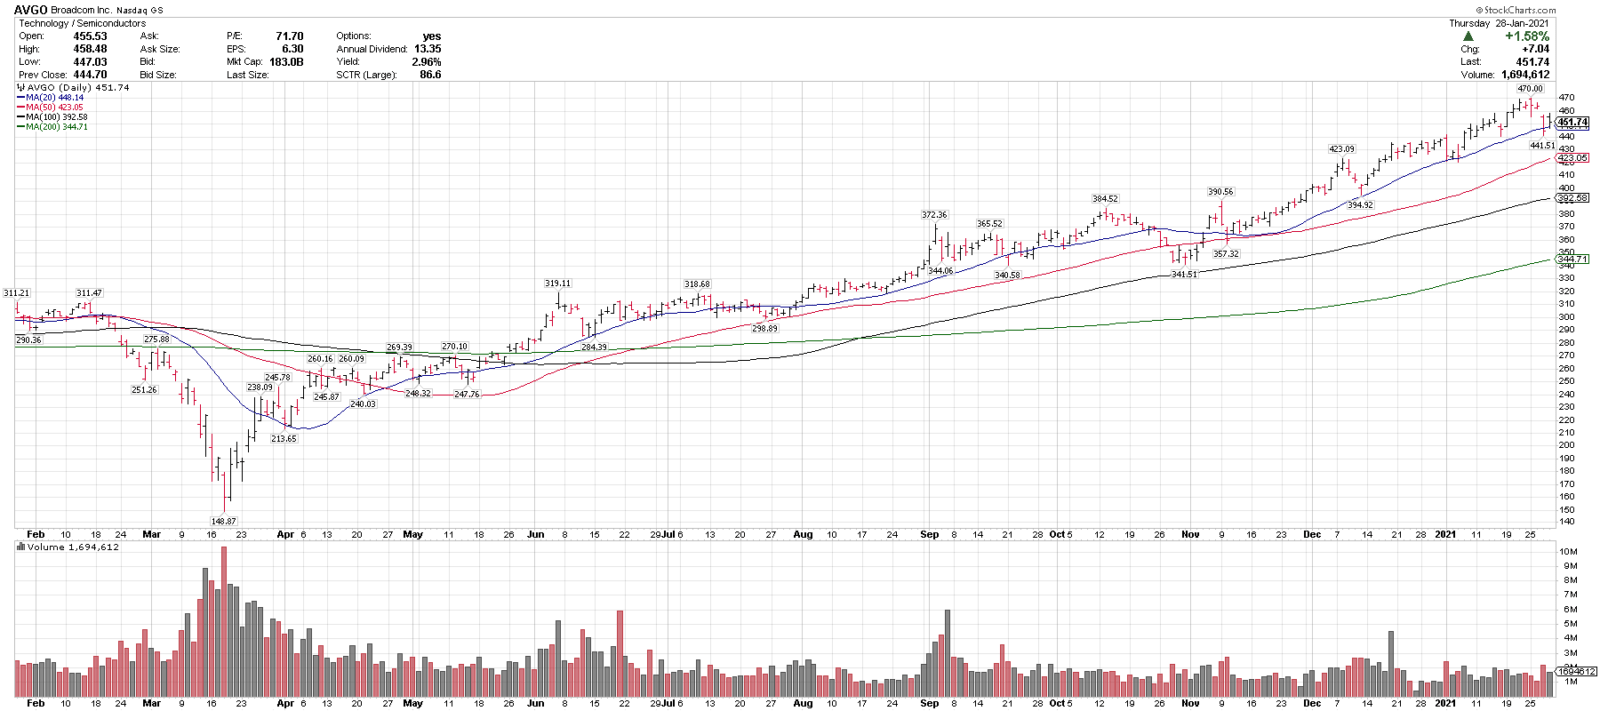
1/29/21
Broadcom, AVGO
Close: 451.74
Pre: 449.20
Stop: 383.97
AVGO is in a long-term uptrend above 4 rising MAs and recently pulled back 6.0% off of all-time highs. 420-440 is a near-term support level.
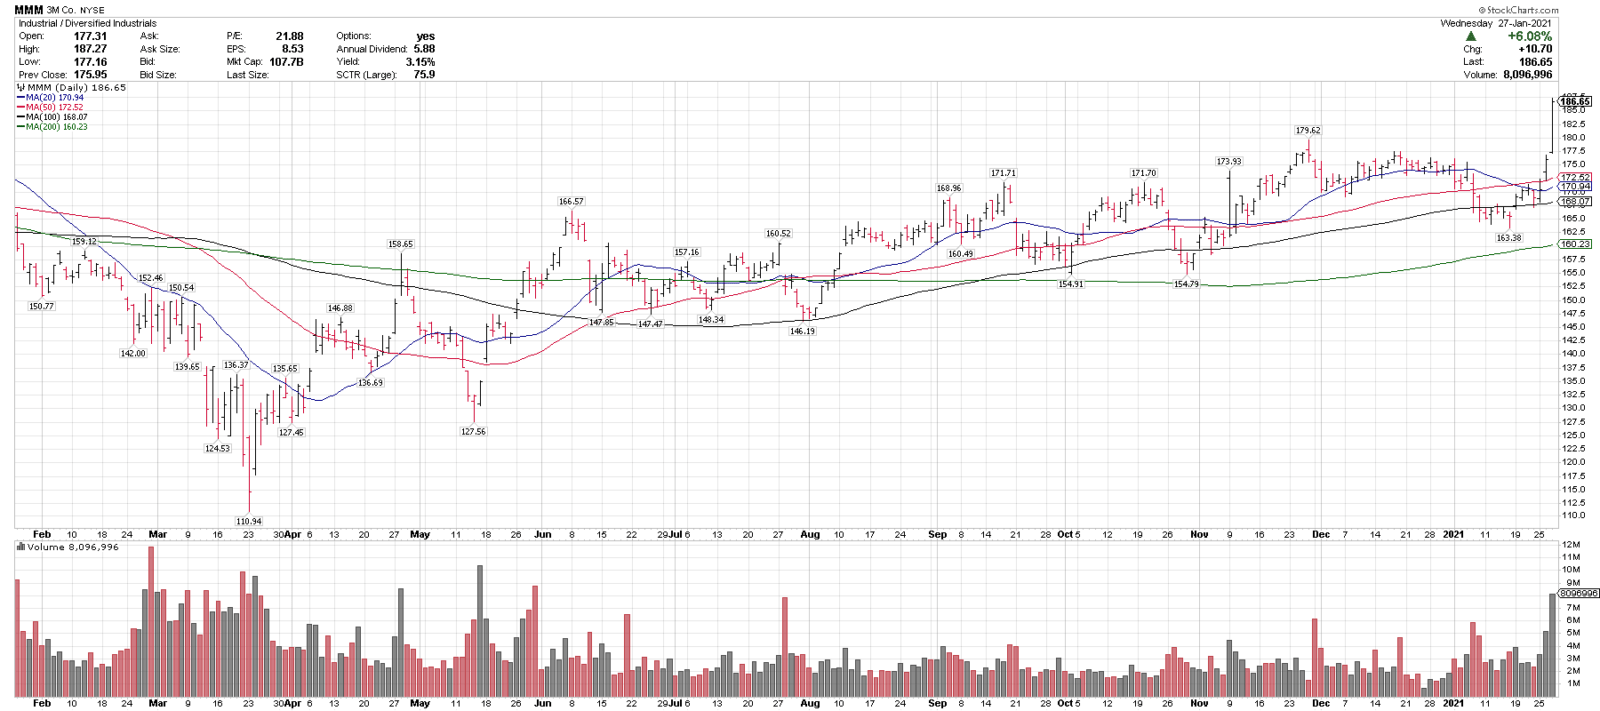
1/28/21
3M Co., MMM
Close: 186.65
Pre: 183.03
Stop level: 158.64
MMM goes on the list today with yesterday’s new 52-week high breakout signal on above average volume, after earnings. MMM is coming out of a 7 month base and over all rising MAs. Shorter term market volatility is above average currently.
1/27/21
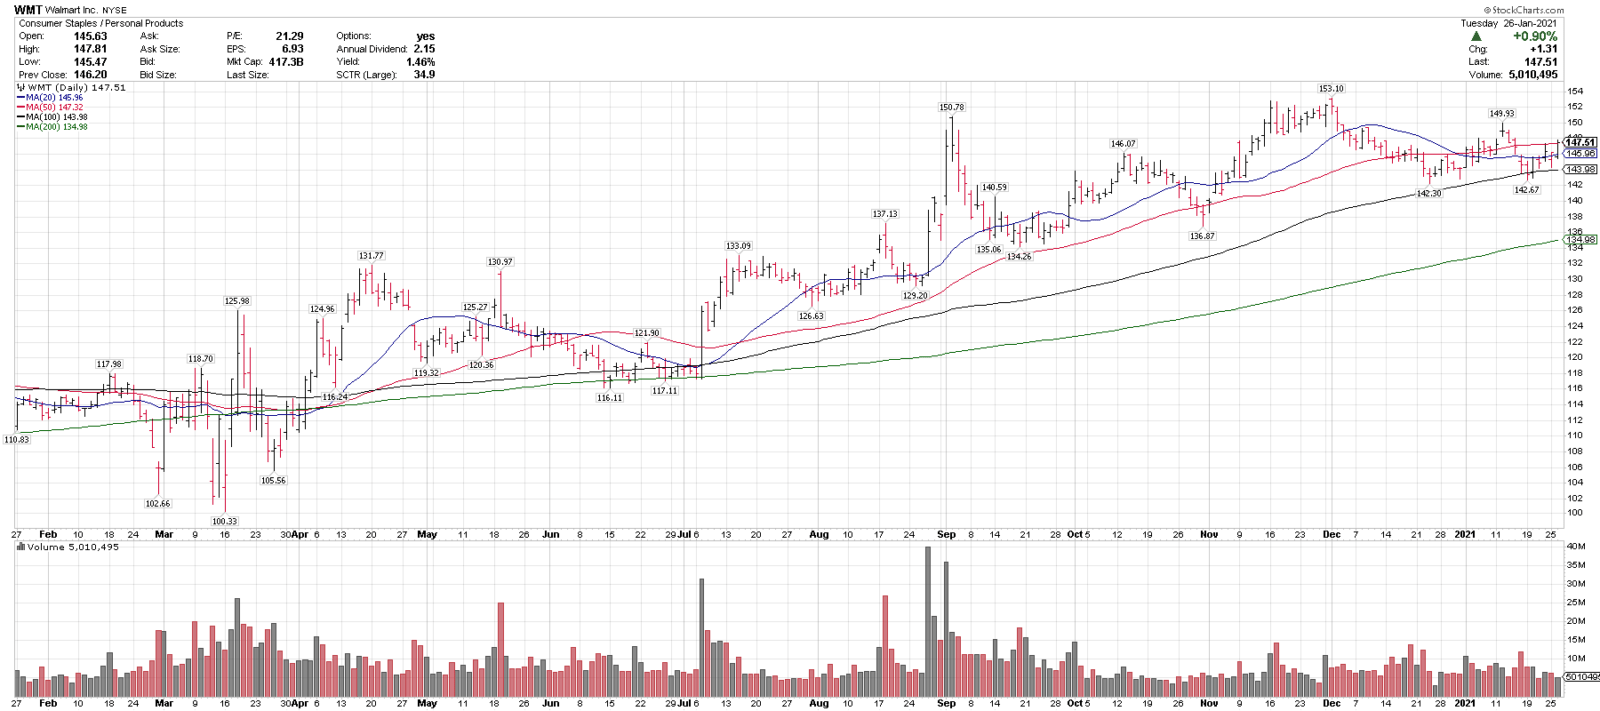
Walmart, WMT
Close: 147.51
Pre: 146.35
Stop: 129.80
WMT is in a technical uptrend above 4 rising MAs and recently pulled back 7.0% off of all-time highs. 142 & 136 are support levels and 150 is a key overhead level.
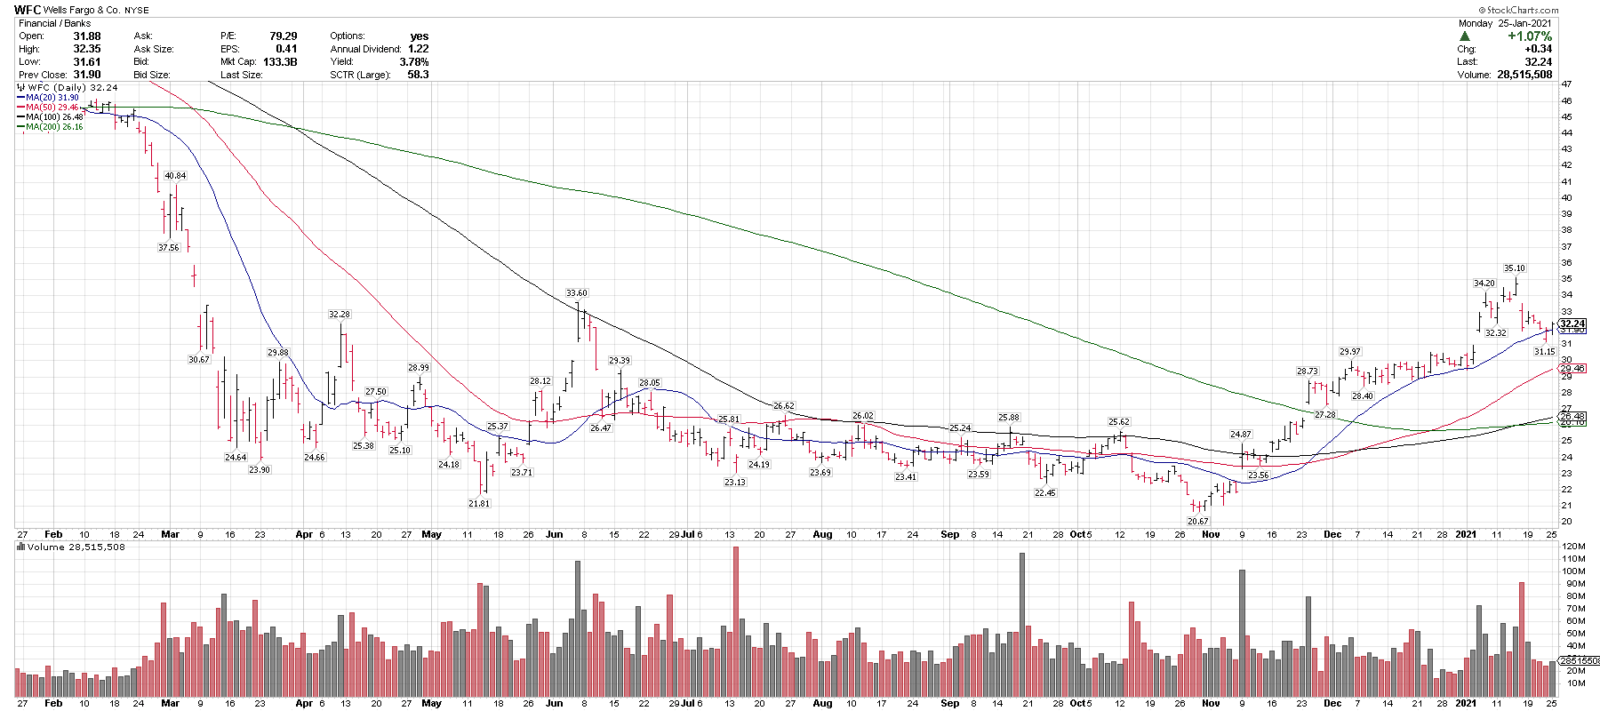
Wells Fargo, WFC
Close: 32.24
Pre: 32.42
Stop: 27.40
WFC is in an intermediate-term uptrend above 4 rising MAs and recently pulled back 11.2% off of 10-month highs. The sector (BAC, C, JPM) is set up well here.
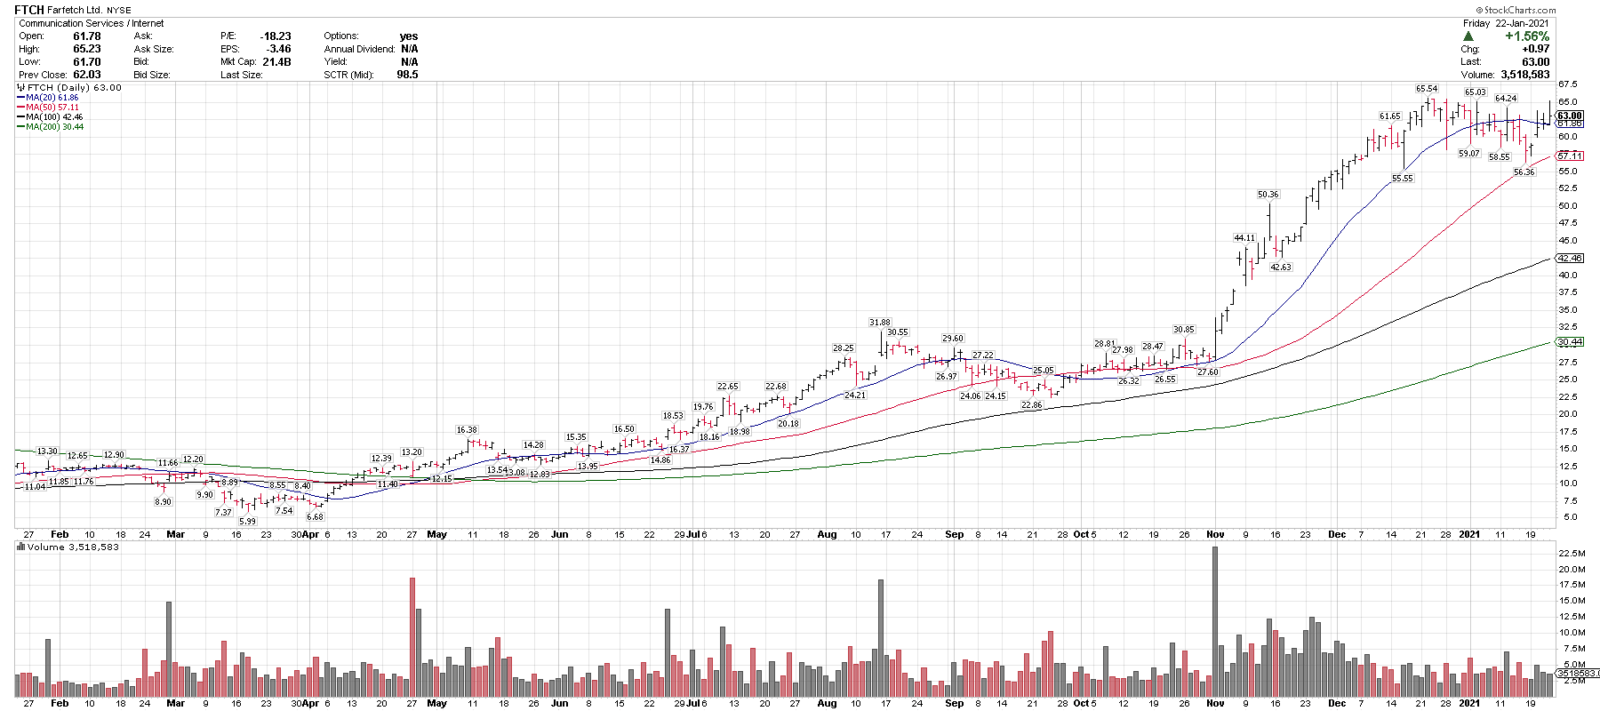
1/25/21
Farfetch, FTCH
Close (when posted): 63.00
Pre: 63.80
Stop level: 53.54
FTCH is in a technical uptrend above all key rising MAs & recently corrected 14% off AT highs into the 20-sma. The 50-sma & 55 are key levels on any pullbacks. A close > 65 could signal a breakout.
1/24/21
Chart of the Week
Enphase, ENPH
1/22/21
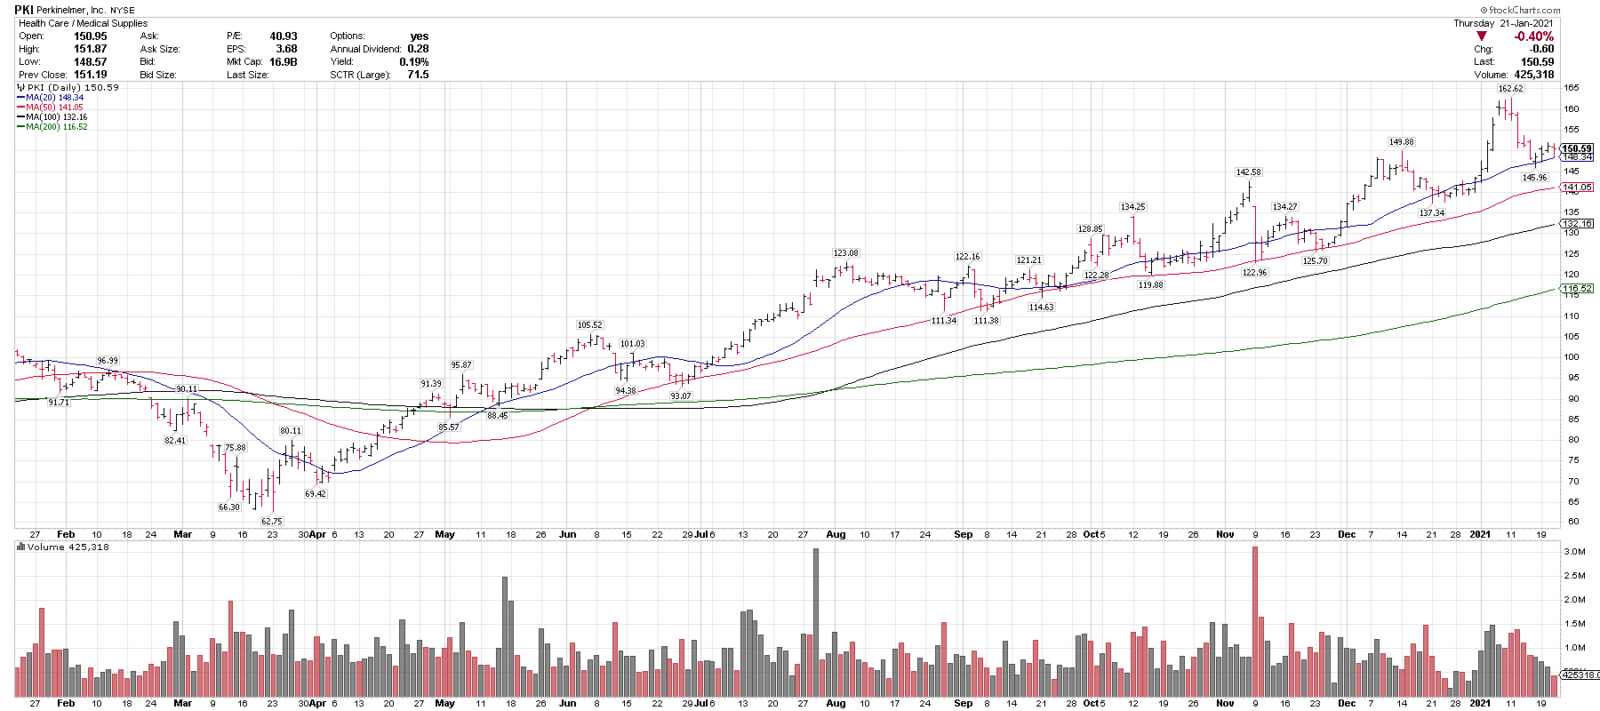
PerkinElmer, PKI
Close/Pre: 150.59
Stop: 127.98
PKI is in a technical uptrend above all key rising MAs and recently corrected 10.2% off of new highs. 140 is key support on any pullbacks.
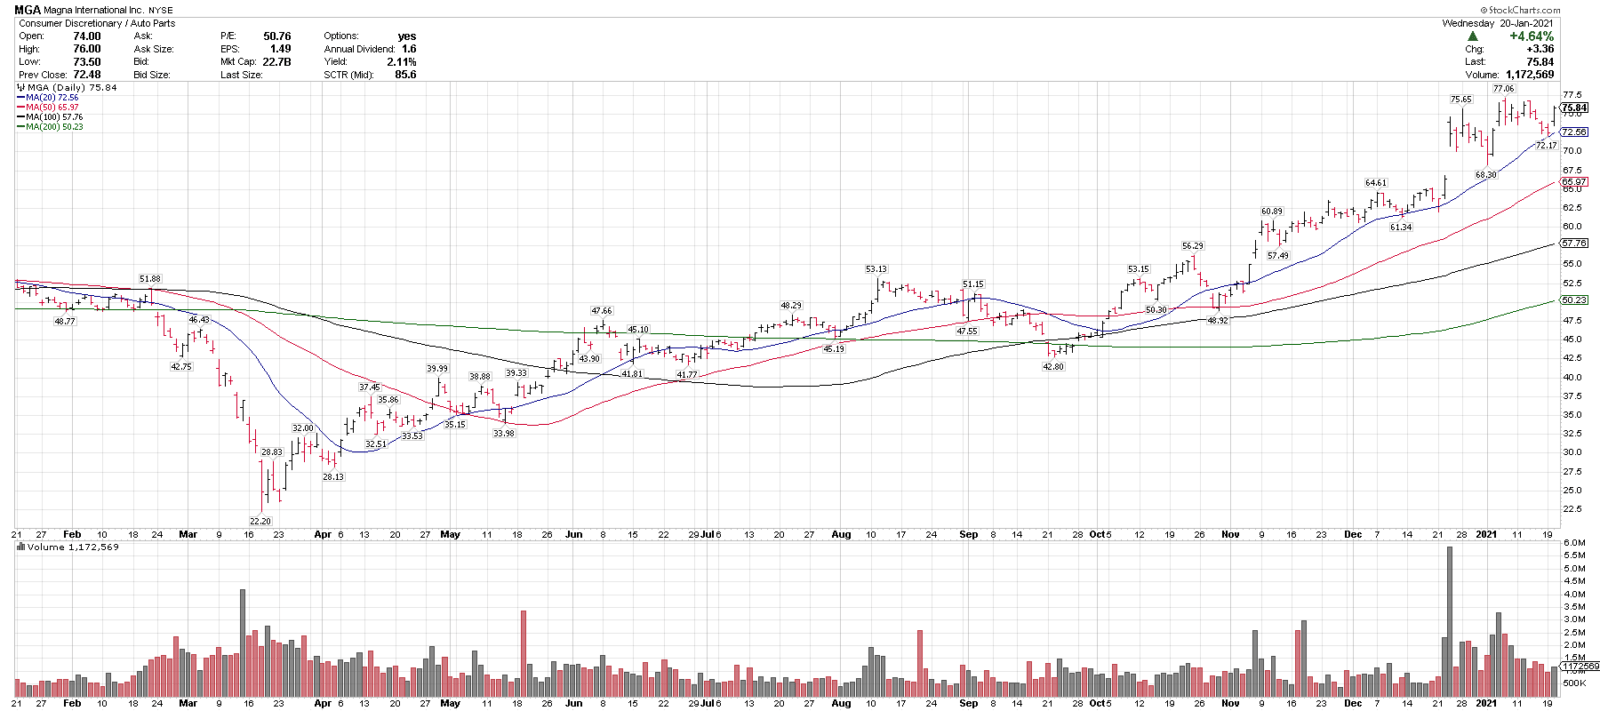
1/21/21
Magna International, MGA
Close/pre-mkt: 75.84
Stop: 64.46
MGA is in a technical uptrend above all key rising MAs & recently corrected 6.3% off highs and held the rising 20-sma. AV/EV exposure, on this week’s Top 25 list.
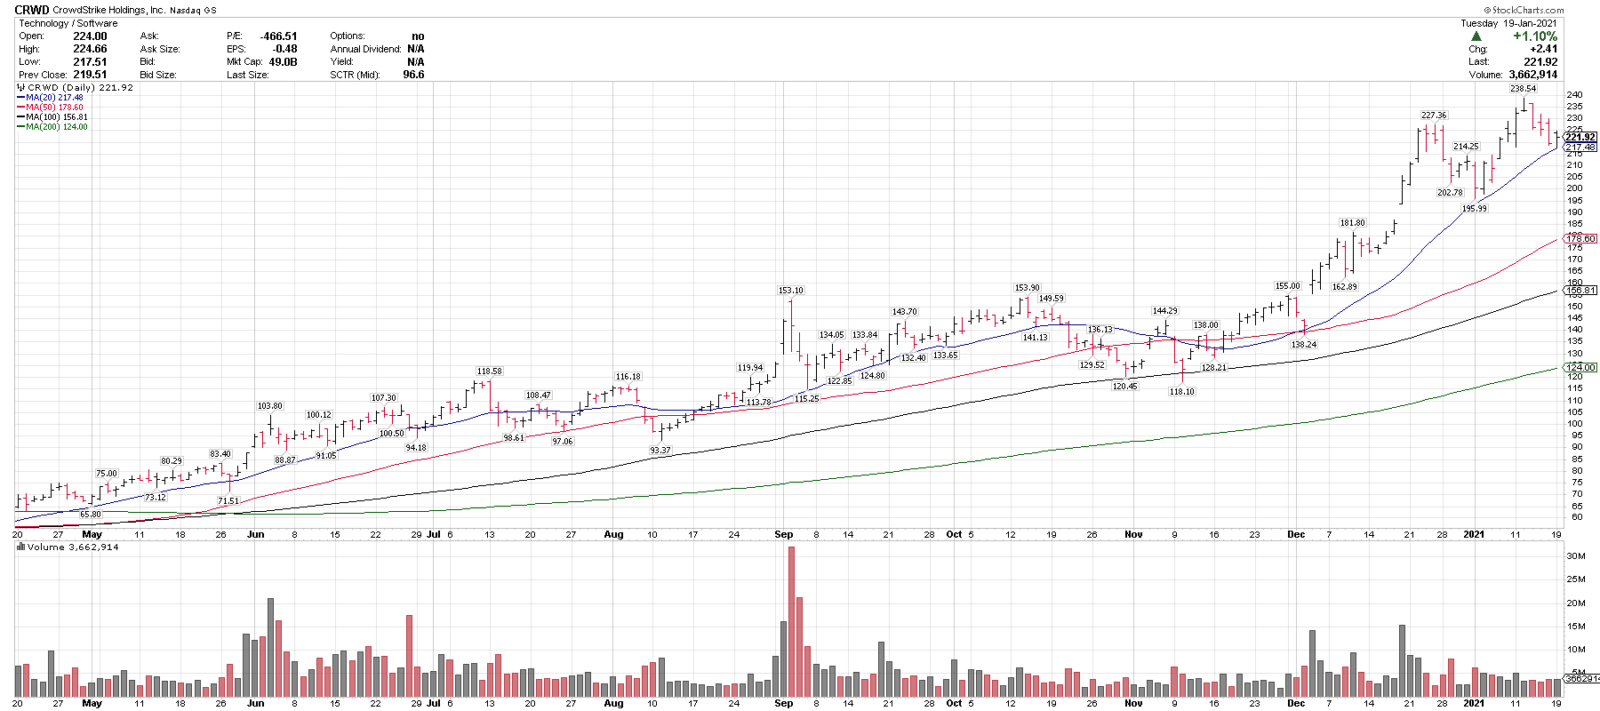
1/20/21
Crowdstrike, CRWD
Close: 221.91
Pre: 224.01 (+0.94%)
Stop level: 188.63
CRWD is in a technical uptrend above all key rising MAs & recently corrected 8.8% off of all-time highs. 200 & 215 is support on pullbacks, over 240 could signal a breakout. It is on Sunday’s Top 25 list.
1/17/21 Blue Chip Daily Chart of the Week
1/19/21 Chart of the Day
Teck Resources, TECK
Close: 19.63
Stop level for position traders and investors: 16.68
please see chart analysis below
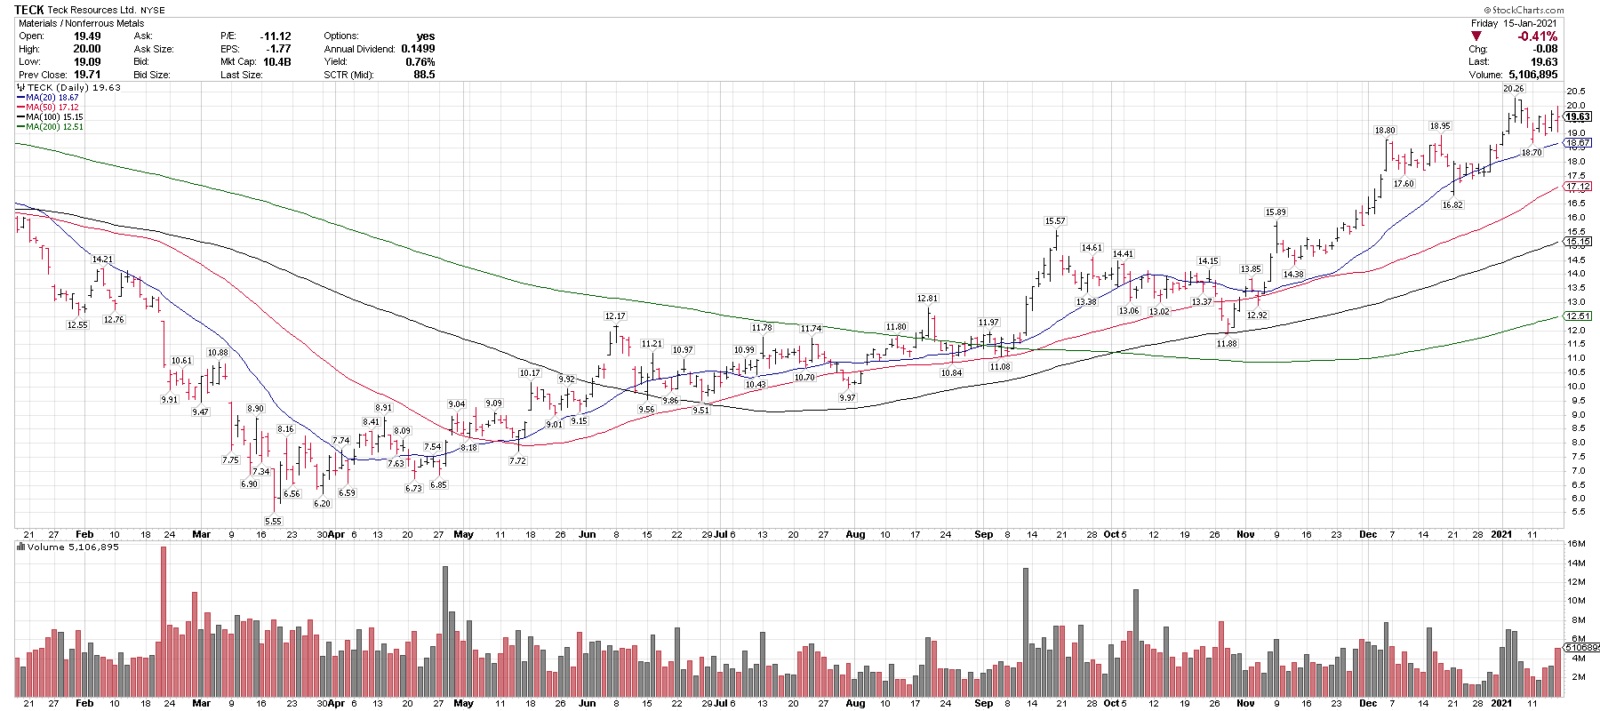
- Teck Resources, TECK, is one of our top technical ideas this week and is on this week’s Top 25 Stocks List, published for Members this morning.
- TECK is in a technical uptrend with a series of higher highs and higher lows above 4 rising moving averages.
- The Materials sector is positioned very well here, and has been in the Top 3 of our Industry group rankings since August.
- TECK recently corrected 7.6% off of 18-month highs, into the rising 20-sma.
- $17.50 – $18.50 is key support on any pullbacks and a close over $20.50 could signal a new breakout.
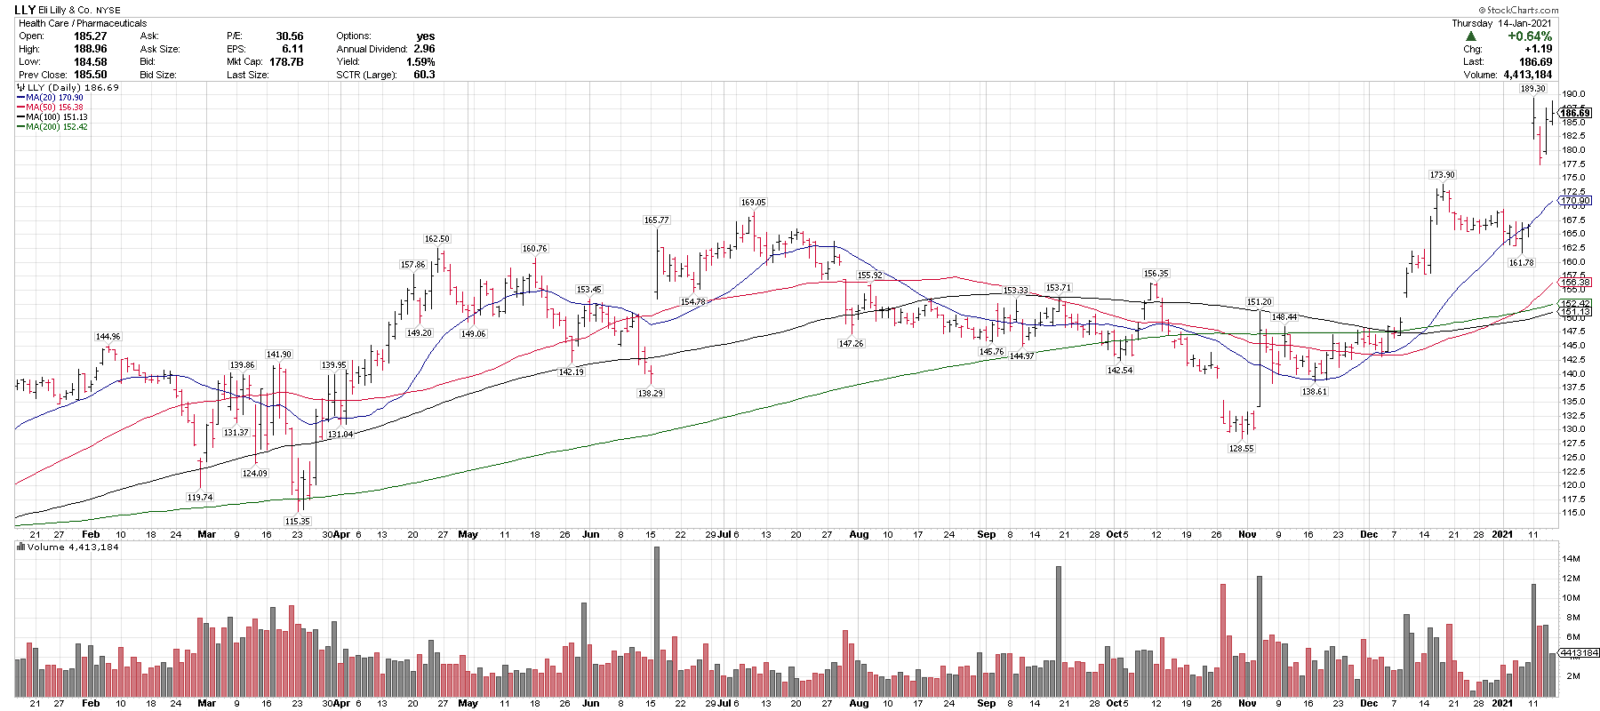
1/15/21
Eli Lilly, LLY
Close: 186.69
Pre: 186.00
Stop: 158.68
LLY is in a technical uptrend above all key MAs and is recently consolidating off the highs. 177.50 & 172.50 is support on any pullbacks. Also on the 2021 Top 25 list.
1/14/21
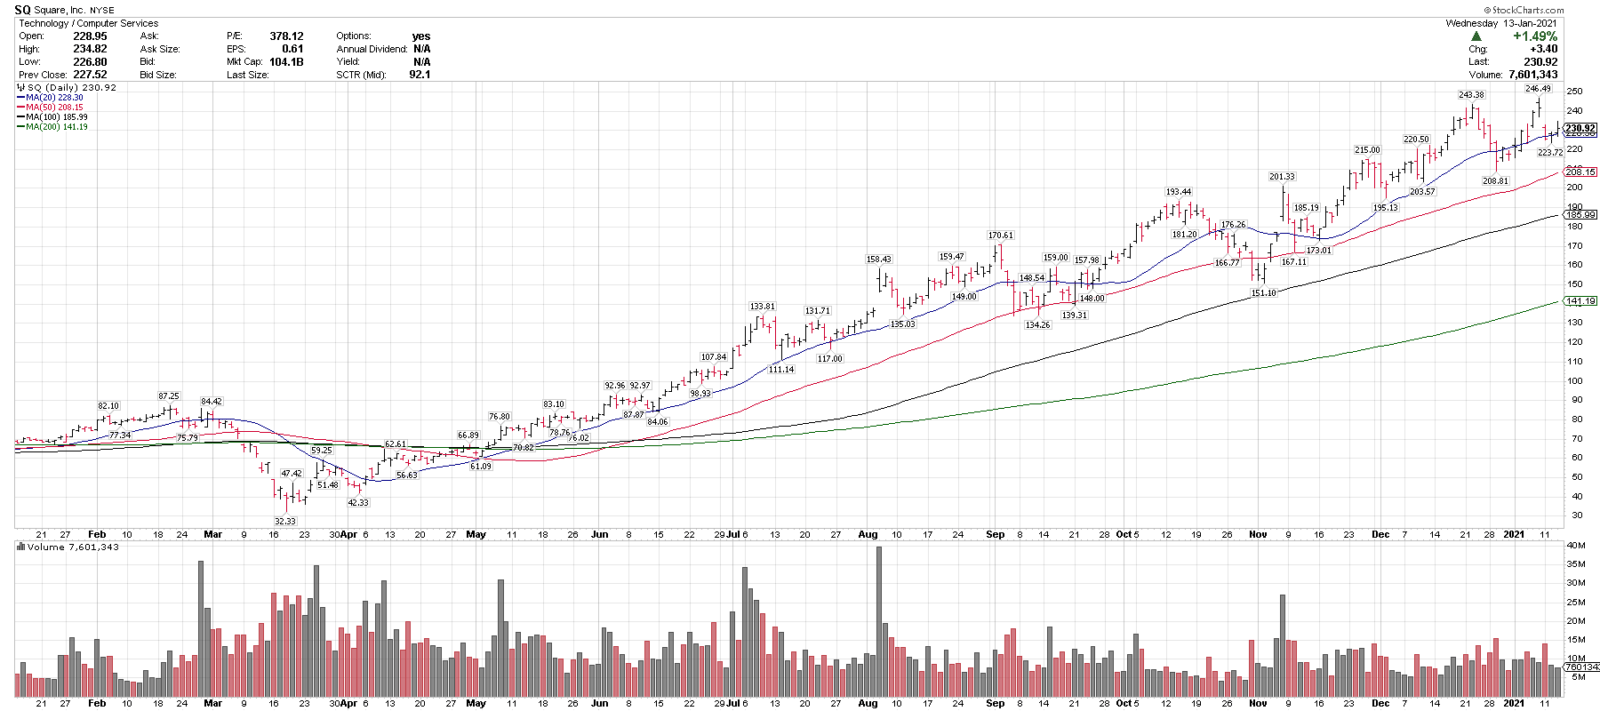
Square, SQ
Close: 230.92
Pre: 232.85 (+0.84%)
Stop: 193.97
SQ is in a technical uptrend above all key rising MAs and recently corrected 9.2% off of all-time highs. $200 is a key longer-term support level.
1/13/21
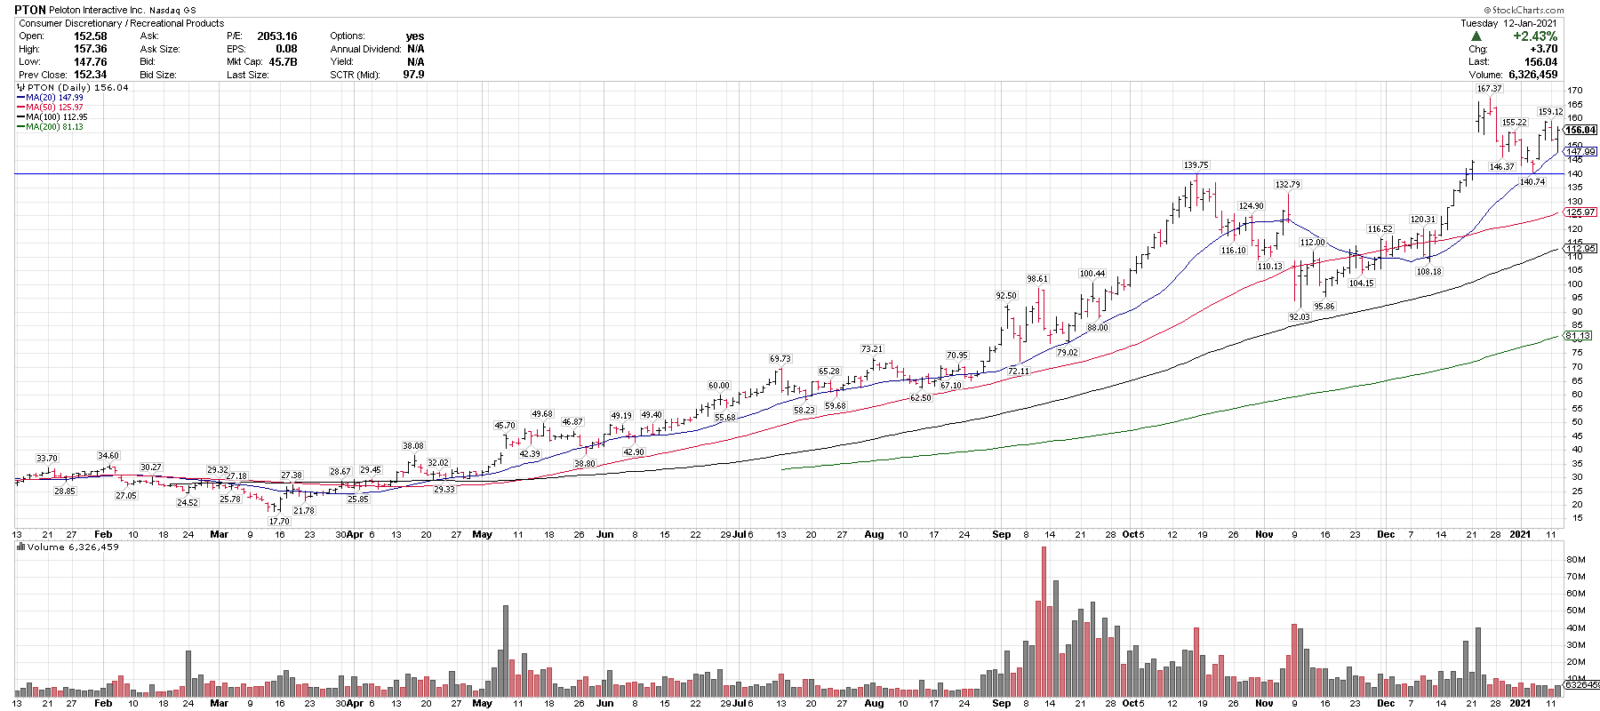
Peloton, PTON
Close: 156.04
Pre: 156.40
Stop level: 131.07
PTON is in a technical uptrend above all key rising MAs and recently corrected 15.9% off all-time highs into the 20-sma and the key $140 breakout/support level.
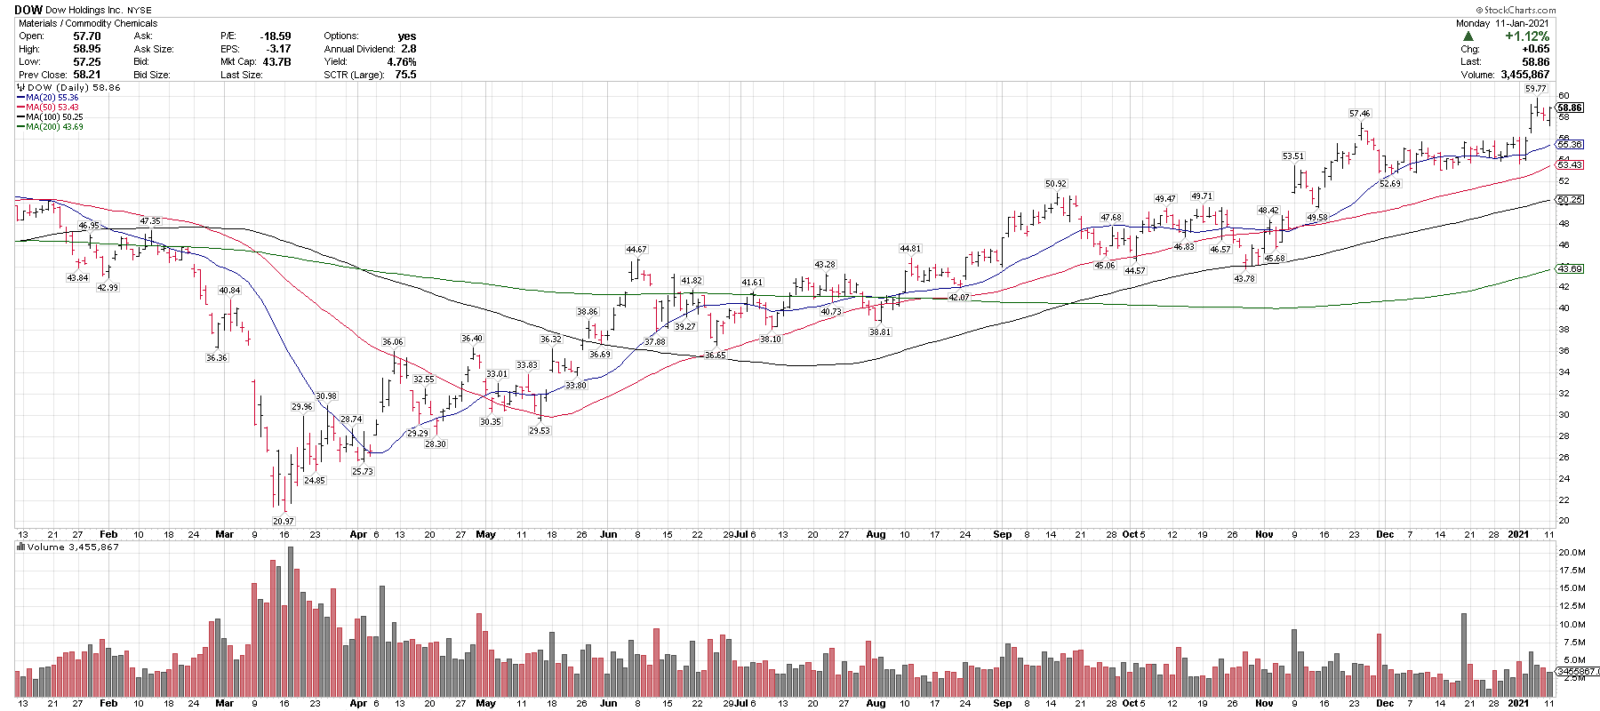
1/12/21
Dow Holdings, DOW
Close: 58.89
Pre: 59.10
Stop: 49.80
DOW is in a technical uptrend above all key rising MAs and is testing new highs. 50, 52, 54 and 56 are support levels on any pullbacks. DOW is on this week’s Top 25 List.
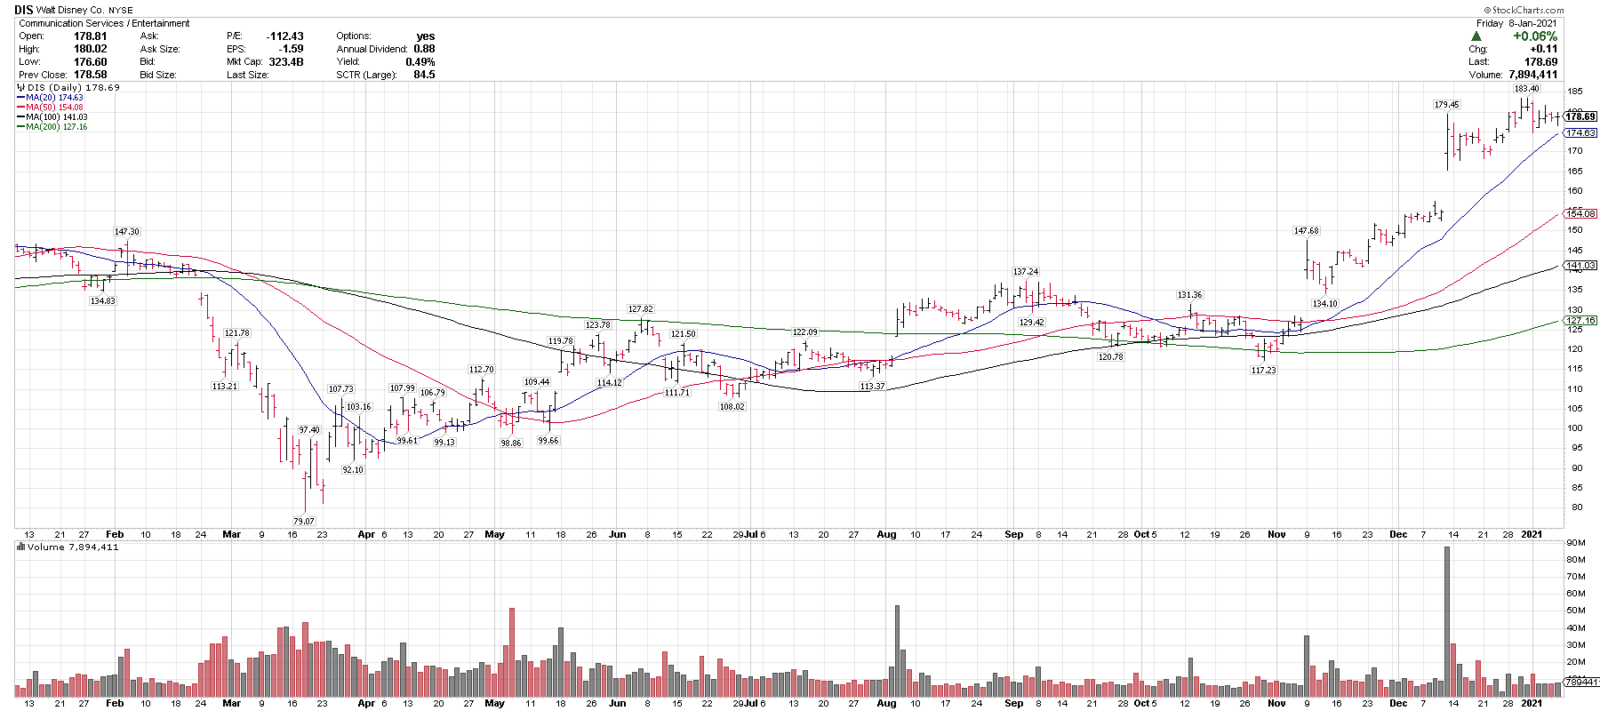
1/11/21
Disney, DIS
Close: 178.69
Pre: 177.97
Stop: 151.88
DIS is in a technical uptrend above all key rising MAs and recently broke out to new highs. 165 & 155 are key support levels. Over 185 could signal a breakout higher. On this week’s Top 25 list.
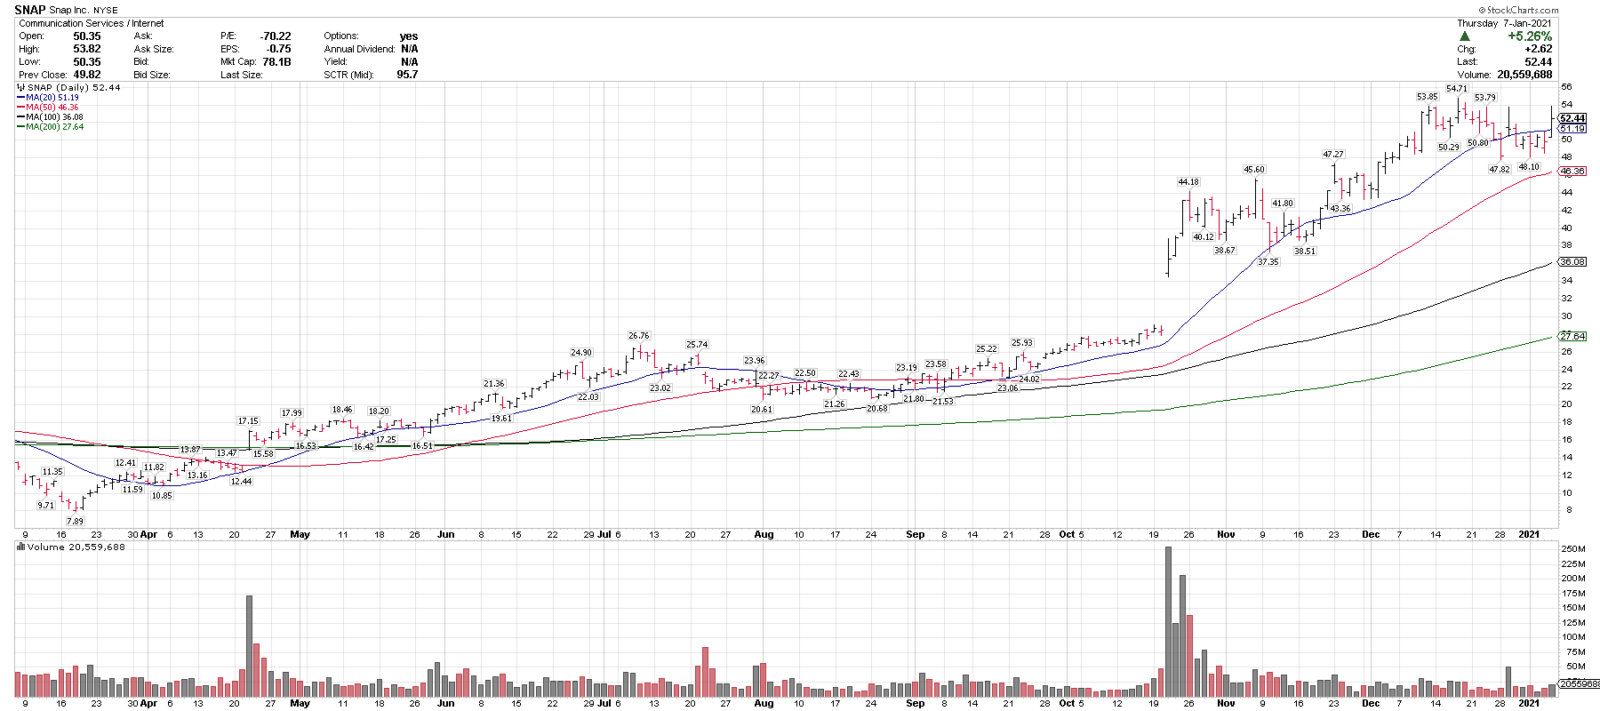
1/08/21
Snapchat, SNAP
Close: 52.44
Pre: 53.17
Stop: 43.97
SNAP is in a technical uptrend above all key rising MAs & recently pulled back 12.5% off all-time highs. 44-48 is a support range and over 56 could signal a new breakout. SNAP is on our 2021 Communication Services Focus Group list and the group overall is set up well here. https://twitter.com/BlueChipPremium/status/1347535224364802048
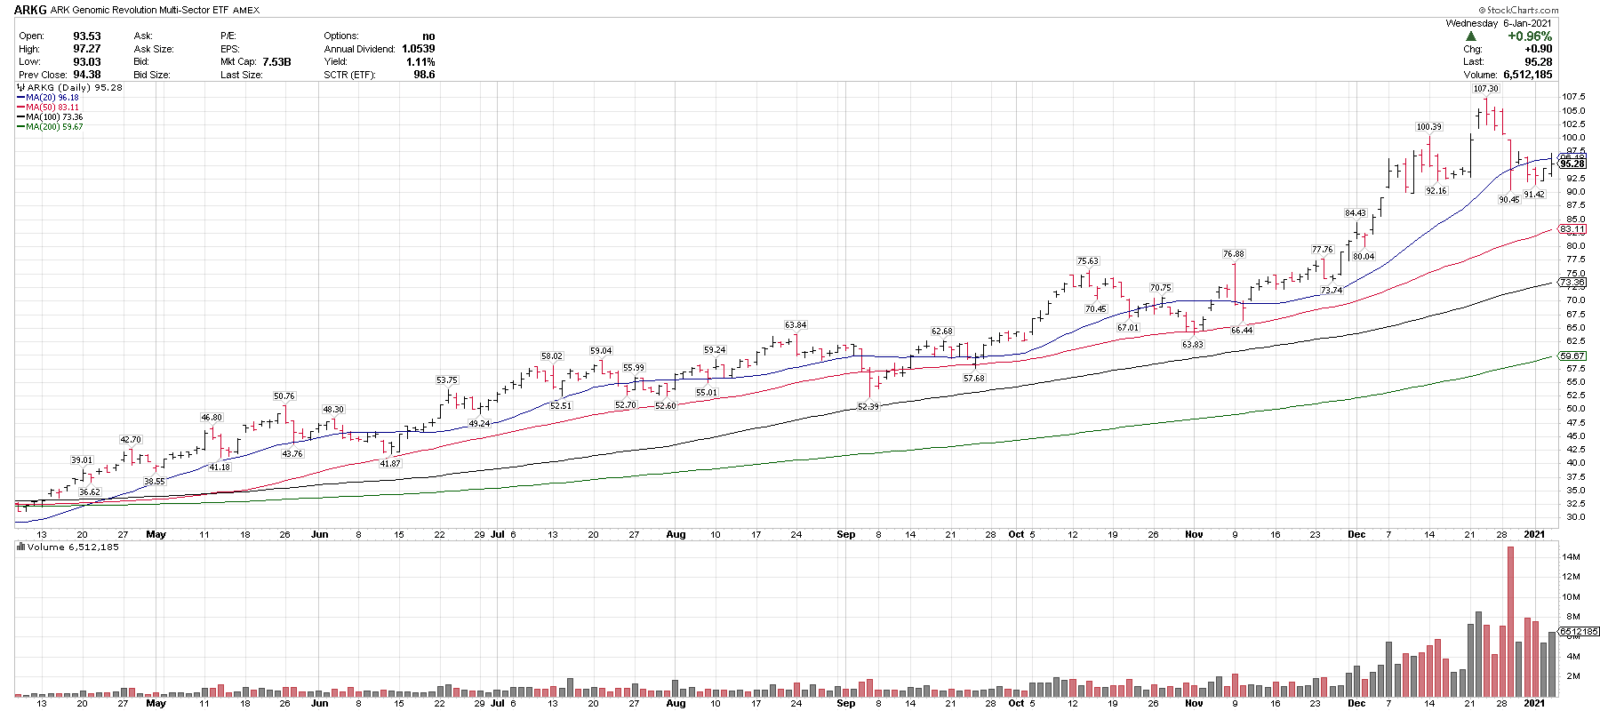
1/07/21
ARK Genomics ETF, ARKG
Close: 95.28
Pre: 97.19
Stop: 79.83
ARKG is in an uptrend above rising 50, 100 & 200-sma & recently corrected 15.6% off all-time highs. 90 is a near term support level & then the 50-sma. ARKG has been on our Weekly ETF buy list for most of the last 24 weeks. Genomics is one of the few sectors that I look to the ETF more than the individual stocks, due to their volatility. CRSP, in that ETF, has been on the Spec Ideas List since 12/21.
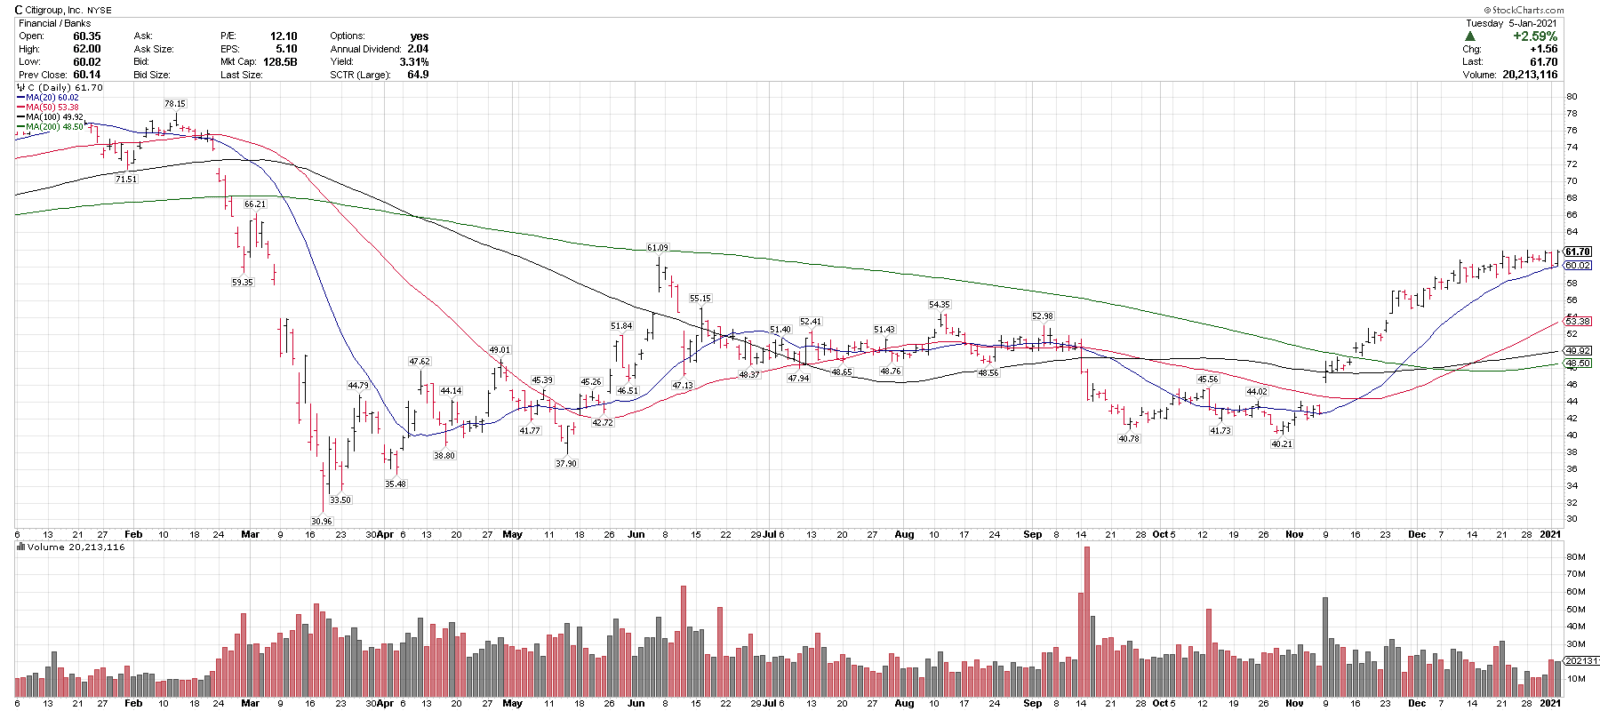
1/06/21
Citigroup, C
Close: 61.70
Pre: 63.52
Stop: 52.44
C is in a technical uptrend above all key rising MAs and closed at a 10-month high yesterday. The 200-sma recently turned up as well. C is on our Top 25 List for 2021 also, published last Saturday. Most financials are trading up pre-market and set up well. BAC, JPM, WFC, etc.
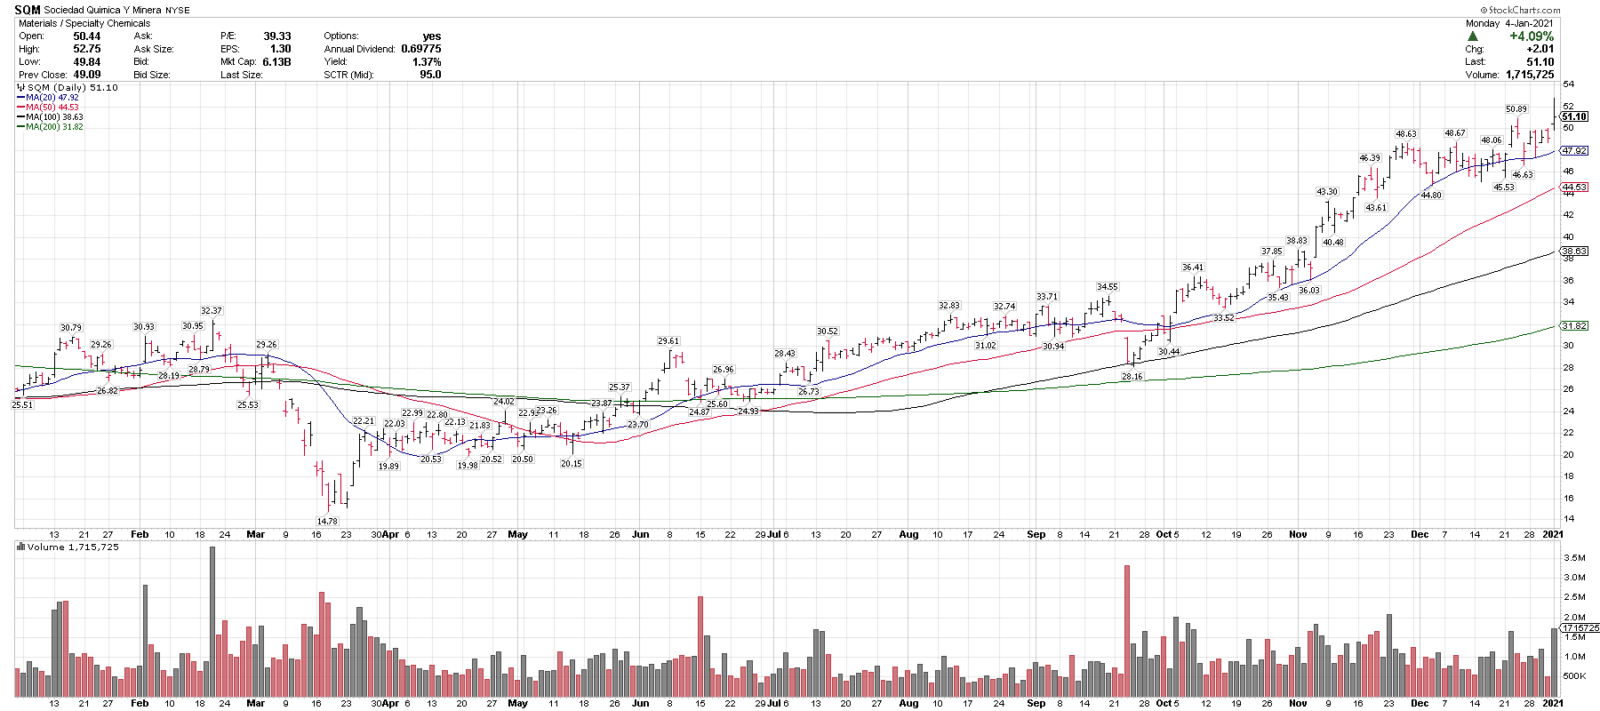
1/05/21
Sociedad Quimica y Minera, SQM
Close: 51.10
Pre: 51.69
Stop: 43.43
SQM is in a technical uptrend above all key rising MAs and closed at an 18-month high yesterday. There is key support at 46-48. Over the 50-sma keeps the major uptrend intact. SQM is on this week’s Mid Cap Buy List, in the Materials/Lithium sector. ALB is a larger cap name in this sector.
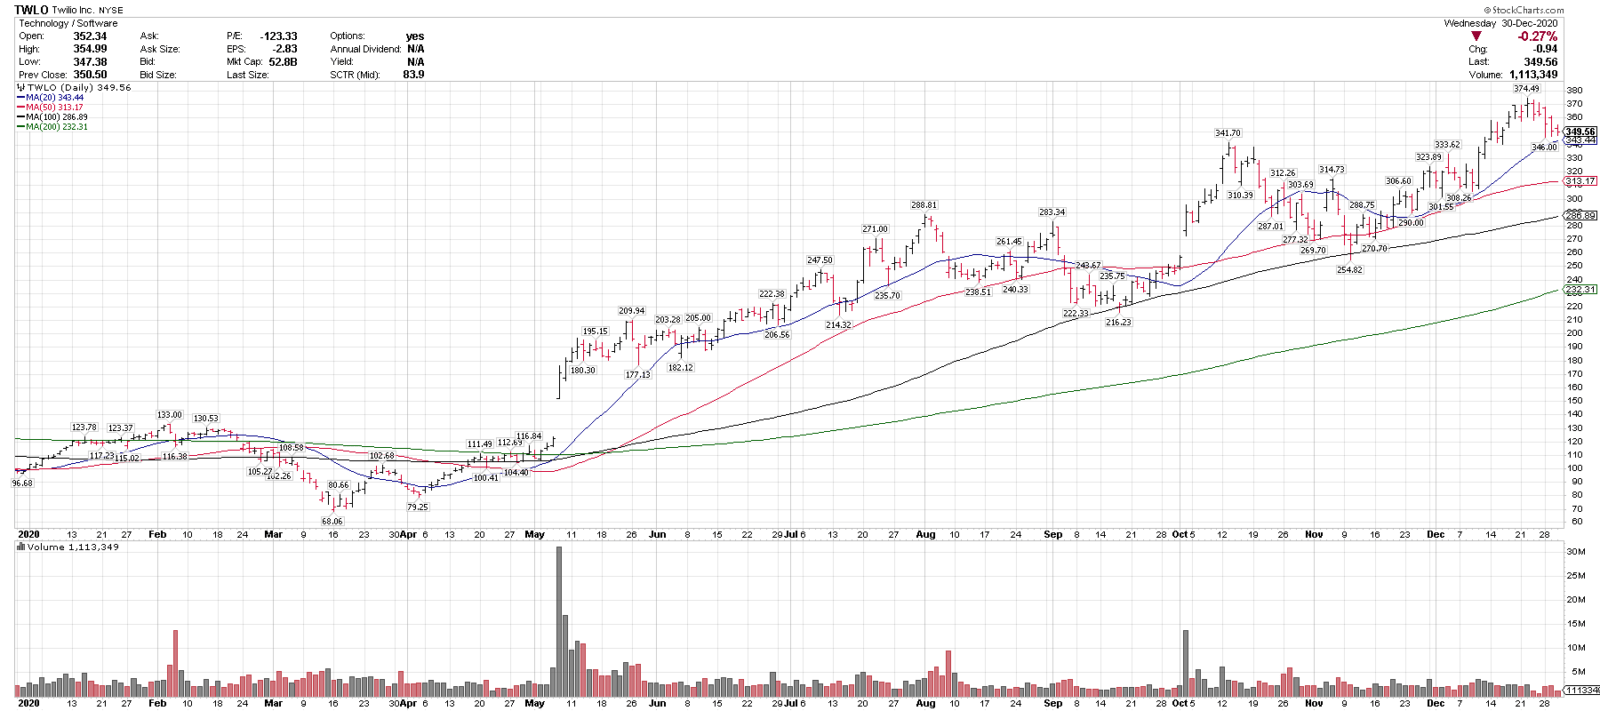
12/31/20
Twilio, TWLO
Close: 349.56
Pre: 352.00 (+.70%)
Stop: 297.12
TWLO is in a technical uptrend above all key rising MAs and recently pulled back 7.6% off of all time highs, into the rising 20-sma. There is key support in the 300-340 range.
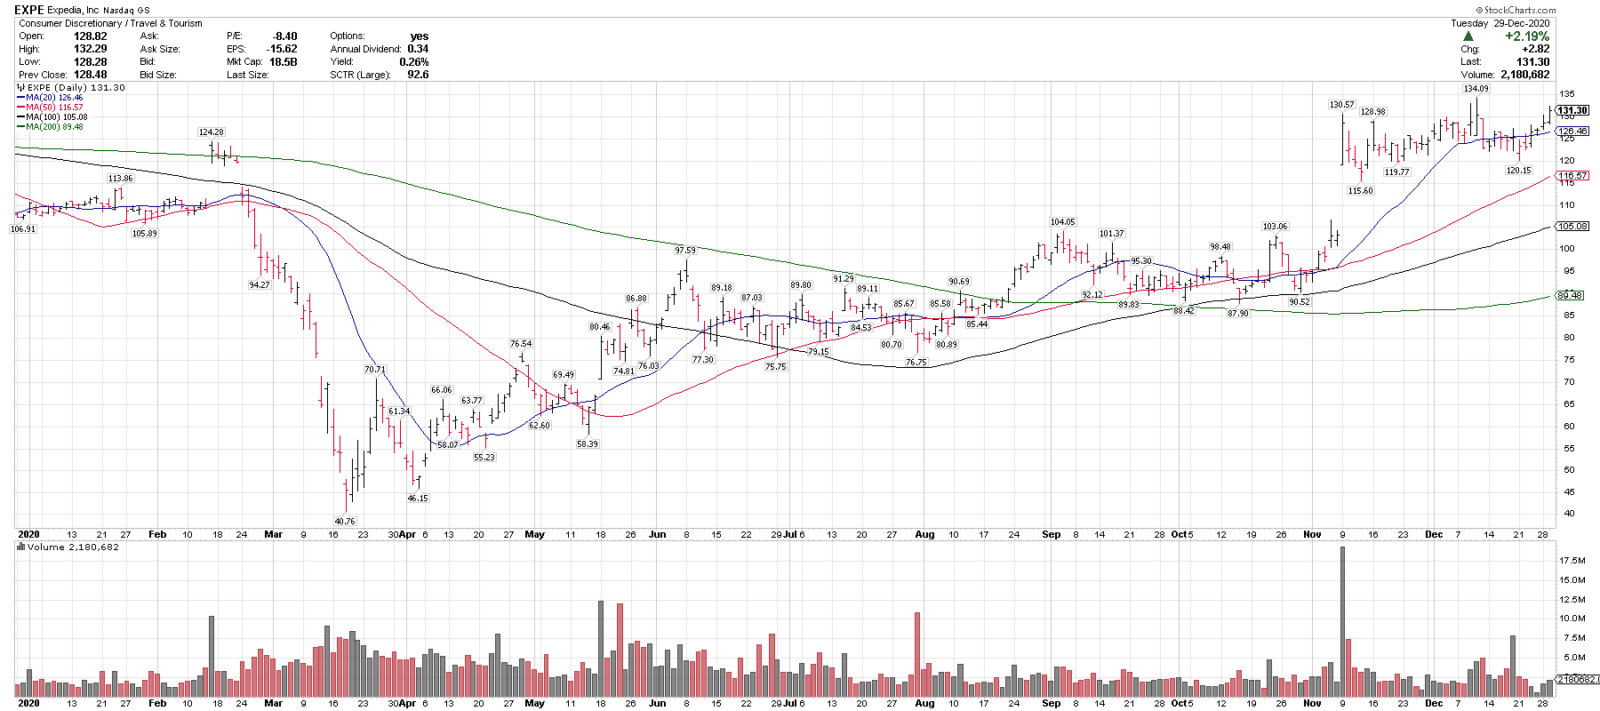
12/30/20
Expedia, EXPE
Close: 131.30
Pre: 132.60
Stop: 111.21
EXPE is in a technical uptrend above all key rising MAs and closed at a 13-month high yesterday. The 200-sma has started to turn up. 130 & 135 are key breakout levels and support is at 115-120.
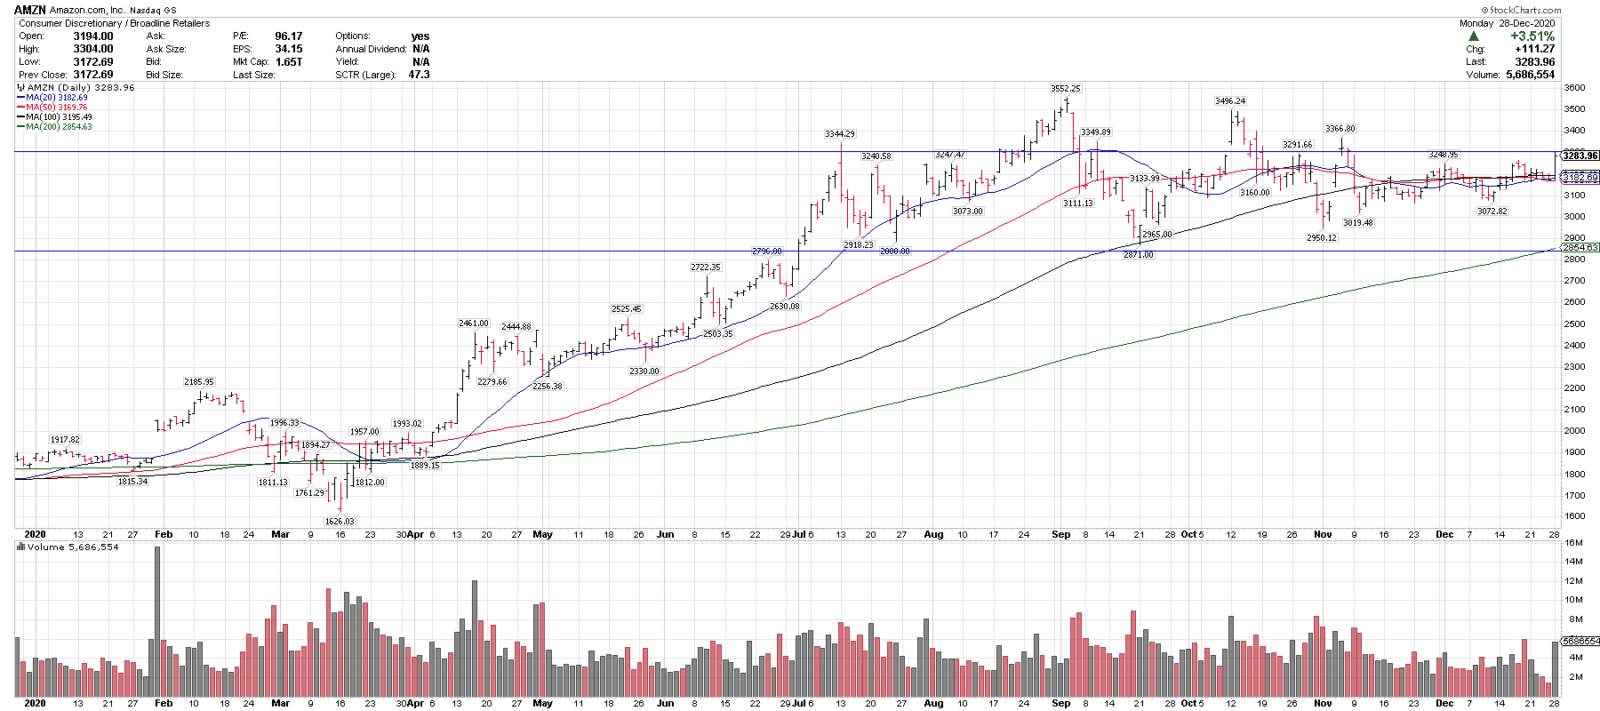
12/29/20
Amazon, AMZN
Close: 3283.96
Pre: 3312.32
Stop: 2849.00
AMZN is trading in a 6 month range, but testing over key technical level $3300 pre-market & closed at a 50-day high yesterday. A close > 3300 could signal a breakout higher & 2900-3000 is a key support level.
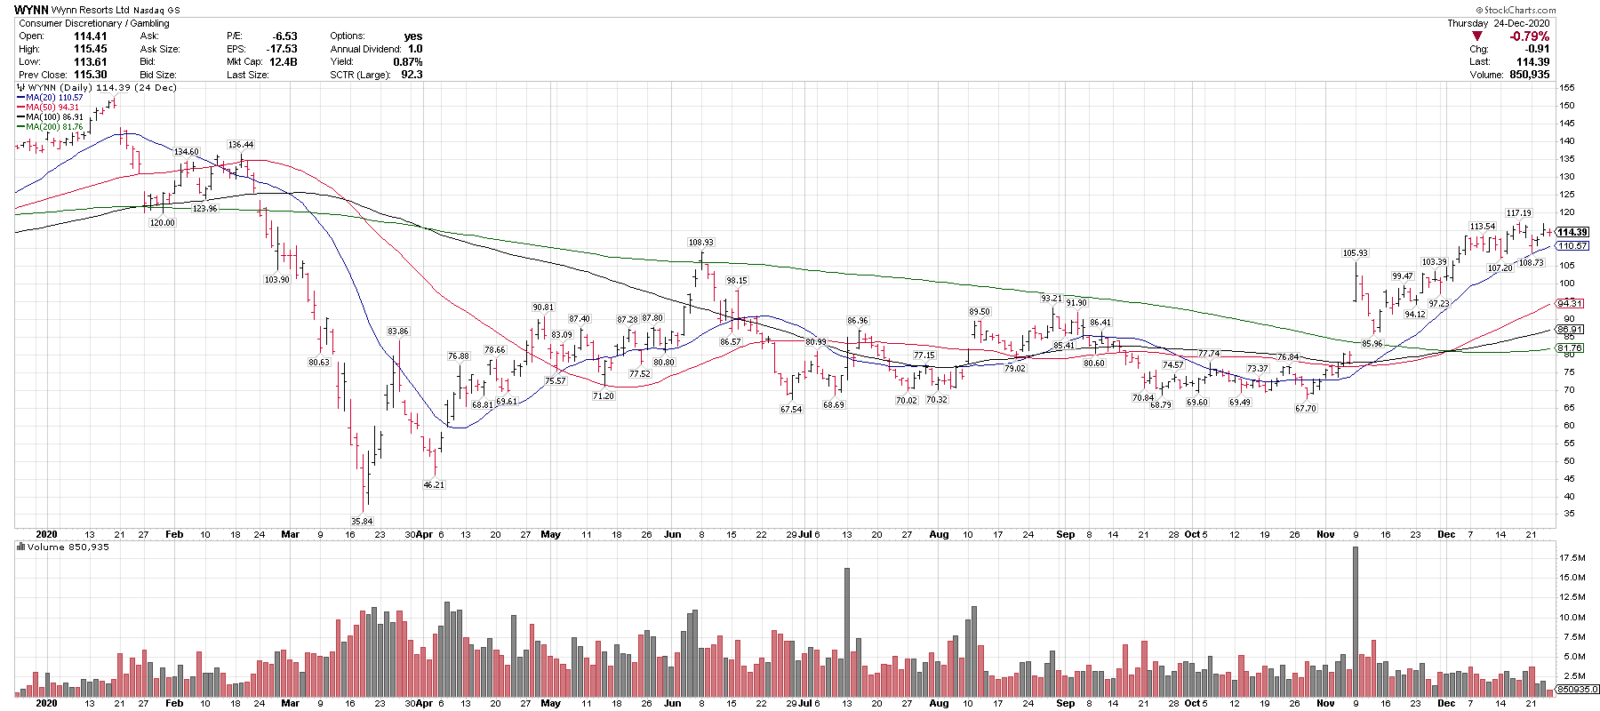
12/28/20
Chart of the Day (also the Chart of the Week)
Wynn Resorts, WYNN
Close: 114.39
Stop: 96.93
WYNN is in a technical uptrend above all key rising MAs, recently made a 10-month high & the 40-week MA has turned up. WYNN recently broke out above $100, a key technical level going back to 2007.
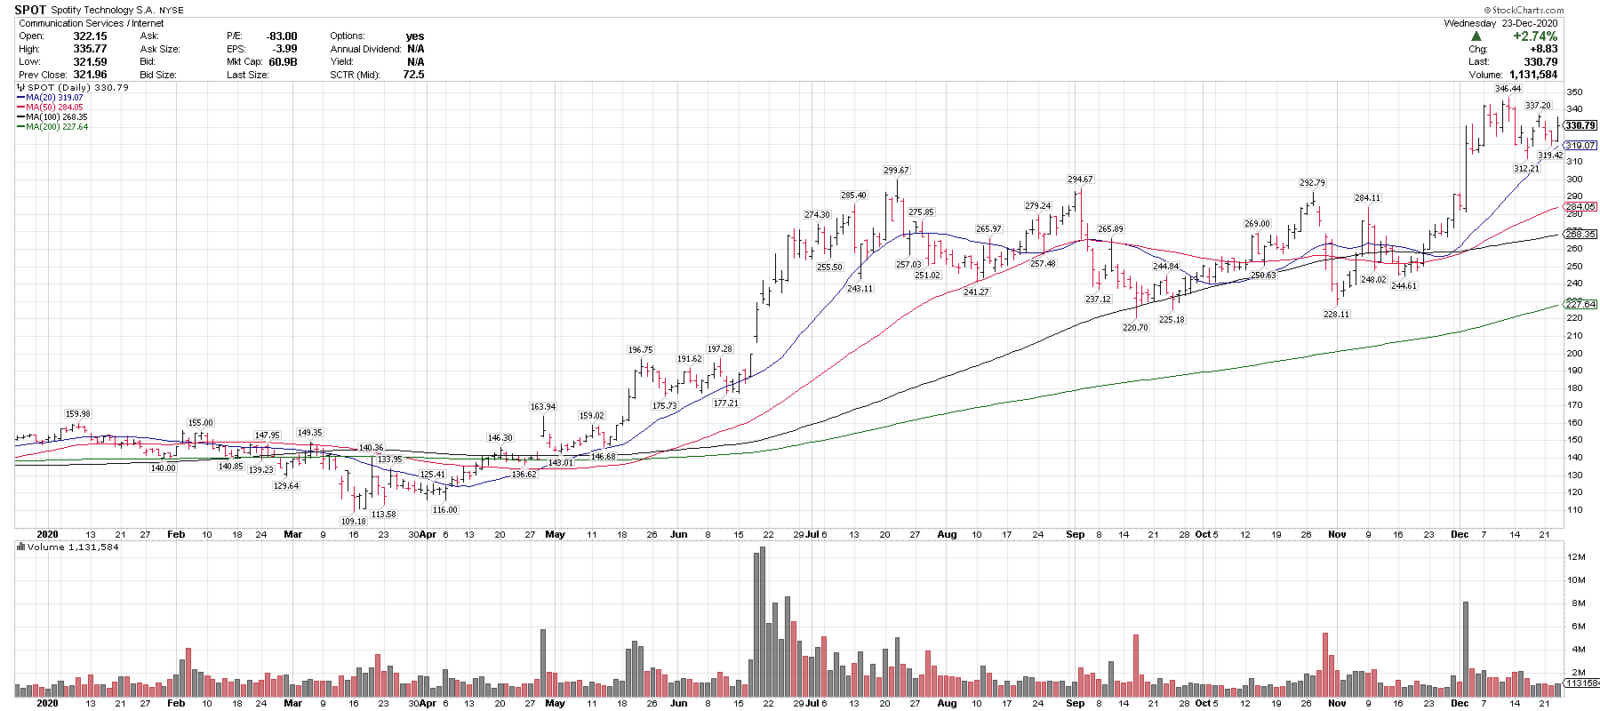
12/24/20
Spotify, SPOT
Close: 330.79
Pre: 332.00
Stop: 279.80
SPOT is in a technical uptrend above all 4 rising MAs and recently corrected 9.8% off of all-time highs into the rising 20-sma. This recent breakout stays intact over $300. Also, on this week’s Top 25 list.
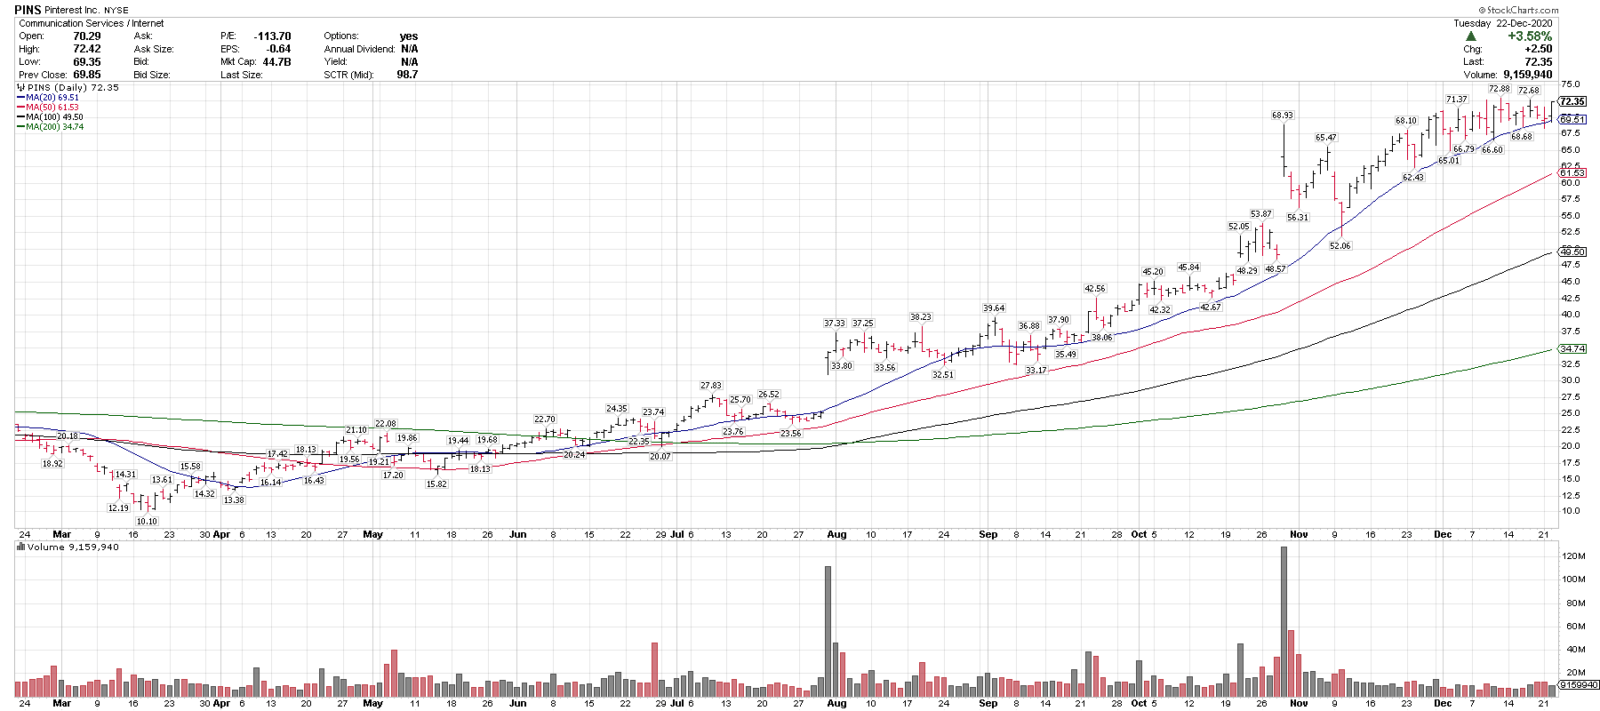
12/23/20
Pinterest, PINS
Close: 72.35
Pre: 72.98
Stop: 61.49
PINS is in a technical uptrend above all key rising MAs and is setting up for a possible breakout to new highs. The rising 50-sma below, which has held since May, is a key trend signal.
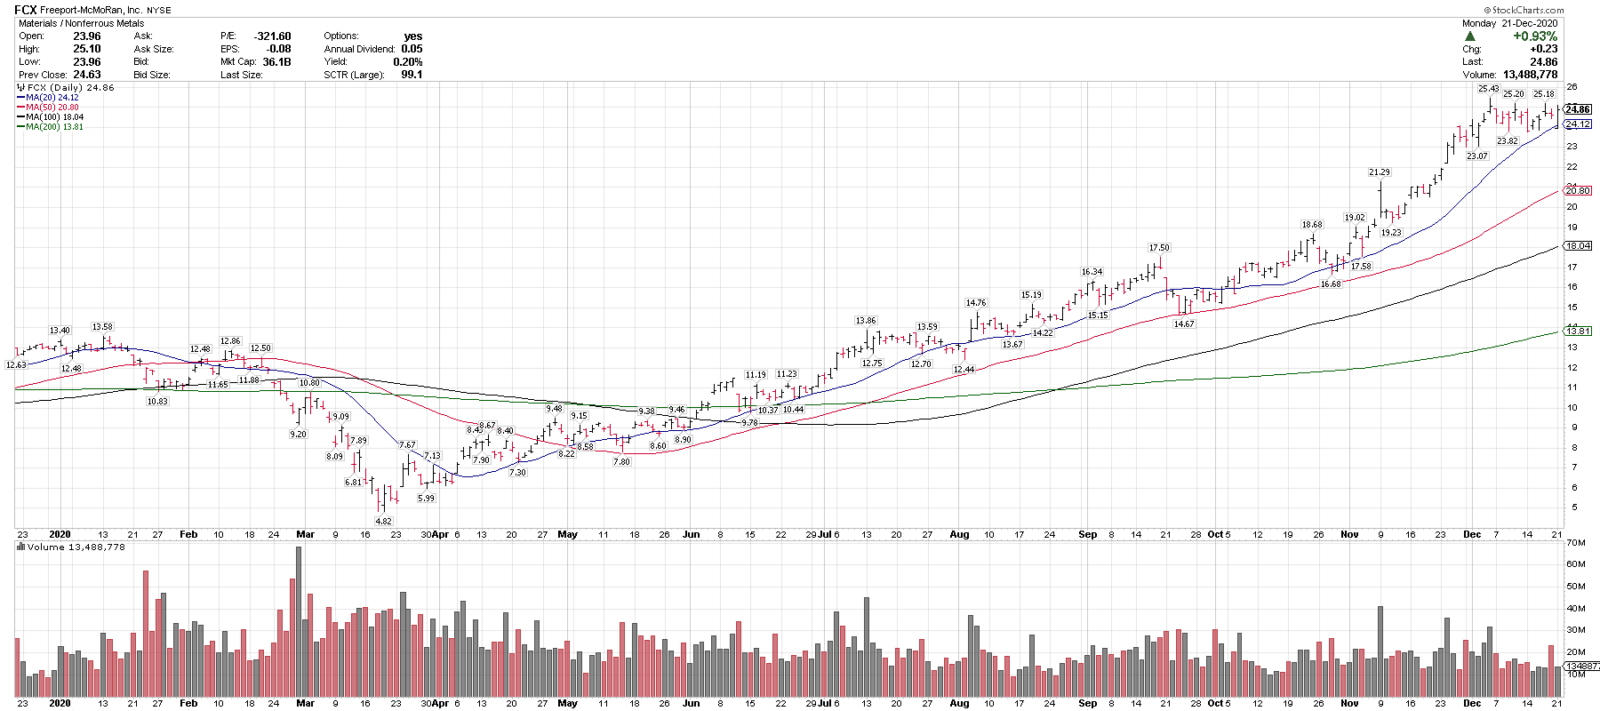
12/22/20
Freeport McMoran, FCX
Close/pre: 24.86
Stop level: 20.78
FCX is in a technical uptrend above all key rising MAs, and is testing a breakout to multi-year highs. The rising 50-sma is a strong trend signal here.
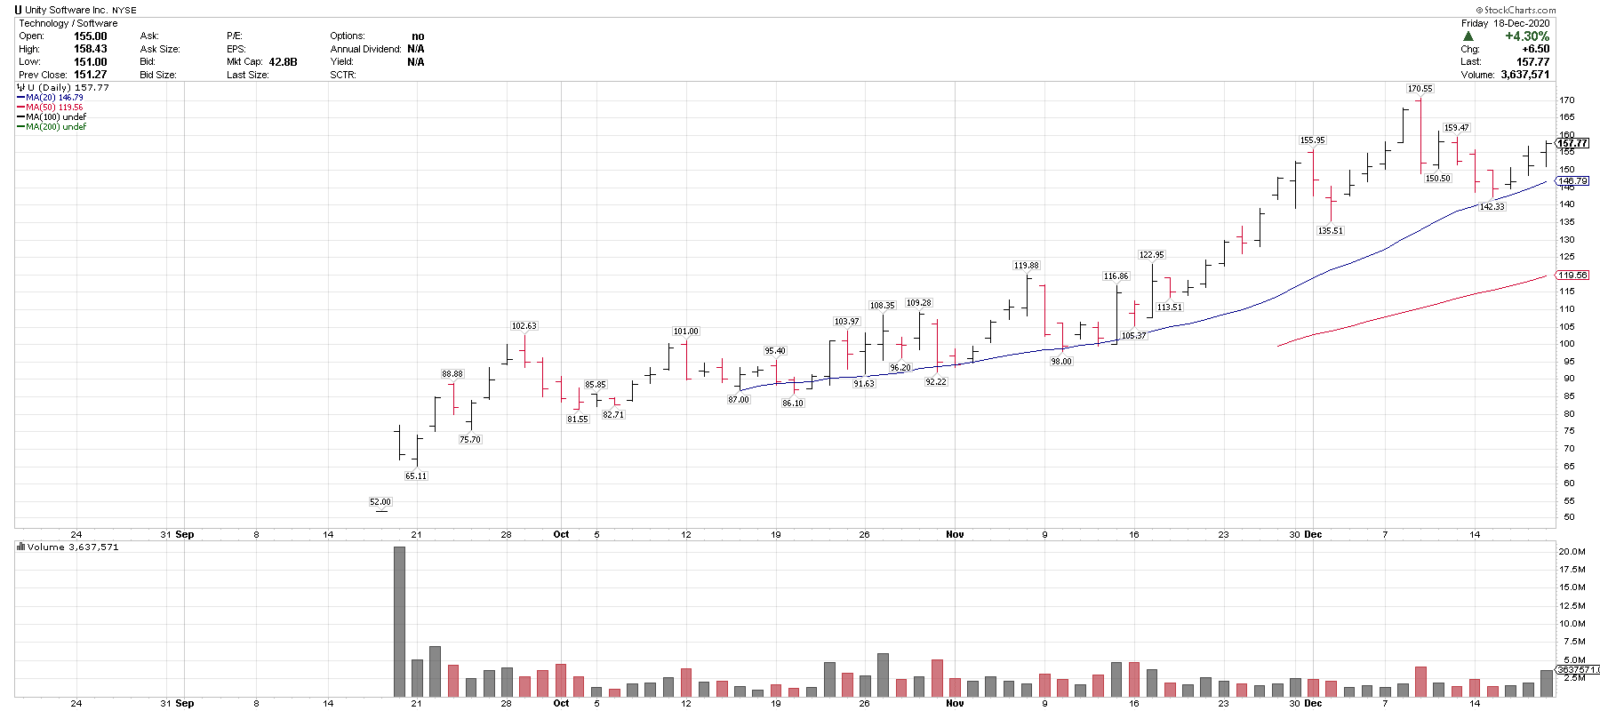
12/21/20
Unity Software, U
Close: 157.77
Pre-mkt: 154.56
Stop: 129.83
U is in a technical uptrend above the rising 20 & 50-sma, and recently pulled back 16.5% off all-time highs and held at the rising 20-sma. It is pulling back with the index pre-market.
12/18/20
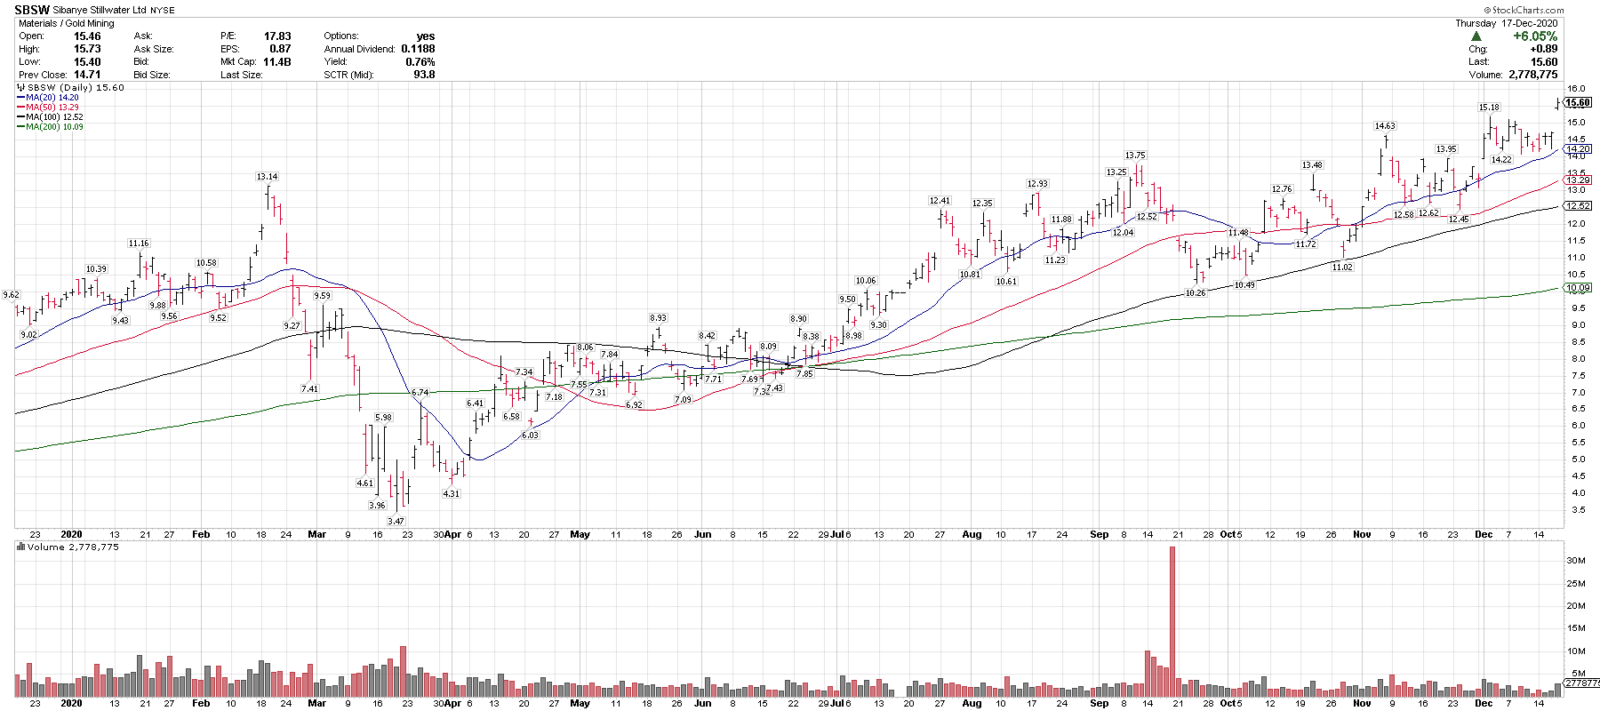
Sibanye Stillwater, SBSW
Close: 15.60
Pre: 16.30
Stop level: 13.08
SBSW is in a technical uptrend above all key MAs & recently broke out to new highs. It is a large cap technical leader in it’s industry currently and the first to break out. The stock is trading up pre-market. Some take ideas at the market, some wait for a potential pullback.
12/17/20
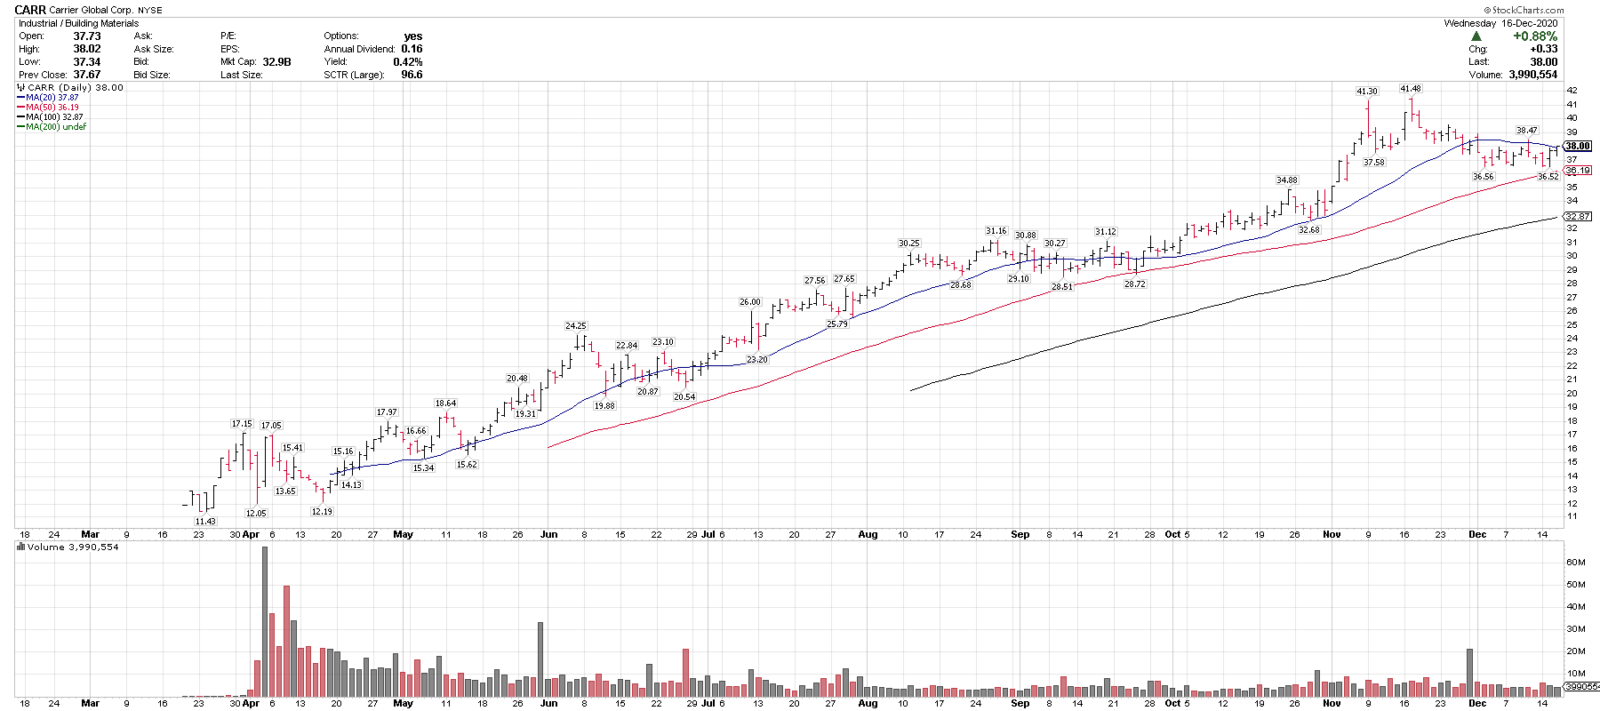
Carrier, CARR
Close: 38.00
Pre: 38.27
Stop: 32.28
CARR is in a technical uptrend above the rising 50 & 100-sma and reclaimed the 20-sma yesterday after a 11.9% pullback off all-time highs. The 50-sma and $35 are key support on any pullbacks.
12/16/20
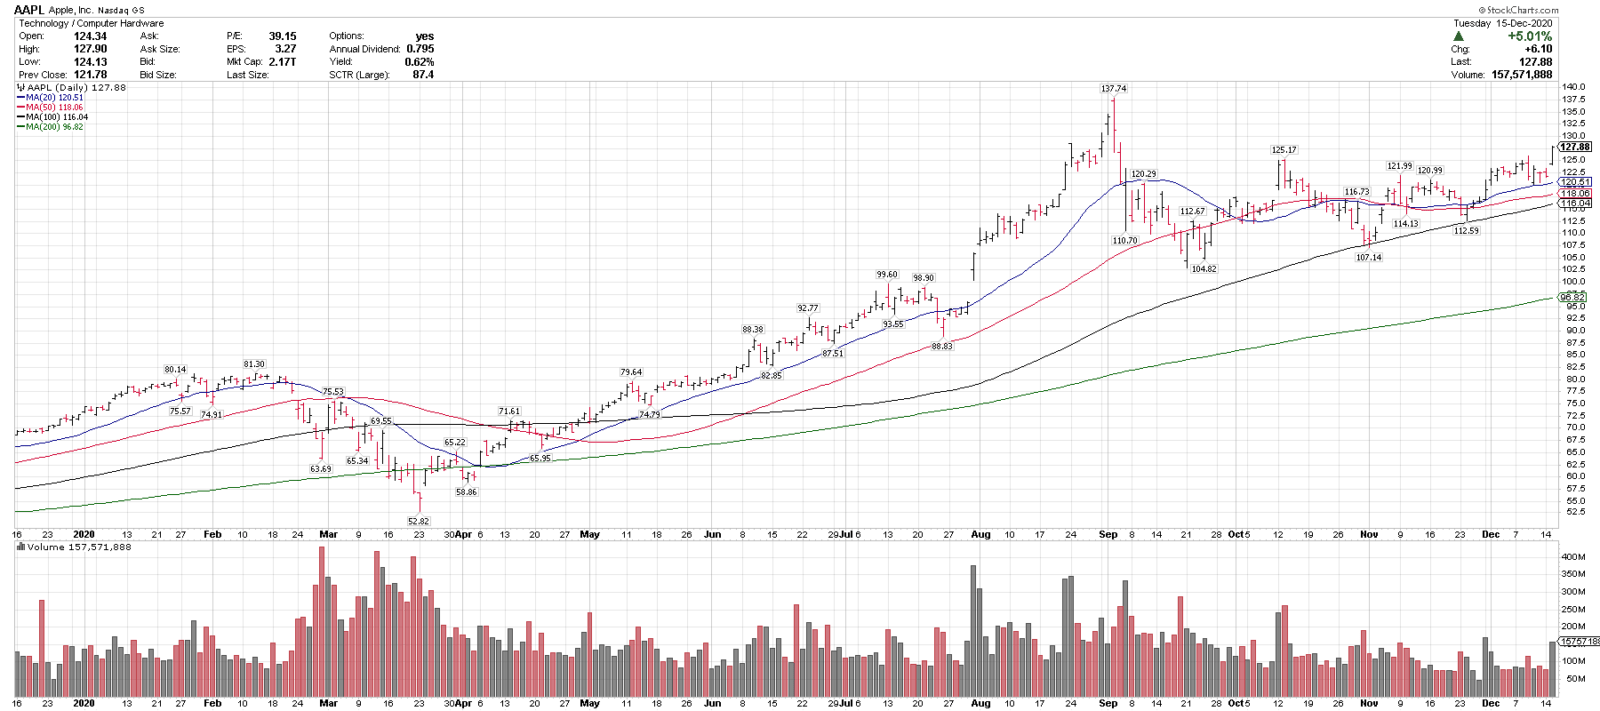
Apple, AAPL
Close: 127.88
Pre: 127.70
Stop: 108.69
AAPL broke out to a 100-day high yesterday on above average volume & it’s first close over $125 since early Sept. AAPL is in a technical uptrend above all key rising MAs and above a 3-month price base.
12/15/20
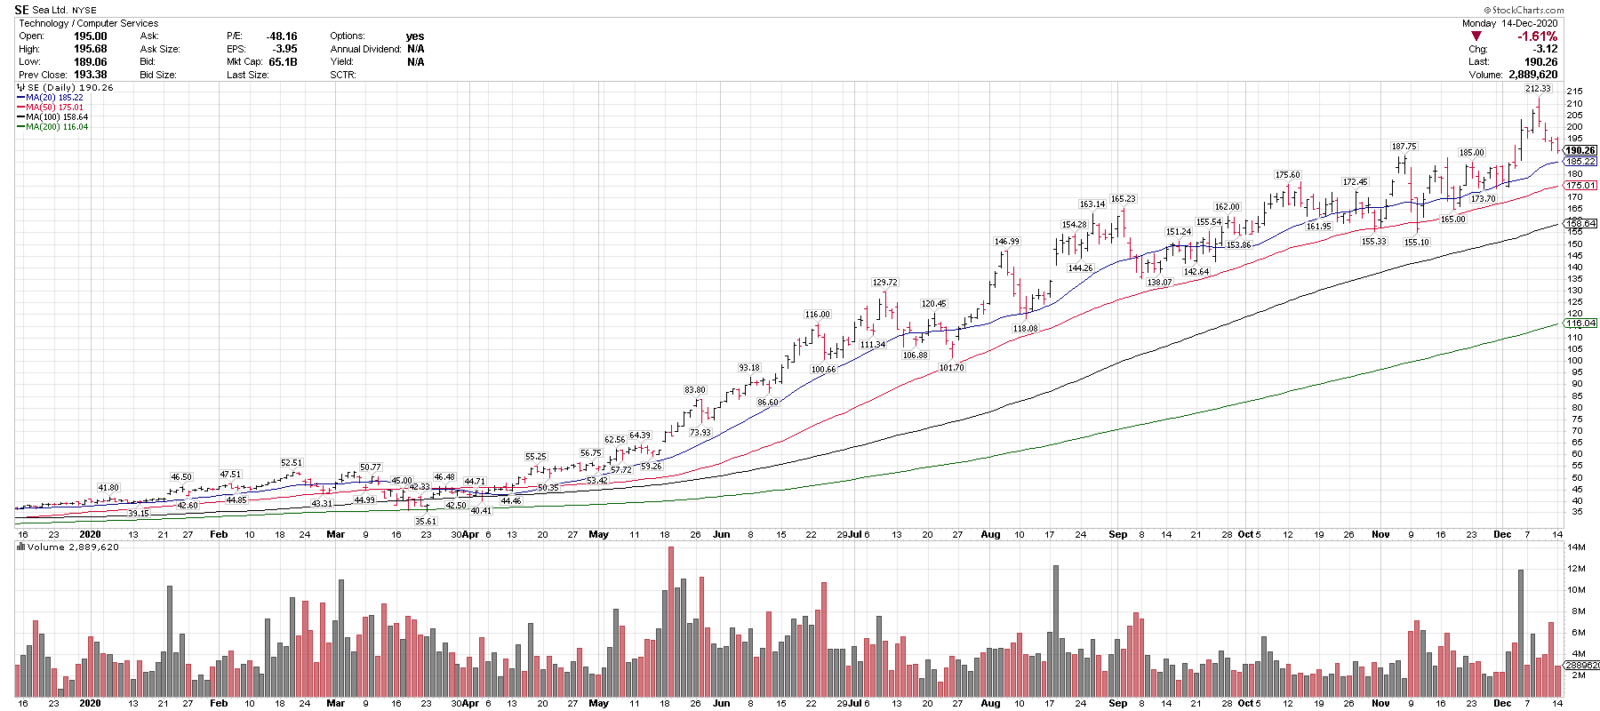
Sea Limited, SE
Close: 190.26
Pre: 192.00
Stop level: 159.81
SE is in a technical uptrend above all key rising MAs and recently corrected 10.3% off of all-time highs. $175 is key support on any pullbacks.
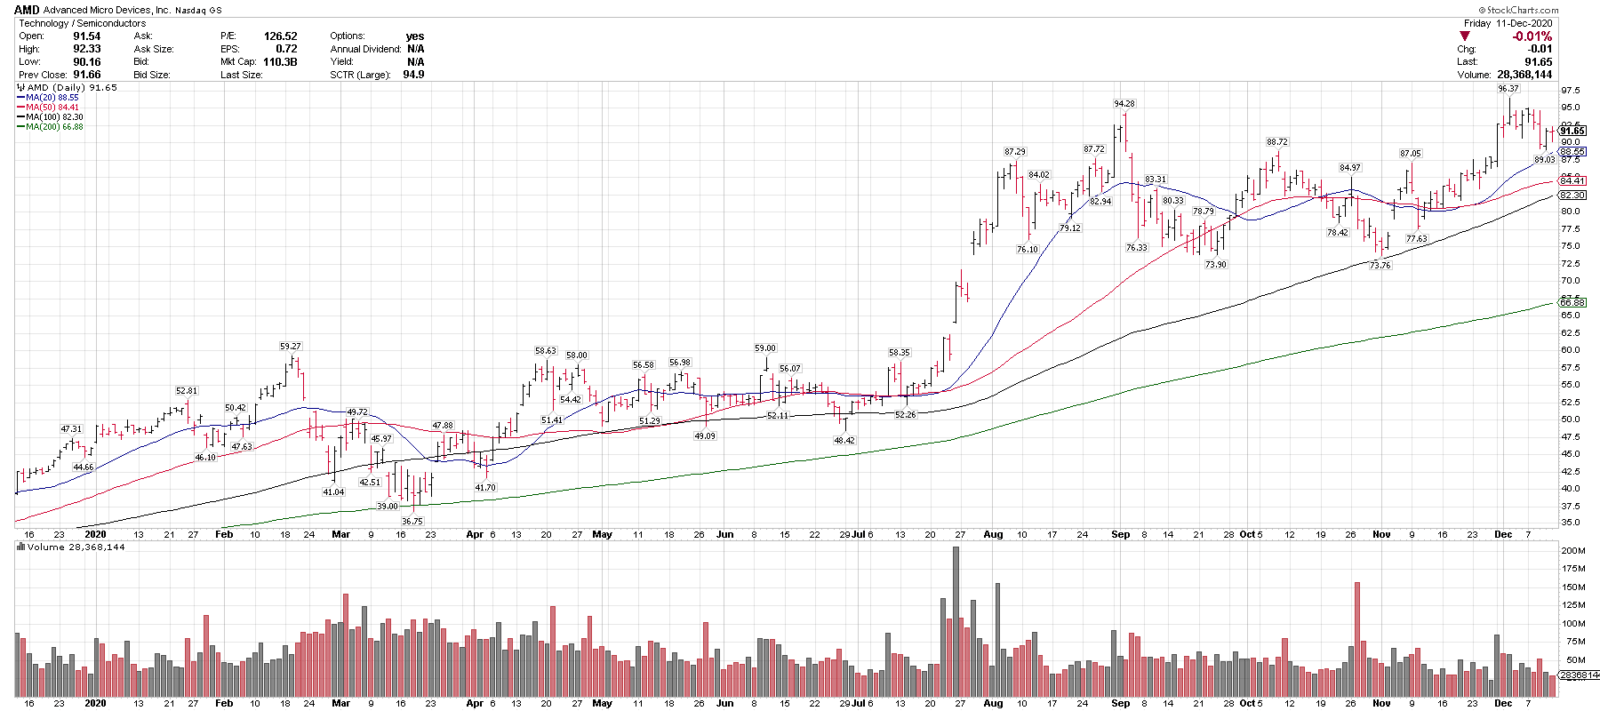
12/14/20
Advanced Micro Devices, AMD
Close: 91.65
Pre: 92.28
Stop: 77.90
AMD is in a technical uptrend above all key MAs and recently corrected 7.6% off all-time highs. Over $97.50 could signal a new breakout higher.
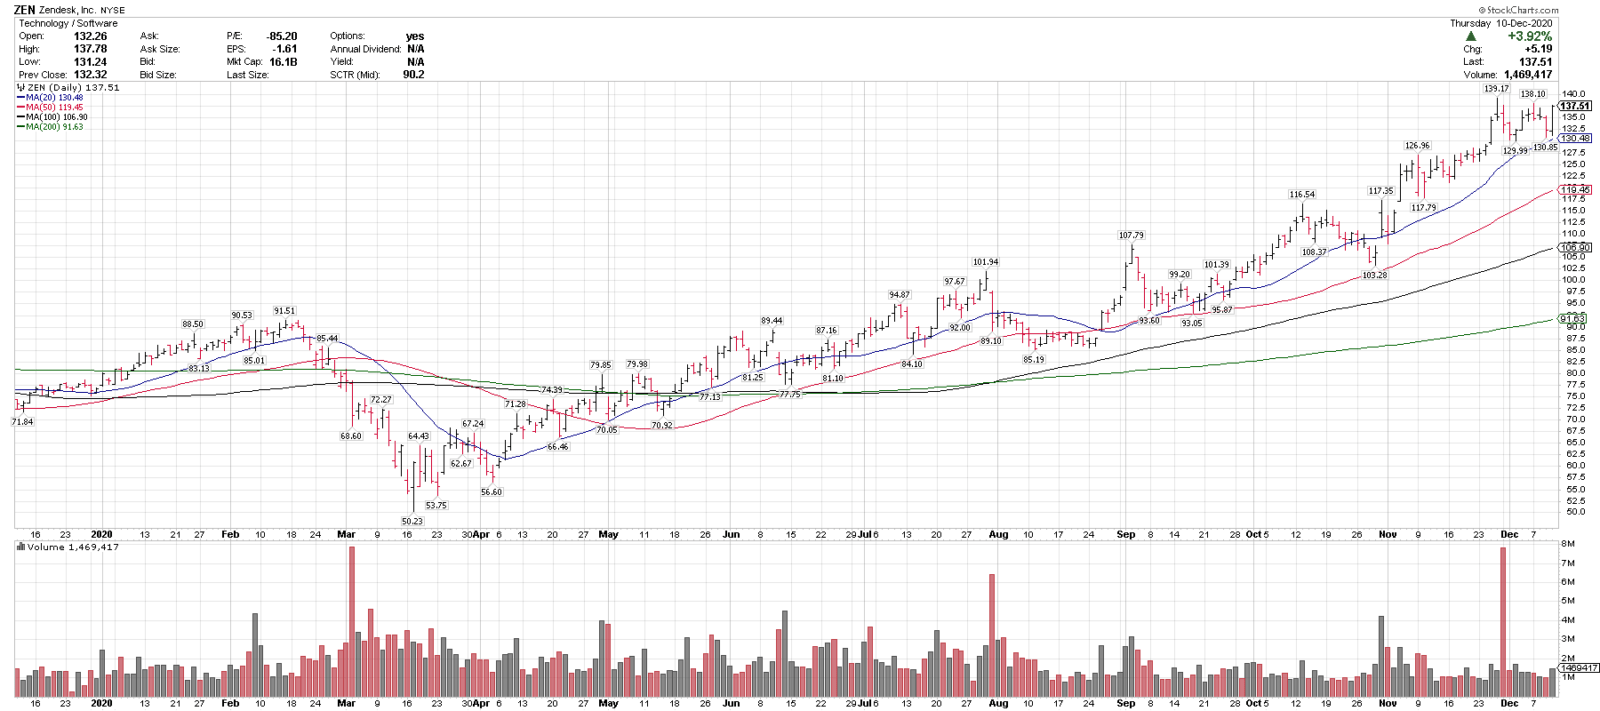
12/11/20
Zendesk, ZEN
Close: 137.51
Pre: 139.00
Stop level: 116.88
ZEN is in a technical uptrend above all key rising MAs and recently corrected 6.5% off of all-time highs. There is support in the $117.50-$127.50 range.
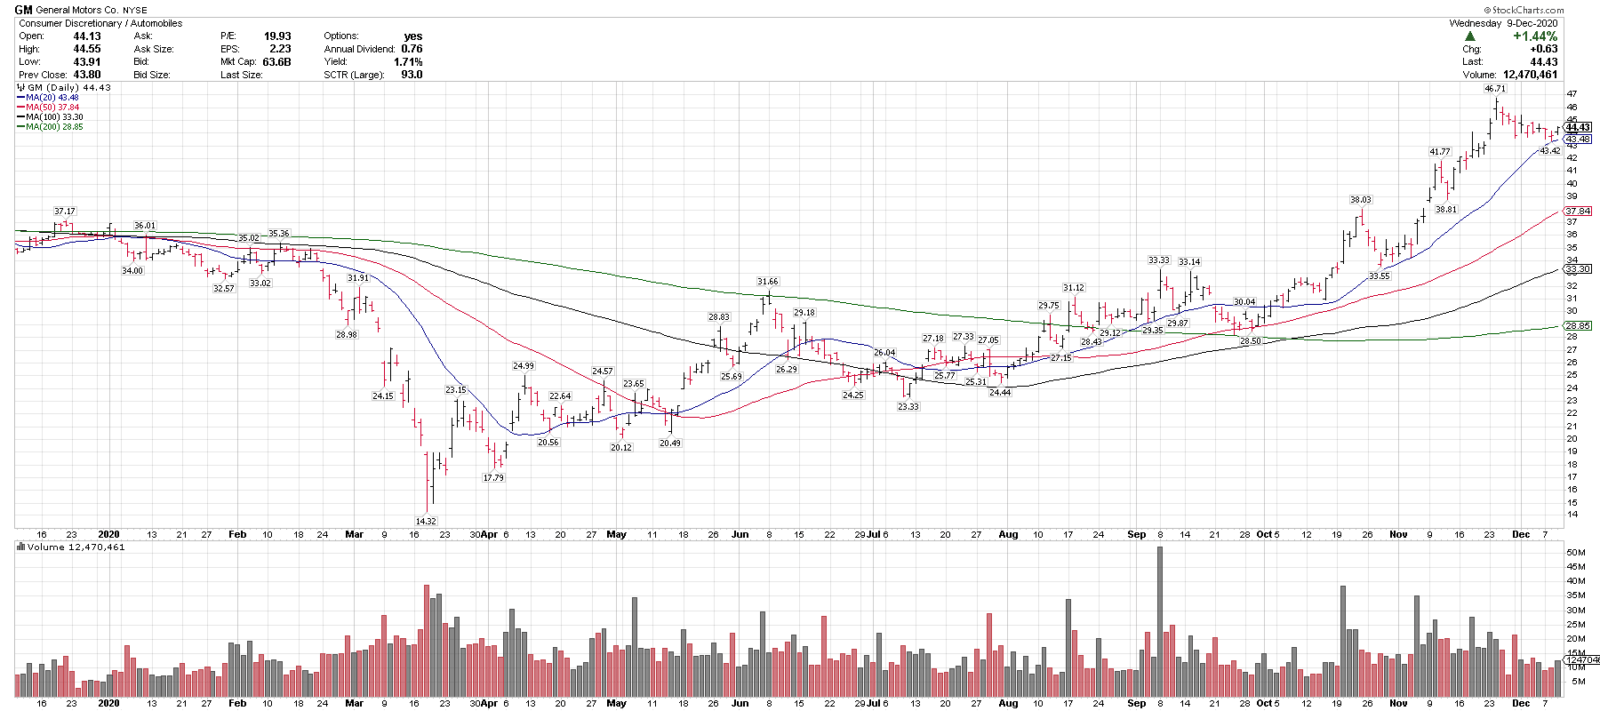
12/10/20
General Motors, GM
Close: 44.43
Pre-mkt: 44.29
Stop: 37.76
GM is in a technical uptrend above all key rising MAs and recently pulled back 7.0% off all-time highs. $42 and $38 are key support levels.
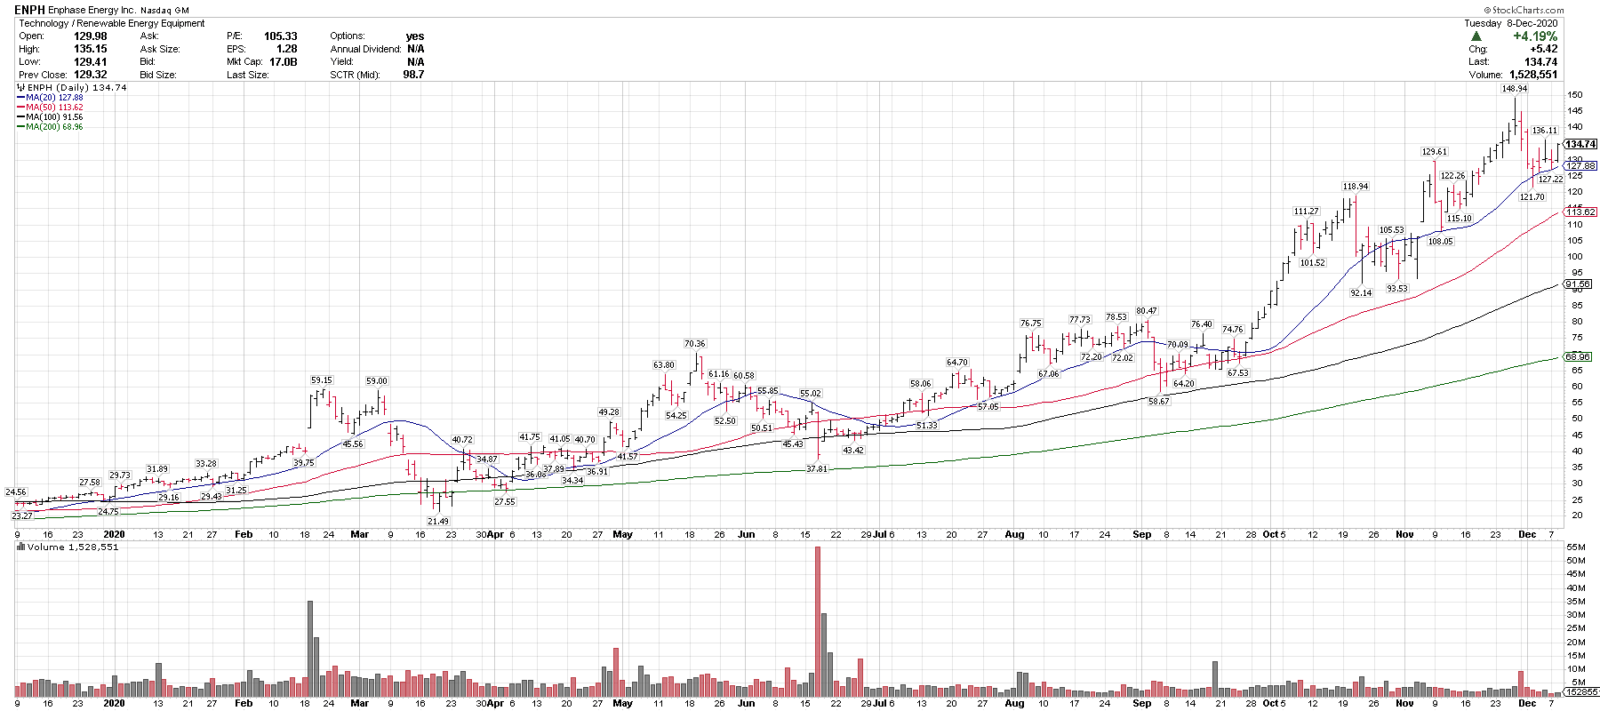
12/09/20
Enphase, ENPH
Close: 134.74
Pre: 135.94
Stop: 111.83
ENPH is in a technical uptrend above all key rising MAs & recently pulled back 18.2% off of all-time highs. 115 & 125 are key support levels. TAN is a lower volatility ETF option for the group.
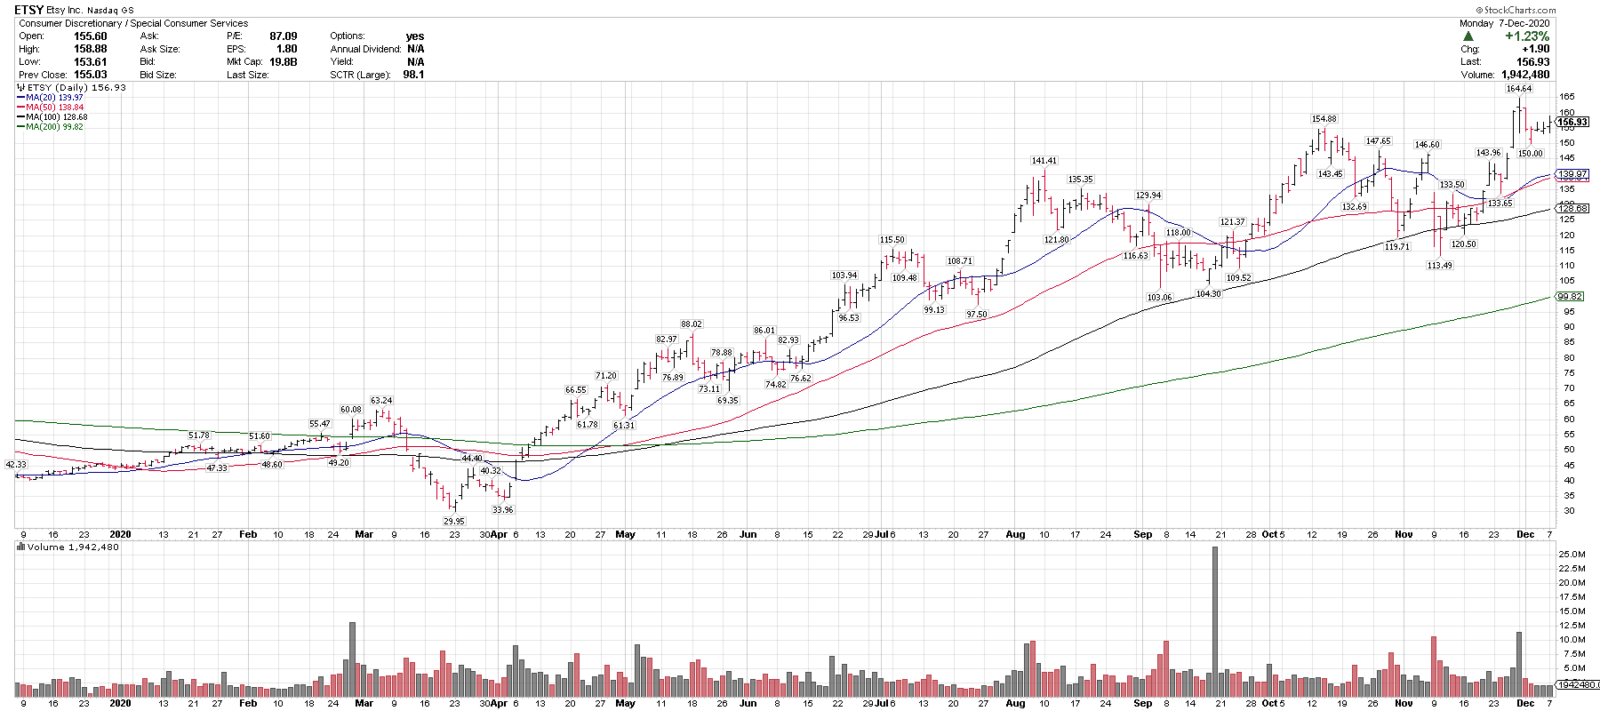
12/08/20
Etsy, ETSY
Close: 156.93
Pre: 157.32
Stop level: 129.78
ETSY is in a technical uptrend above all key rising MAs and recently corrected 8.8% off all-time highs. 135-150 is a key support range on any pullbacks. On this week’s Top 25 list.
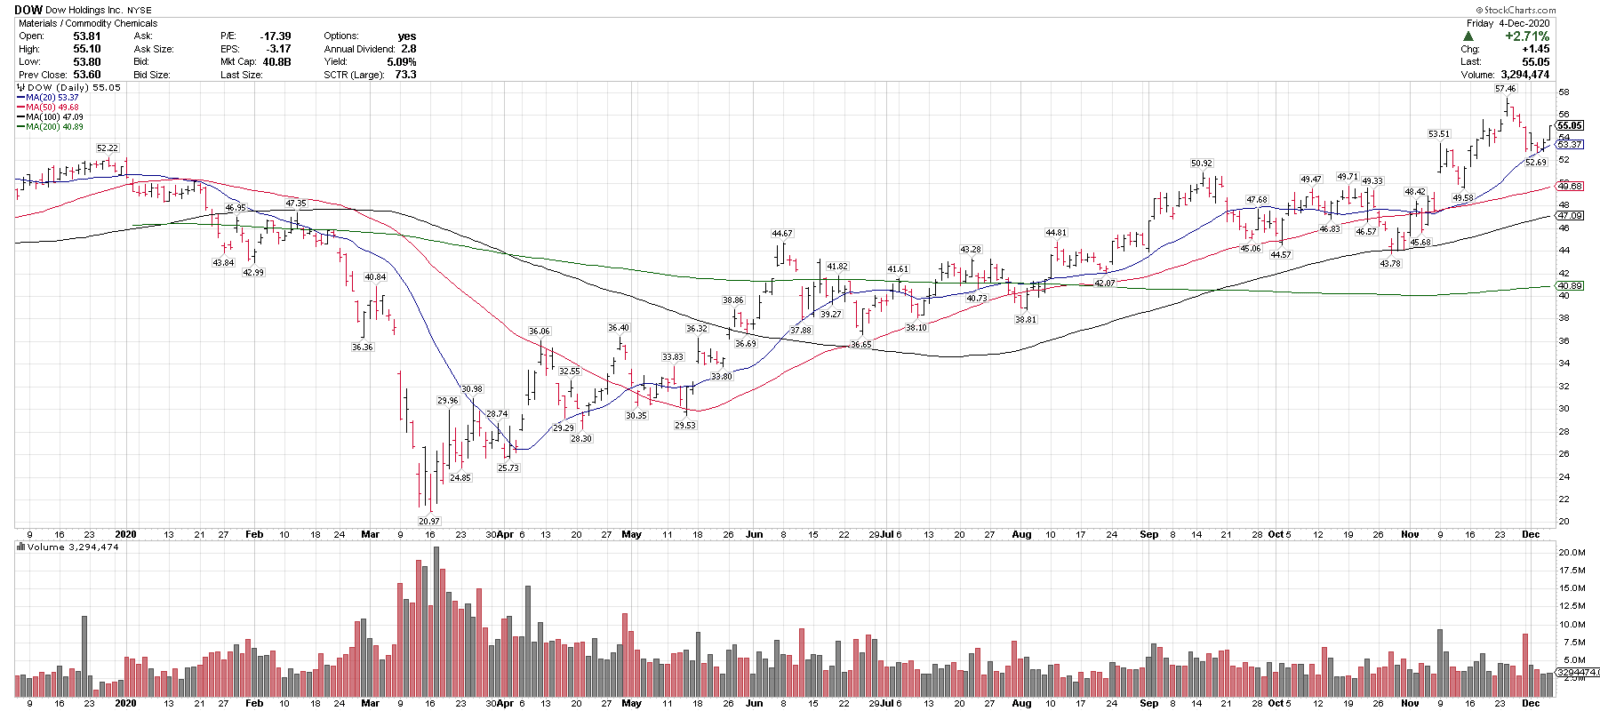
12/07/20
Close: 55.05
Pre-mkt: 54.70
Stop level: 46.49
DOW is in a technical uptrend above all key rising MAs & recently pulled back 8.3% off new highs. $49 & $52 are key support levels on any pullback. On this week’s Top 25 list.
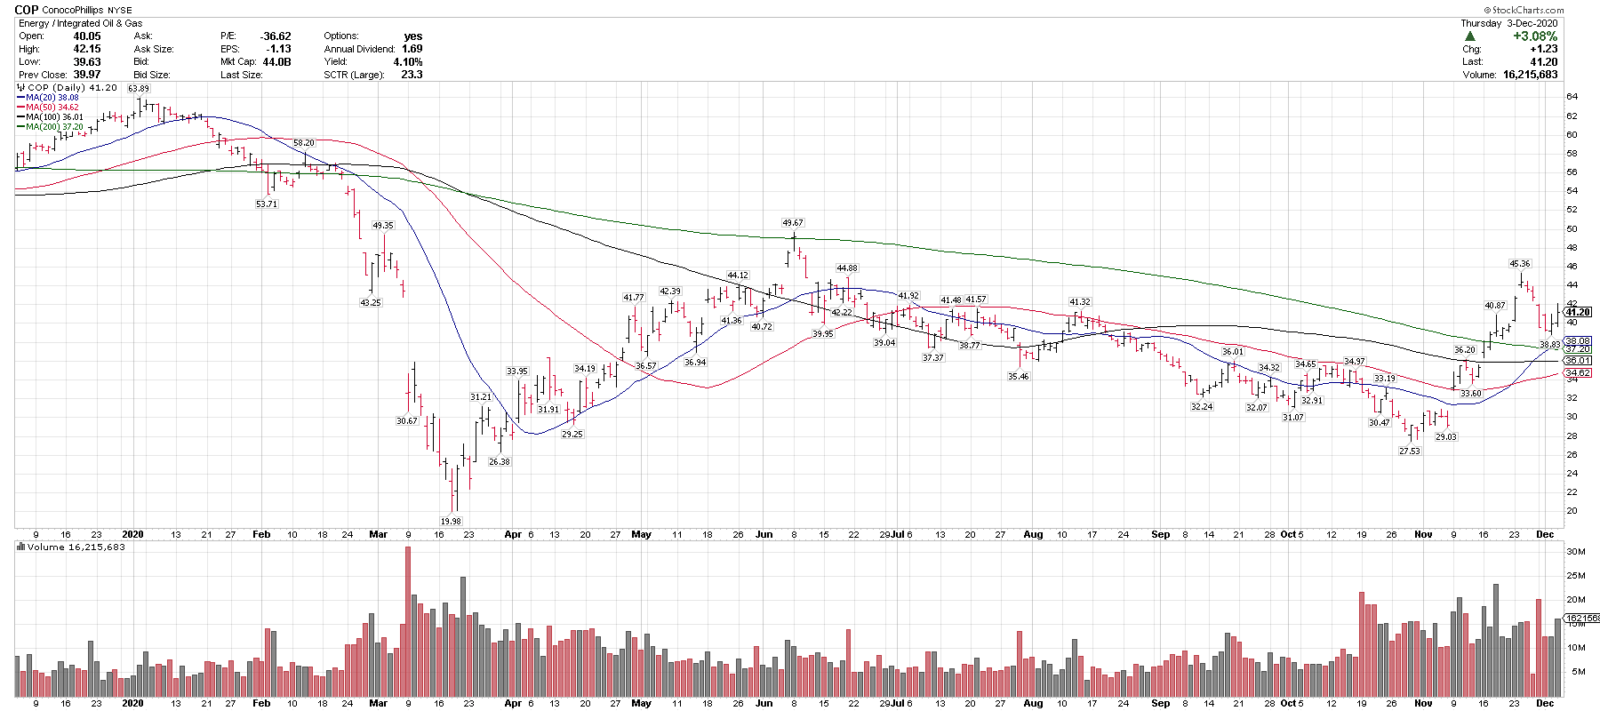
12/04/20
Conoco Phillips, COP
Close: 41.20
Pre: 42.25
Stop: 34.92
COP is in a near term uptrend above all key MAs, recently reclaimed the 200-sma and is above rising 20 & 50-sma. It recently corrected 14.3% off of 5 month highs. COP is on this week’s Top 25 list.
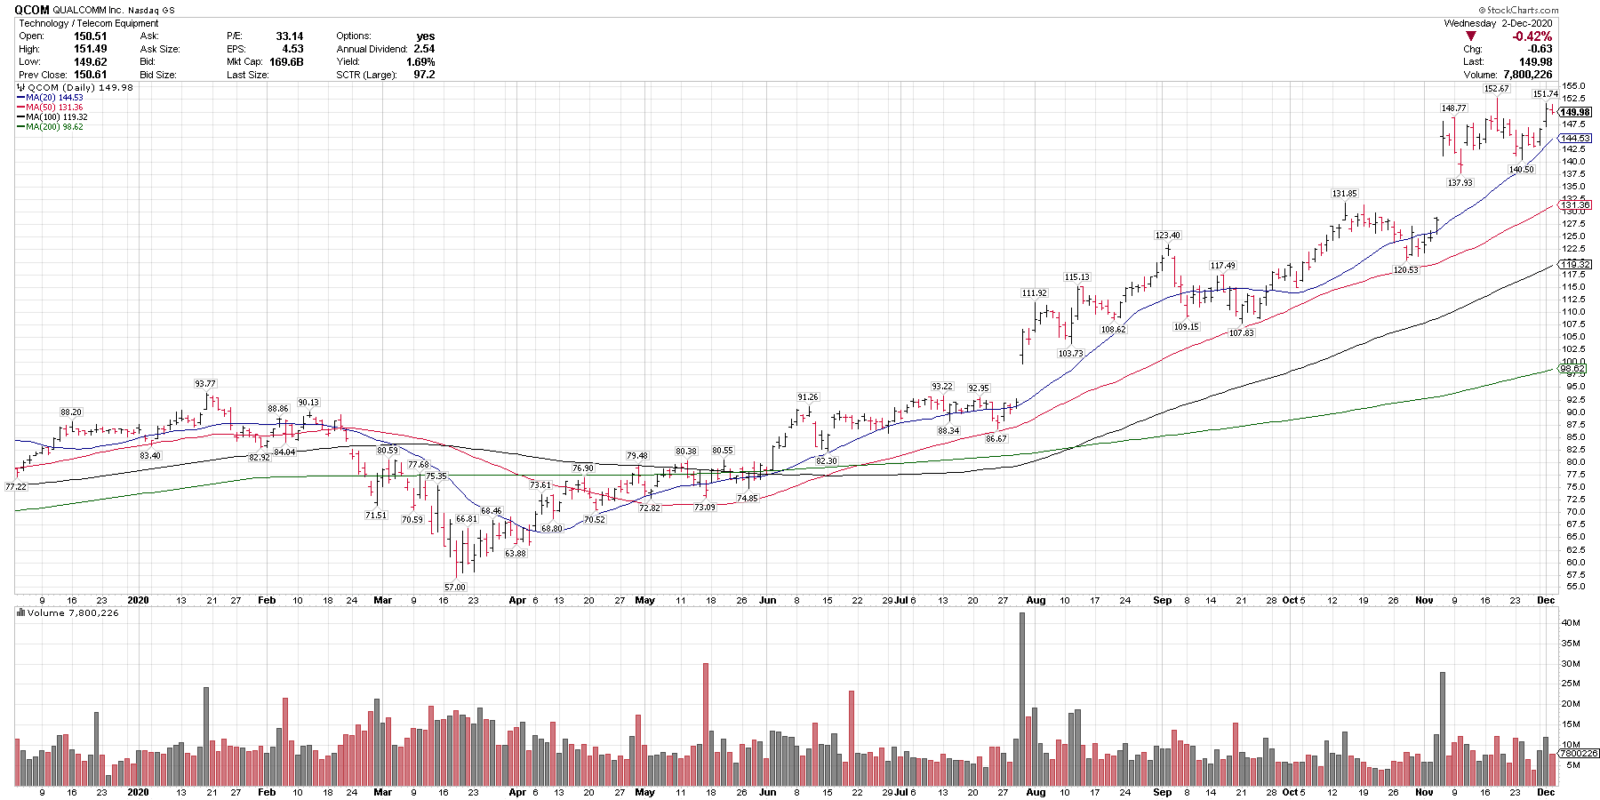
12/03/20
Qualcomm, QCOM
Close: 149.98
Pre: 150.86
Stop level: 127.48
QCOM is in a technical uptrend above all key rising MAs and recently corrected 7.9% off all-time highs. 137.50 and 130 are near term support levels. A close over 155 could signal a breakout higher.
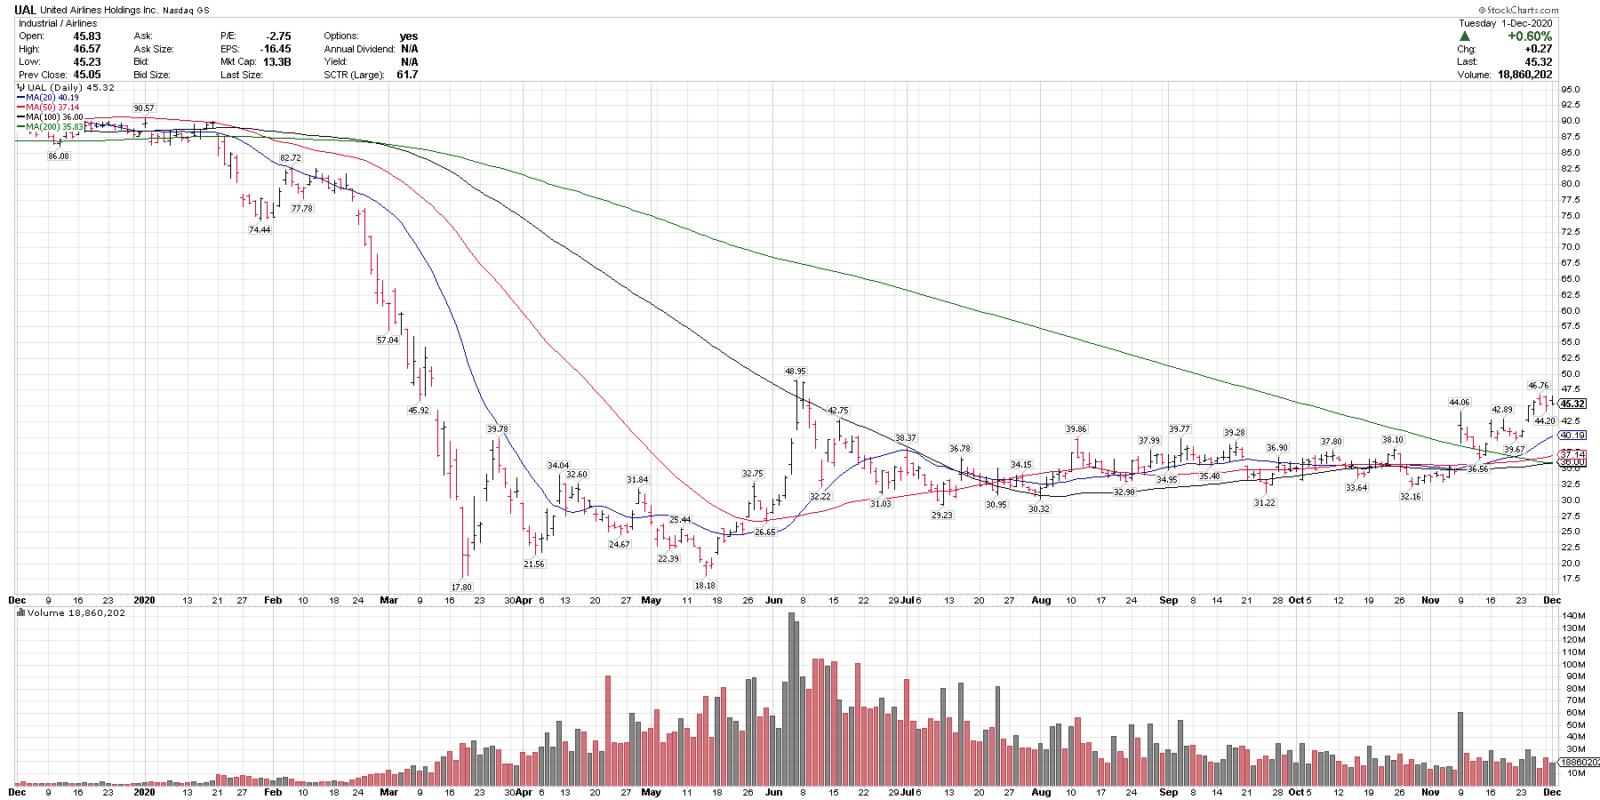
12/02/20
United Airlines, UAL
Close/Pre: 45.32
Stop level: 37.61 (wider due to volatility)
UAL is in an uptrend of higher highs/higher lows & is trading near 6-month highs. It recently reclaimed the 200-sma , is above the rising 20, 50 & 100-sma and recently had a bullish 50/200sma cross. This is a higher volatility chart, and could be volatile based on reopening news.
12/01/20
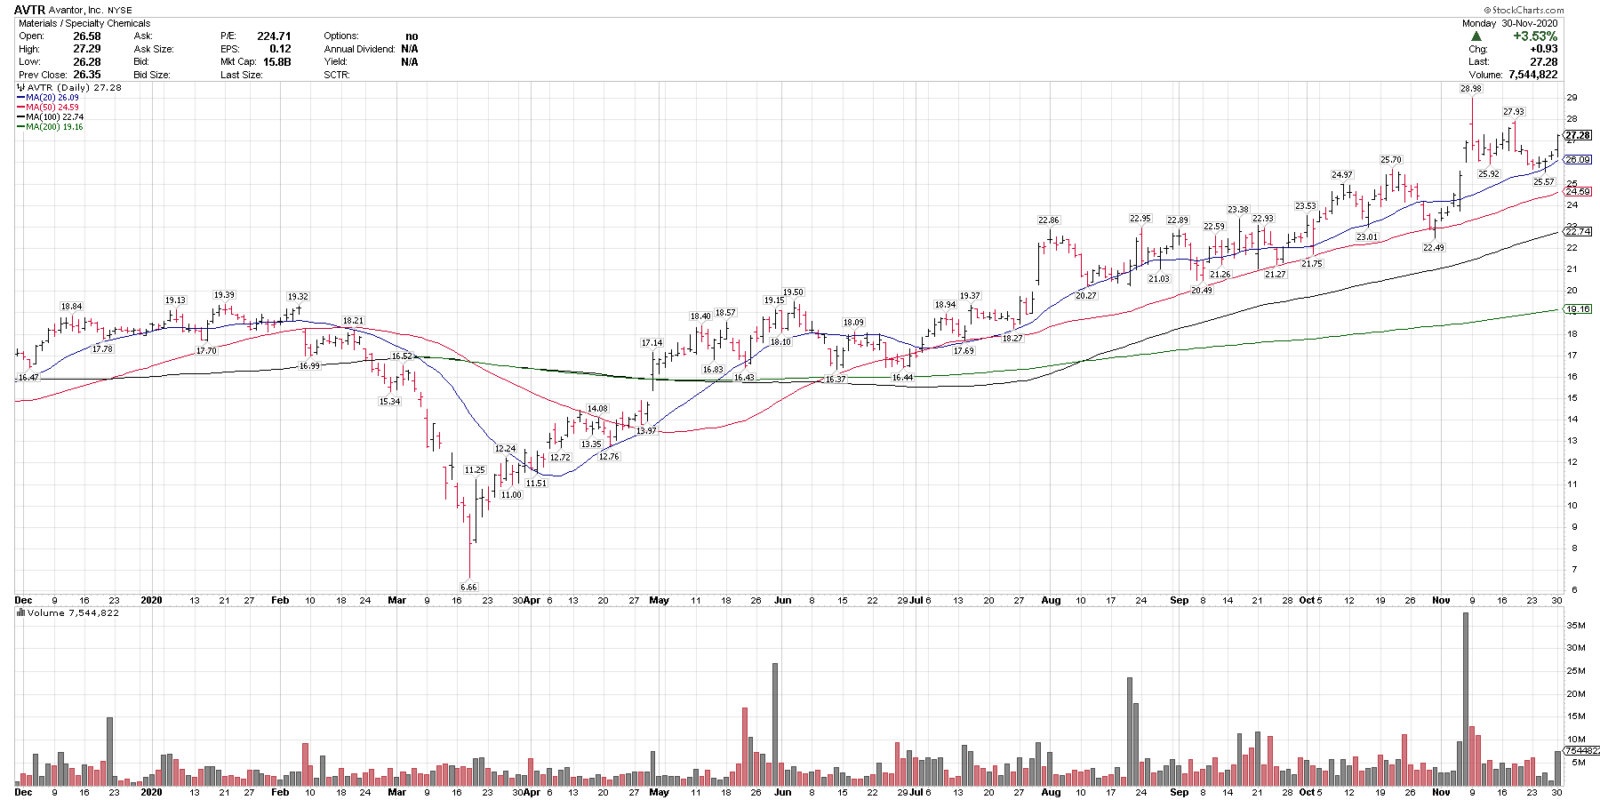
Avantor, AVTR
Close: 27.28
Pre-mkt: 27.70
Stop level: 22.91
AVTR is in a technical uptrend above all key rising MAs and recently corrected 11.7% off all-time highs. Also, no closes below the 50-sma since July. On this week’s Top 25 list.
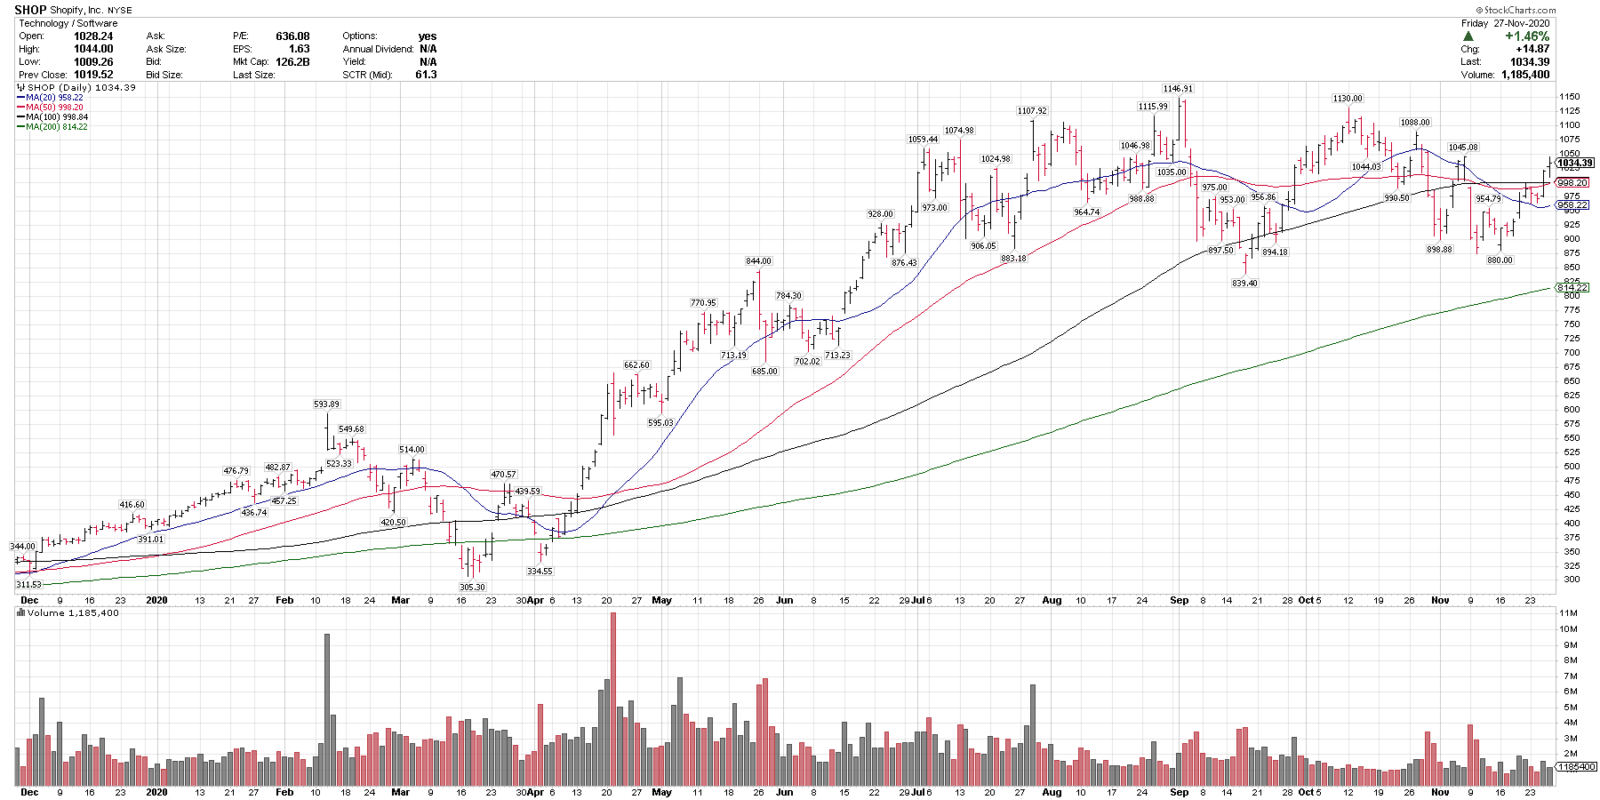
11/30/20
Shopify, SHOP
Close/when added to Top 25 list: 1034.39
Pre-mkt: 1045.68 (+1.09%)
Stop level: 868.88
SHOP has been consolidating over the last 5 months & currently over all key MAs. 880 is key support & > 1150 could signal a breakout higher. SHOP is also on this week’s Top 25 List.
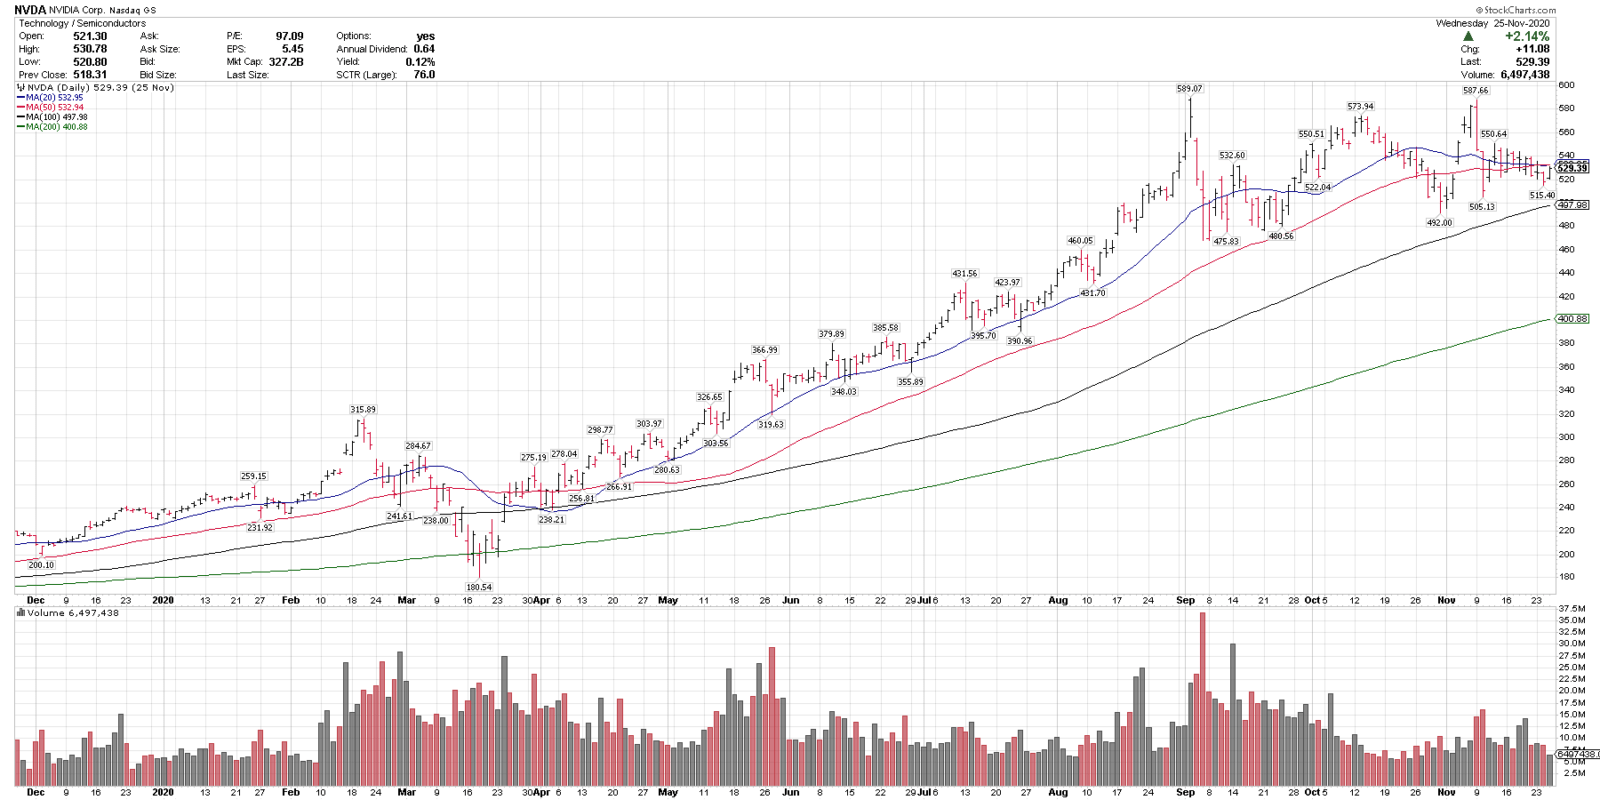
11/27/20
Nvidia, NVDA
Close: 529.39
Pre-mkt: 531.81 (+.47%)
Stop level: 449.68
NVDA is consolidating in a longer term uptrend, and recently consolidated 14.0% off weekly closing highs. 475-500 is near-term support and over 580-600 could signal a new breakout.
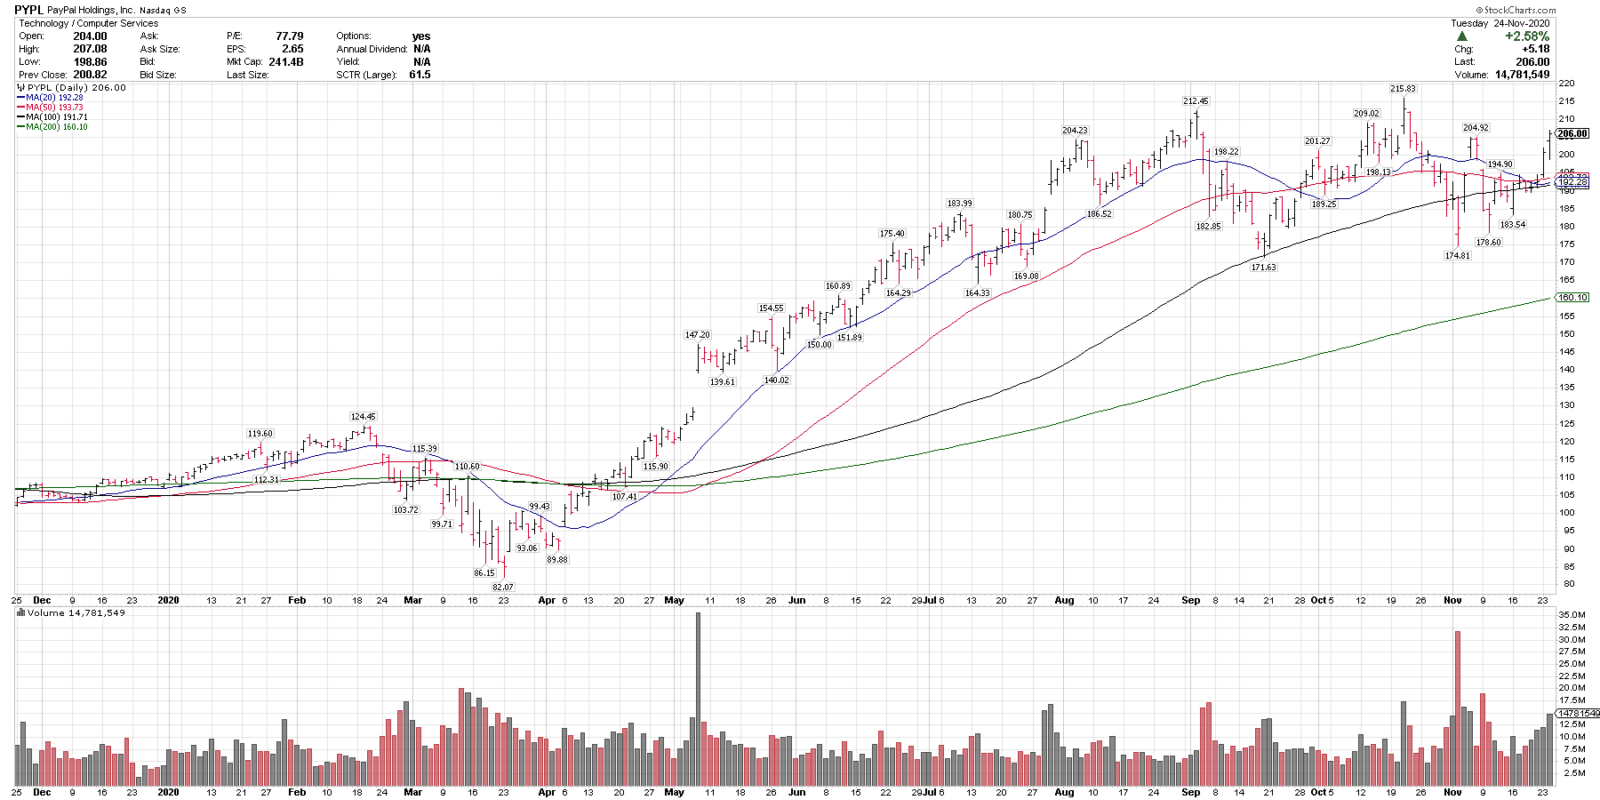
11/25/20
Paypal, PYPL
Close/Pre-mkt: 206.00
Stop level: 169.48
PYPL is trading above all key rising MAs and consolidating in a 4 month range. The 20 & 50-sma recently turned up as did daily RSI. 175-185 is key downside support and over 215 could signal a breakout higher.
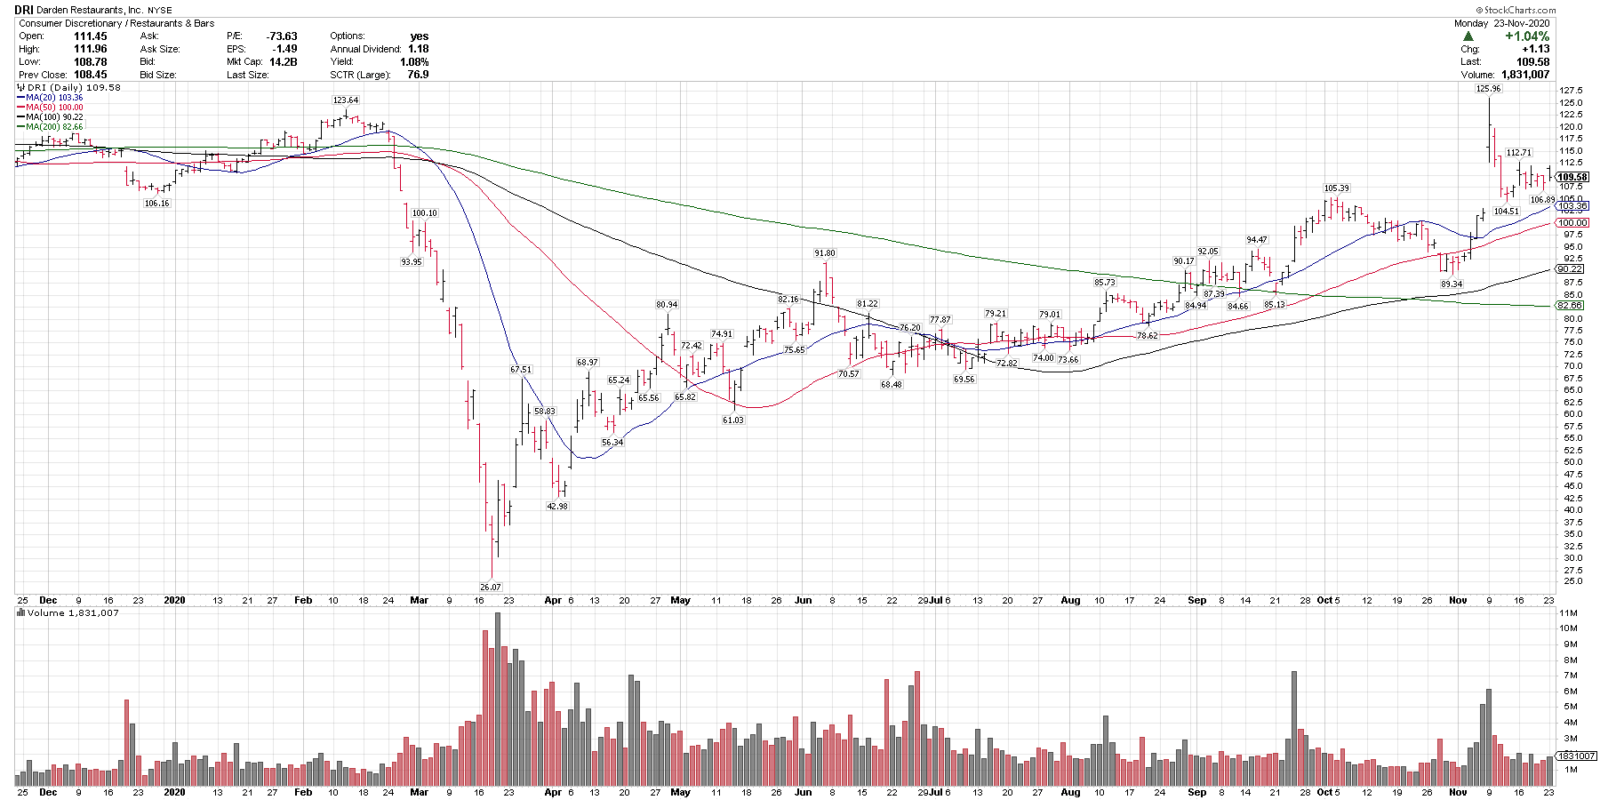
11/24/20
Darden Restaurants, DRI
Close: 109.58
Pre-mkt: 112.04
Stop level: 92.97
DRI is in a technical uptrend above all key rising MAs and recently corrected 17% off all time highs. 100-105 is near-term support. Also, on Sunday’s Top 25 List.
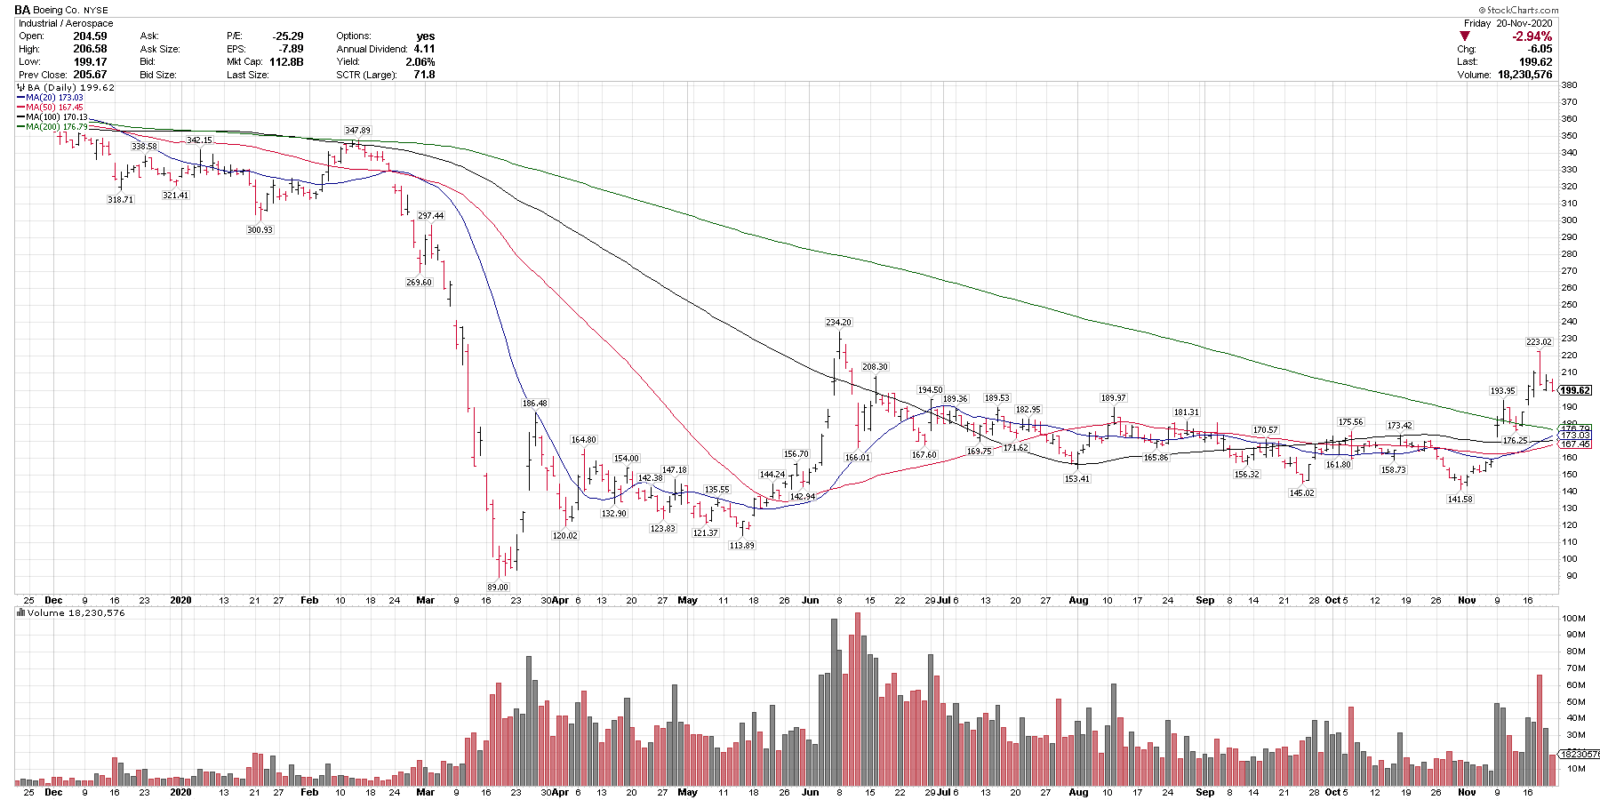
11/23/20
Boeing, BA
Close (when posted to Sunday’s Top 25): 199.62
Pre-mkt: 202.48
Stop level: 168.67
BA is attempting a longer term trend reversal, recently closing over the 200-sma & it’s highest weekly close since June. BA is a higher volatility “Recovery List” chart.
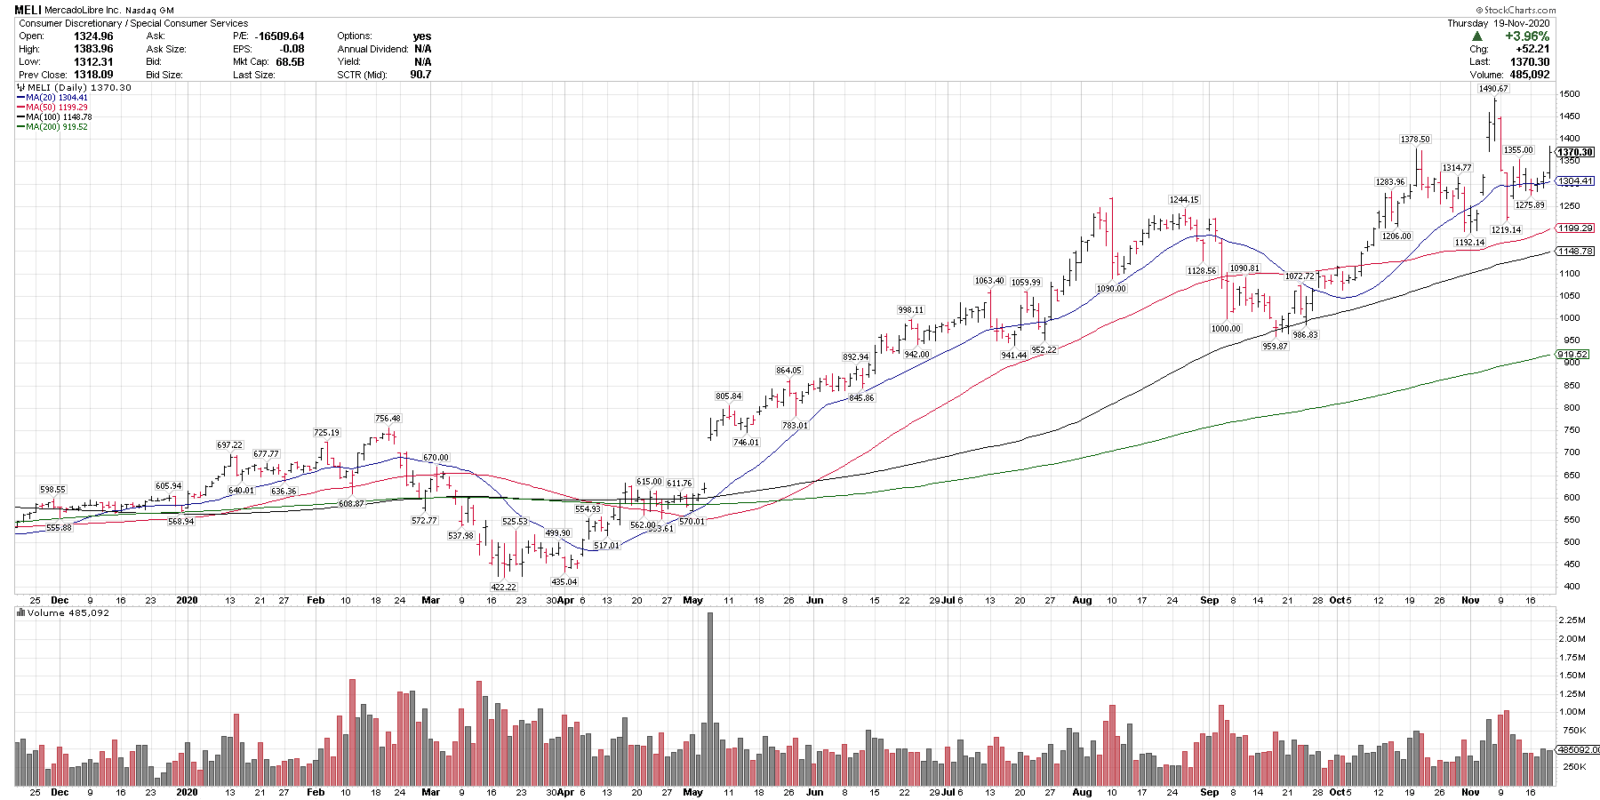
11/20/20
Mercado Libre, MELI
Close: 1370.30
Pre-mkt: 1378.80 (+.062%)
Stop level: $1164.75
MELI is in a technical uptrend above all key MAs, recently corrected 18.2% off new highs and closed over the $1350 breakout level yesterday. Also on last Sunday’s Top 25 List.
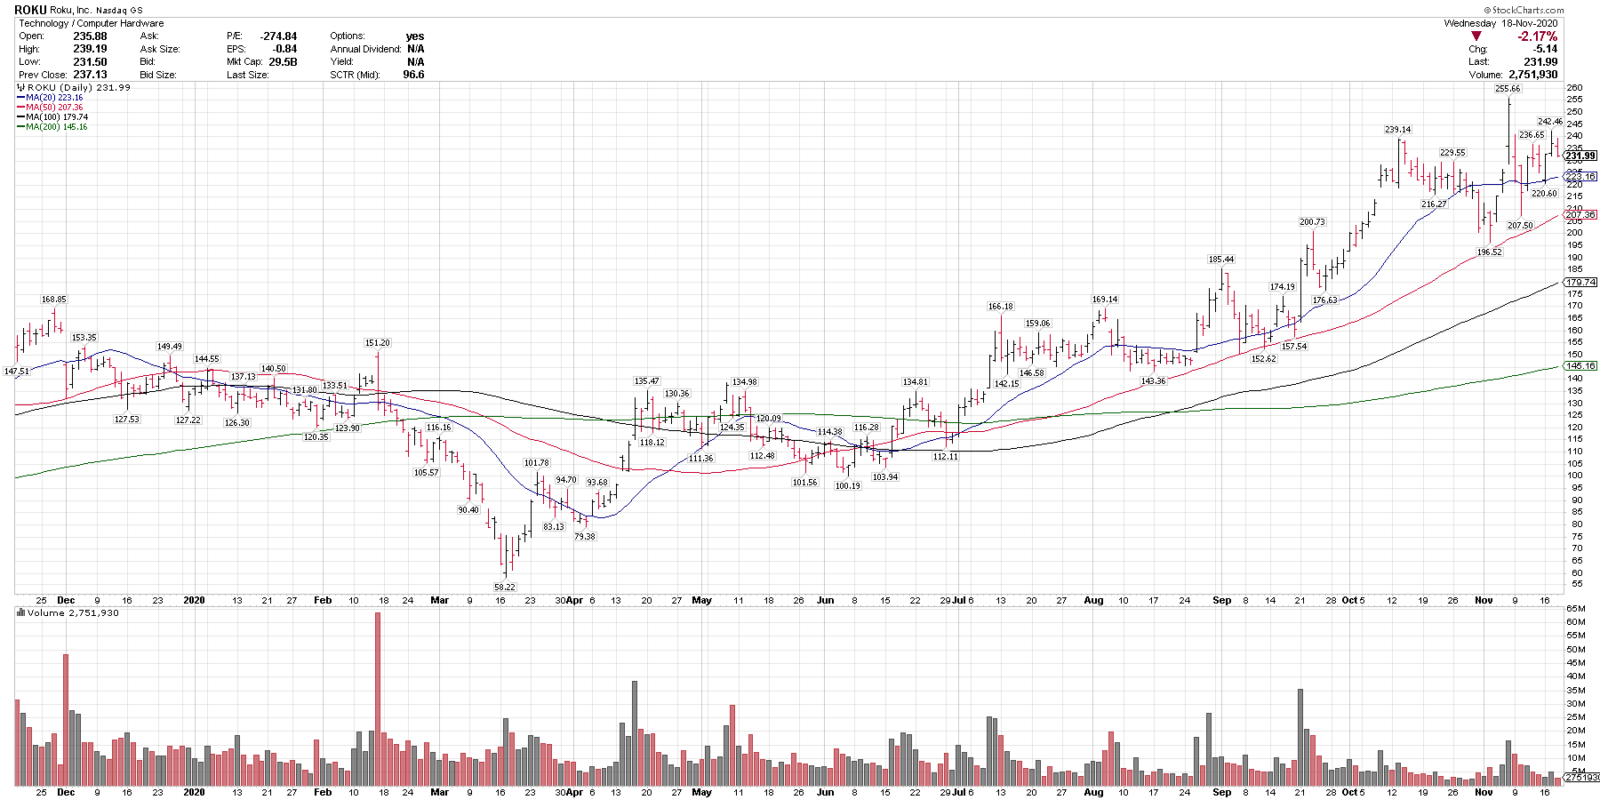
11/19/20
Roku, ROKU
Close: 231.99
Pre-mkt: 234.80
Stop level: 169.48
ROKU is in a technical uptrend above all key rising MAs and recently corrected 18.8% off all-time highs. ROKU has had no closes below the 50-sma since late June. This is a higher volatility stock.
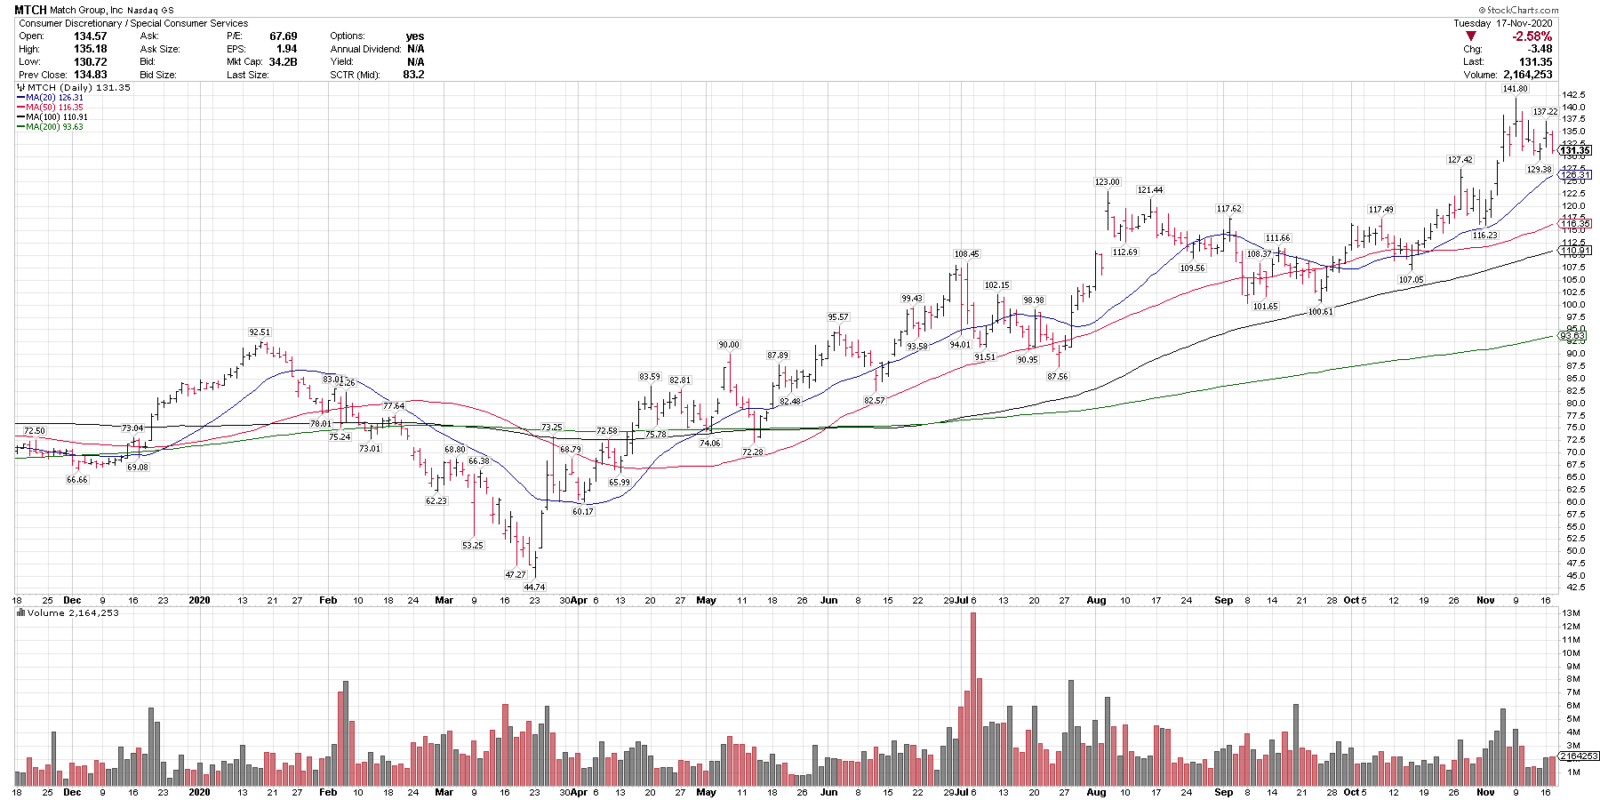
11/18/20
Match Group, MTCH
Close/Pre-market: 131.35
Stop level: 110.65
MTCH is in a technical uptrend above all key rising MAs and is consolidating over support after breaking out to a new all-time high. $115-$125 is a support level.
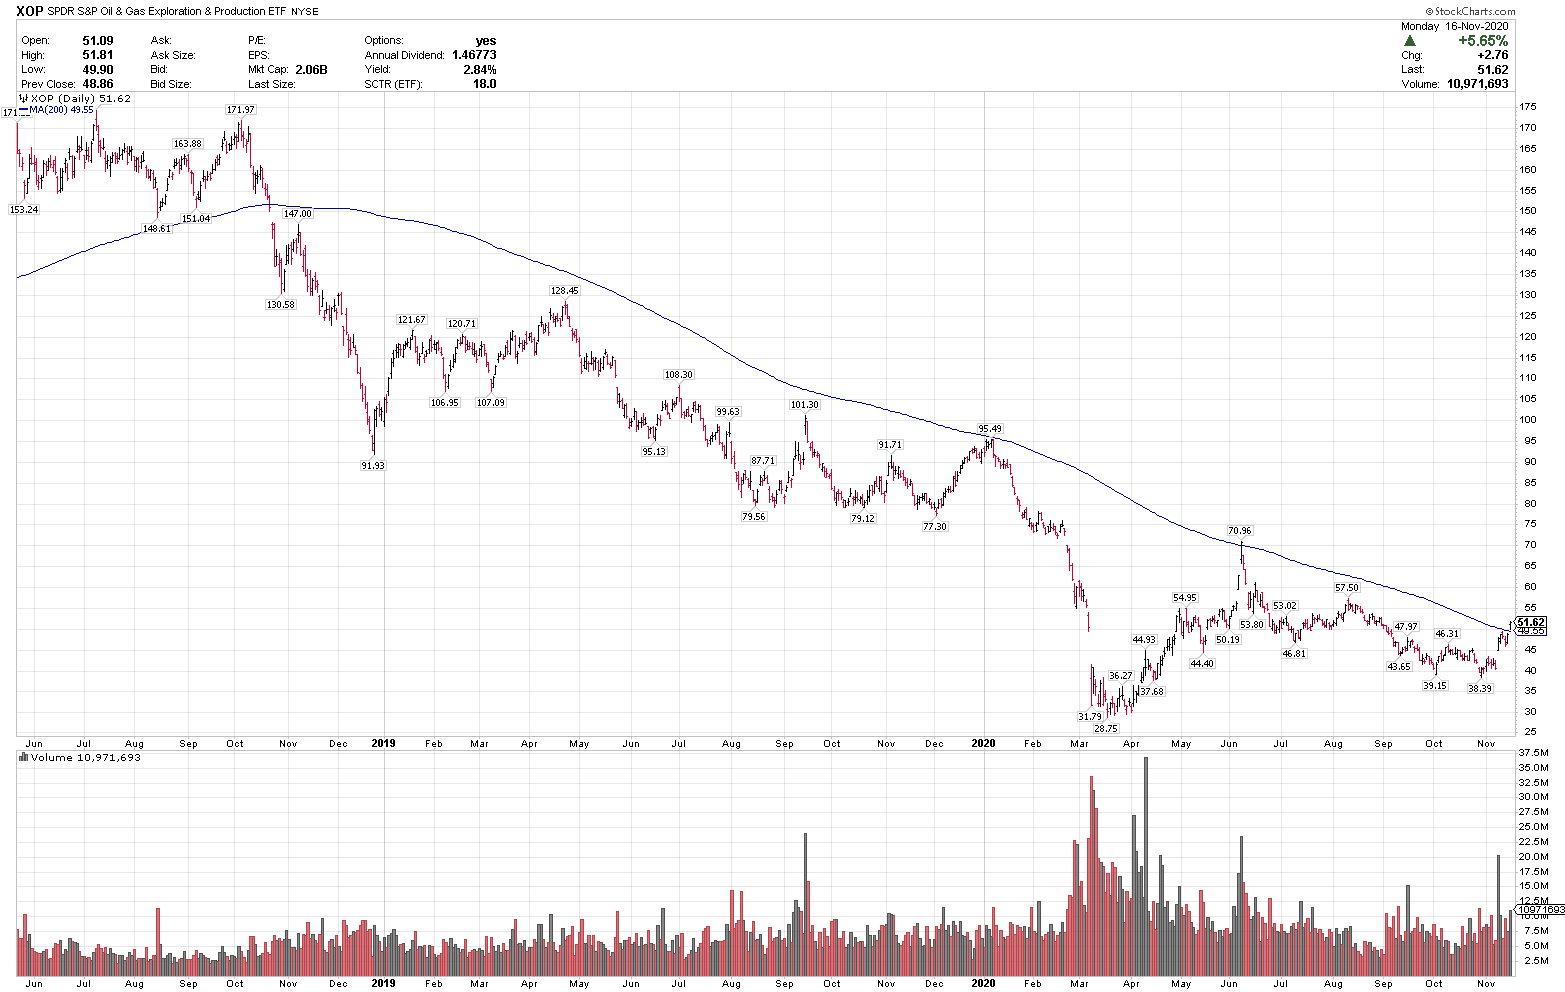
11/17/20
Energy Sector
S&P Oil & Gas Exploration ETF, XOP
Close: 51.62
Pre-market: 50.86
Stop level: 16%
The Energy sector and XOP is a technical recovery idea which closed over the 200-sma yesterday for the first time since Oct. 2018. $45 is support on any pullback. This is a higher volatility chart & sector.
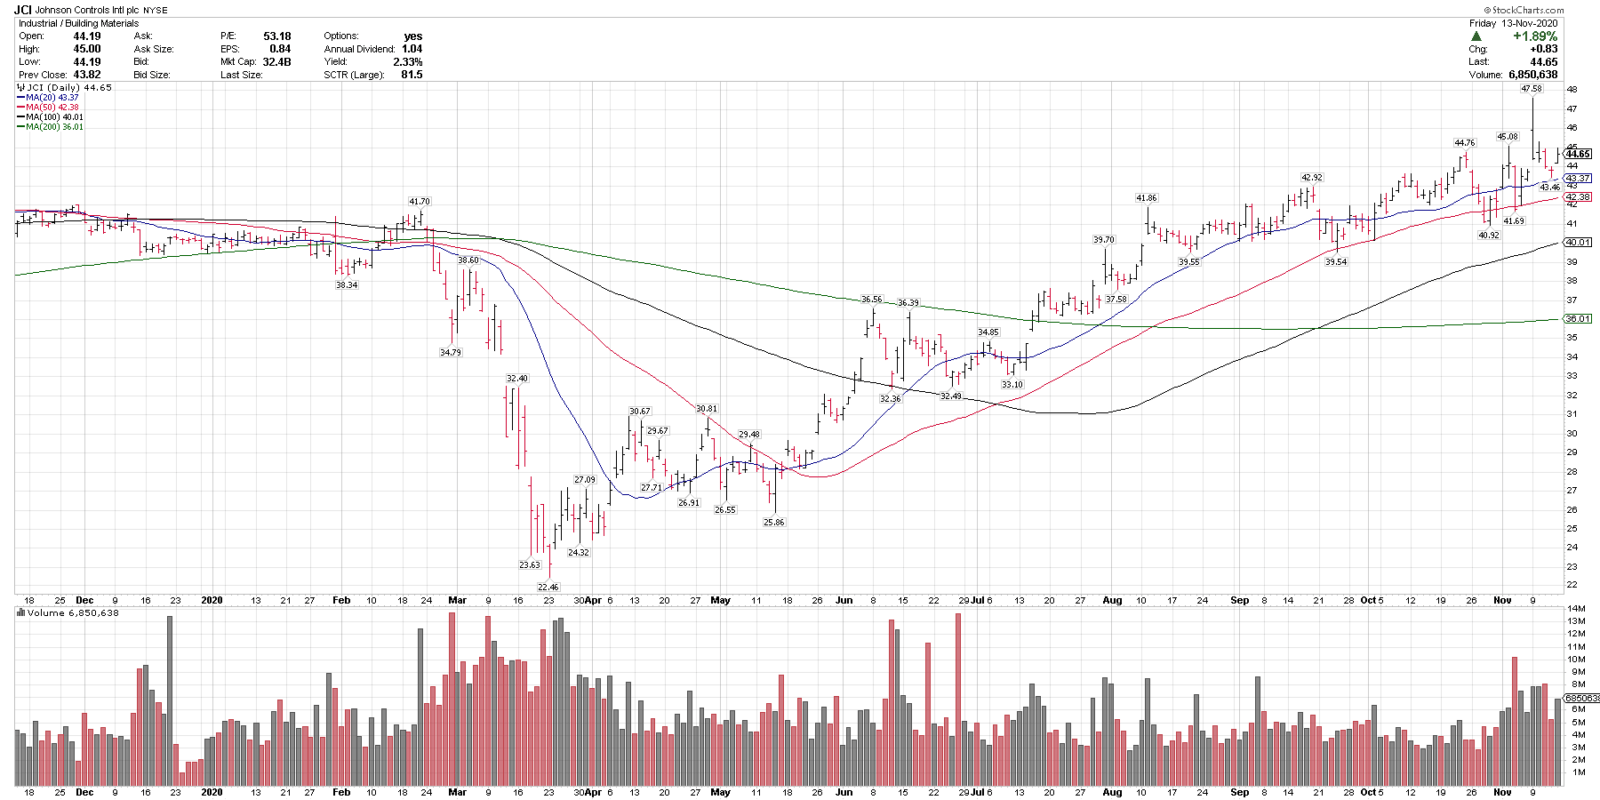
11/16/20
Johnson Controls, JCI
Close/Pre-mkt: 44.65
Stop level: 37.94
JCI is in a technical uptrend above all key rising MAs, and recently broke out to new all-time highs. $40-$41 is key support on any pullbacks.
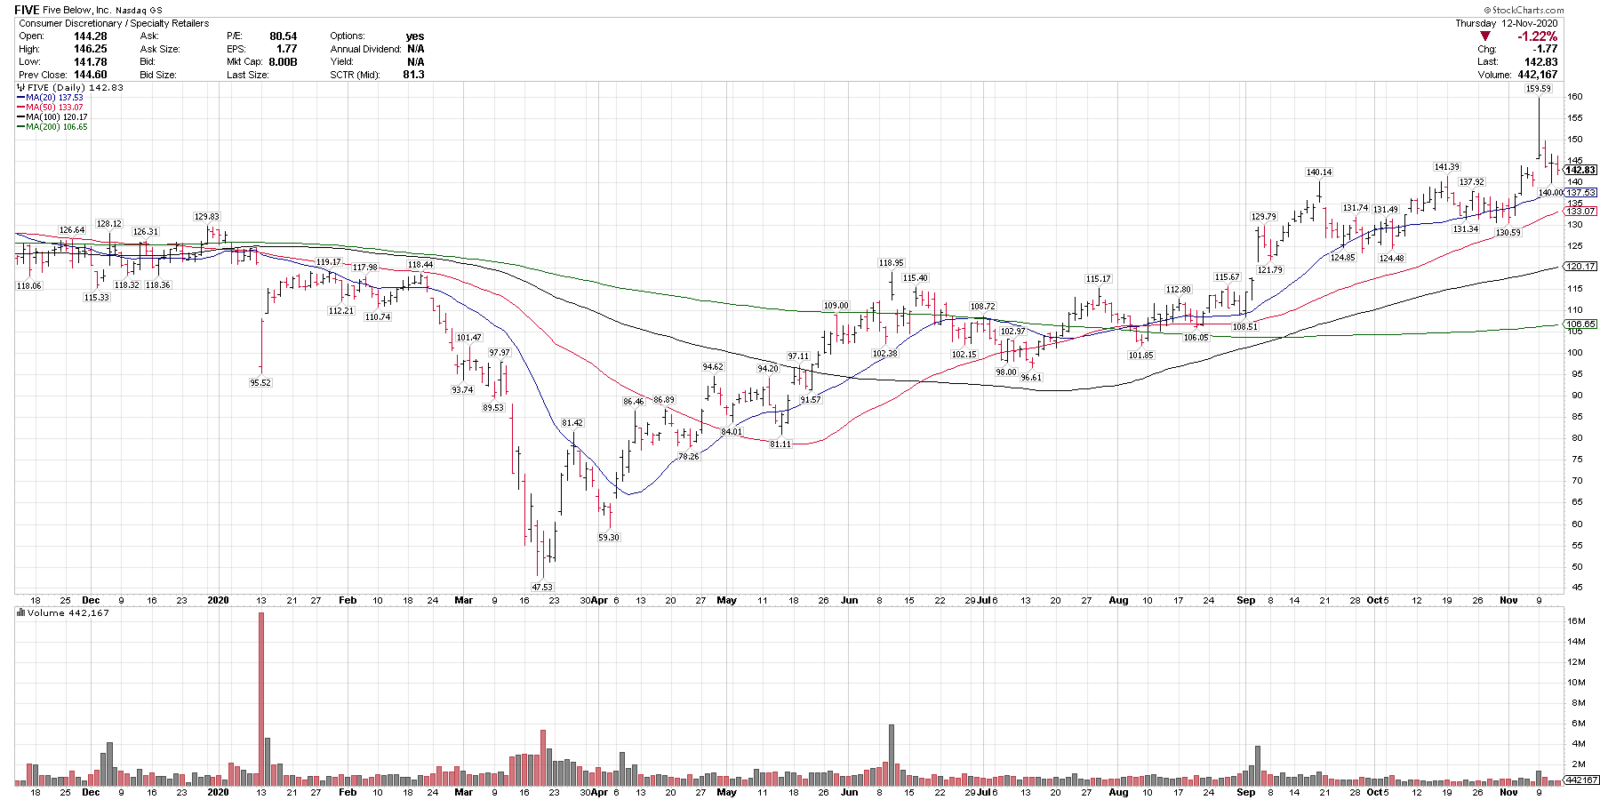
11/13/20
Five Below, FIVE
Close: 142.83
Stop level: 119.40
FIVE is in a technical uptrend above all key rising MAs, and broke out last week to new highs. It is consolidating above support here.
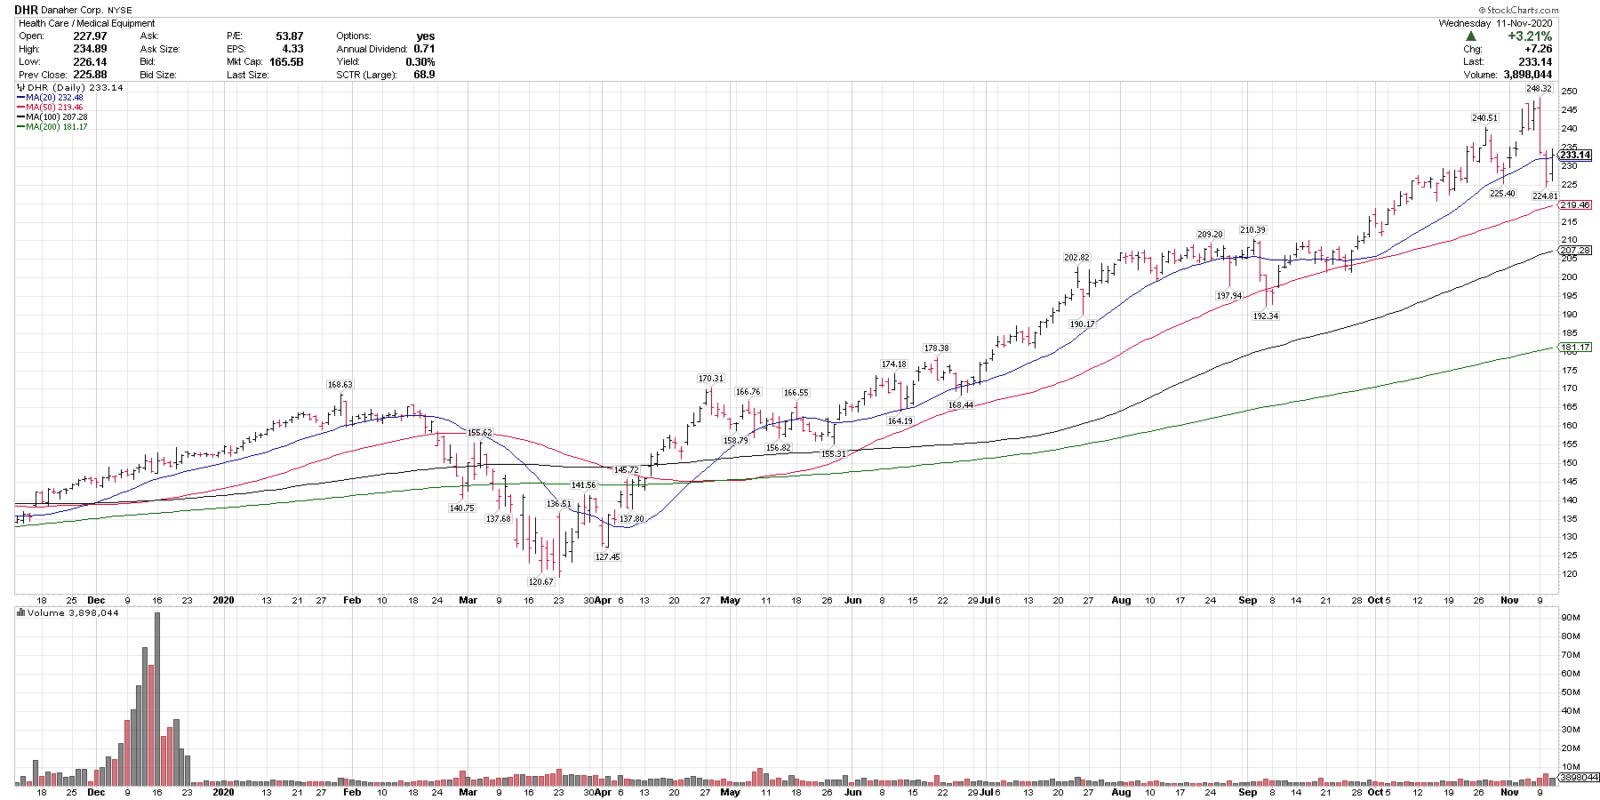
11/12/20
Danaher, DHR
Close: 233.14
Pre-mkt: 235.25
Stop level: 198.16
DHR is in a technical uptrend above all key rising MAS and recently corrected 8.3% off all-time highs. 225 and 210 are near term support levels.
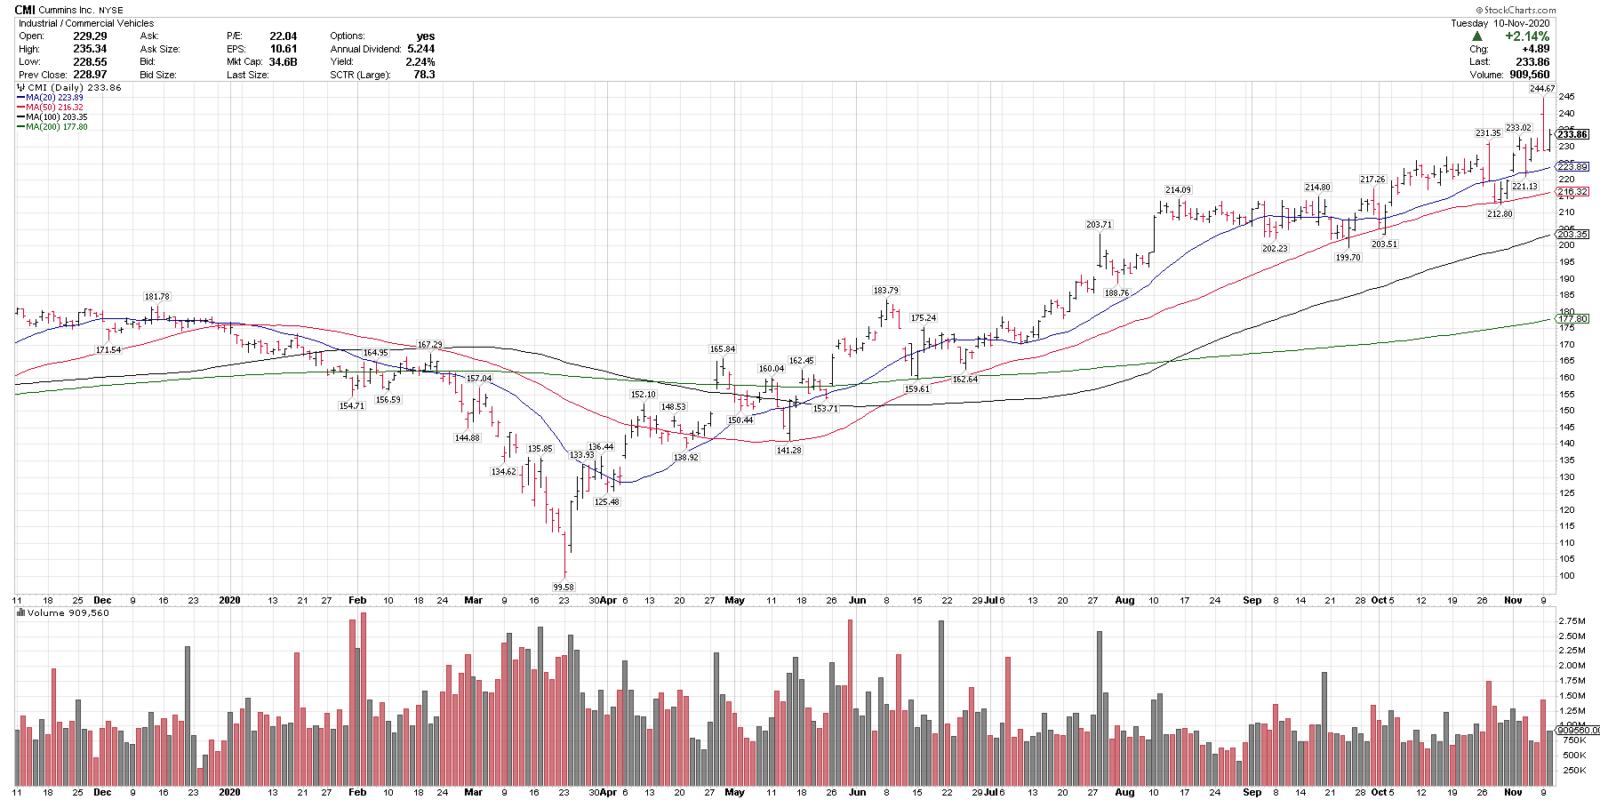
11/11/20
Cummins, CMI
Close/Pre-mkt: 233.86
Stop level: 198.78
CMI is in a technical uptrend above all key rising MA’s, with no closes below the 50-sma since April. $215 is a key support level.
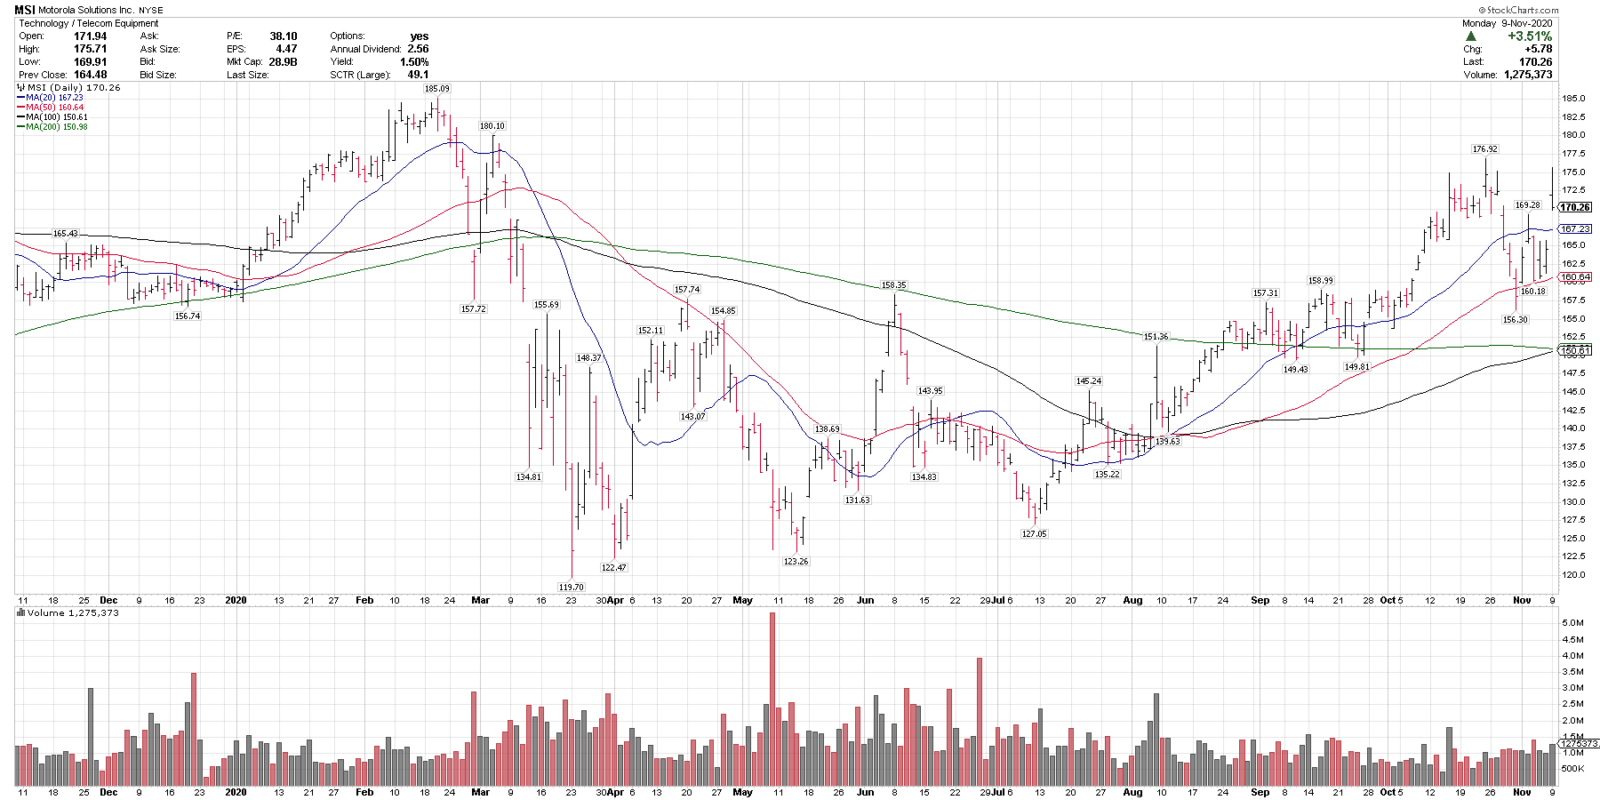
11/10/20
Motorola Solutions Inc., MSI
Close: 170.56
Pre-mkt: 169.87
Stop level: 144.72
MSI is in a technical uptrend trading above all key MAs and recently pulled back 11.6% off of 7-month highs into the rising 50-sma. $150-$160 is a key support range.
11/09/20
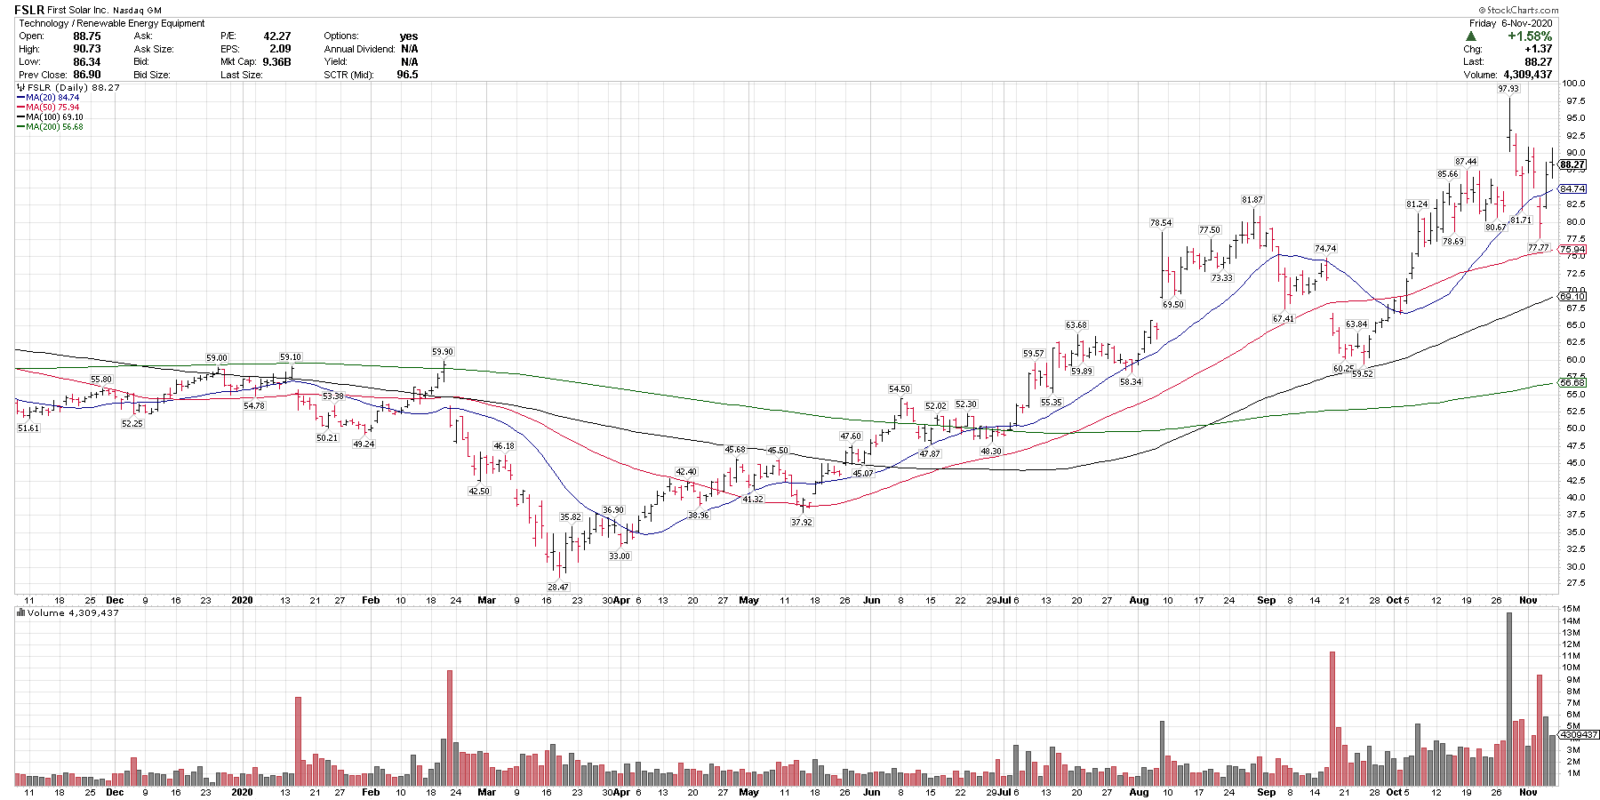
Chart of the Day
First Solar, FSLR
Close: 88.27
Pre-market: 95.30
No stop level posted due to this morning’s price gap.
I am keeping FSLR as the Chart of the Day, for tracking purposes, as posted last night, as I posted it onto the “Best Ideas List” on Friday morning at my buy point and it was on last week’s Top 25 Buy list as well. https://twitter.com/BlueChipPremium/status/1324766408501301248
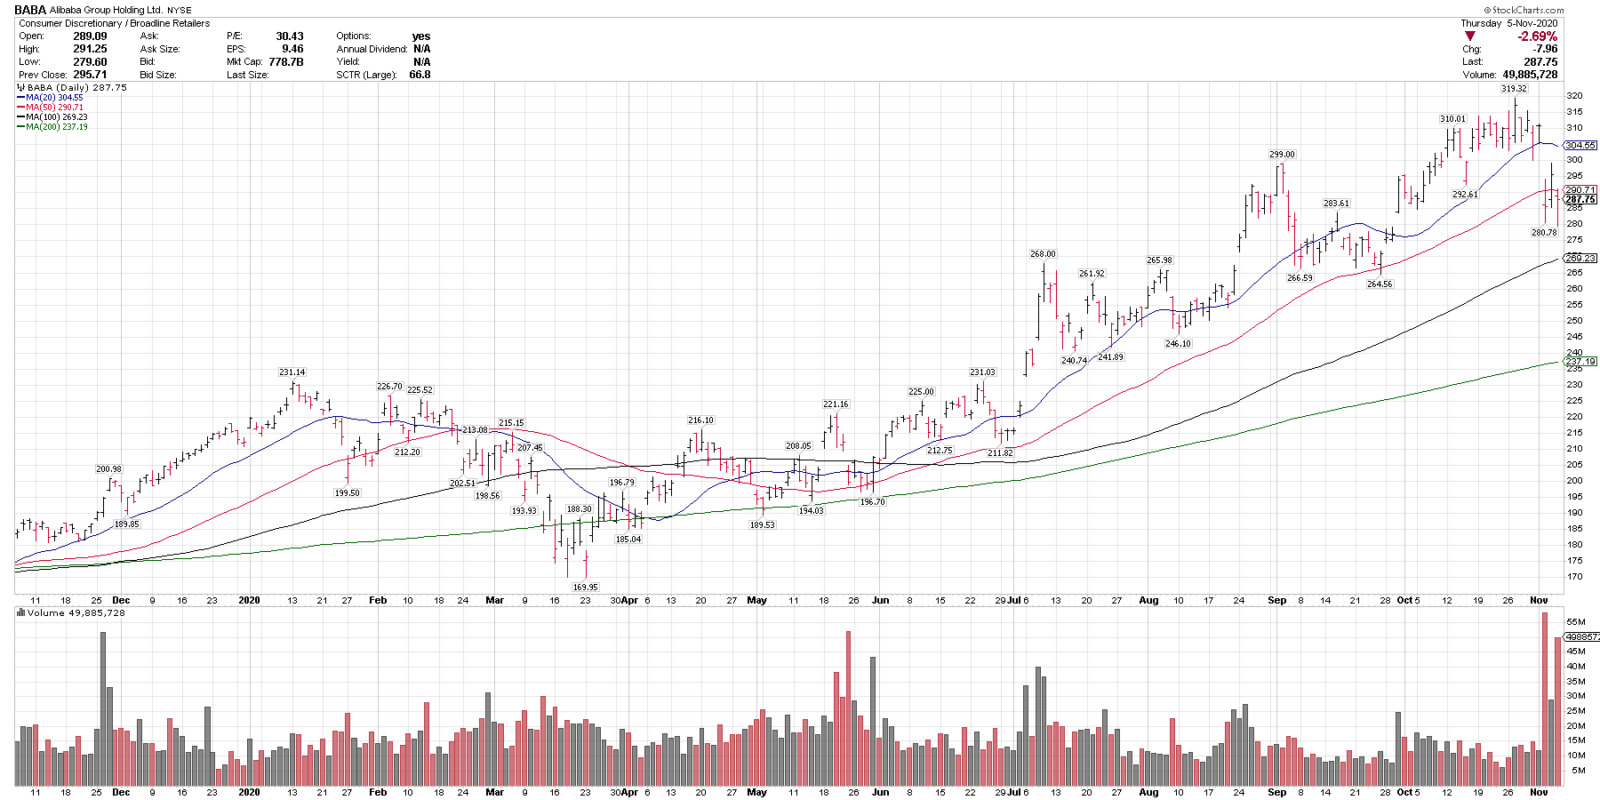
11/06/20
Alibaba, BABA
Close: 287.75
Pre-mkt: 290.27
Stop level: 244.58
BABA is in a technical uptrend and recently corrected 12.0% off all-time highs. BABA is a market cap & technical leader in the China internet space. Over $265 is key.
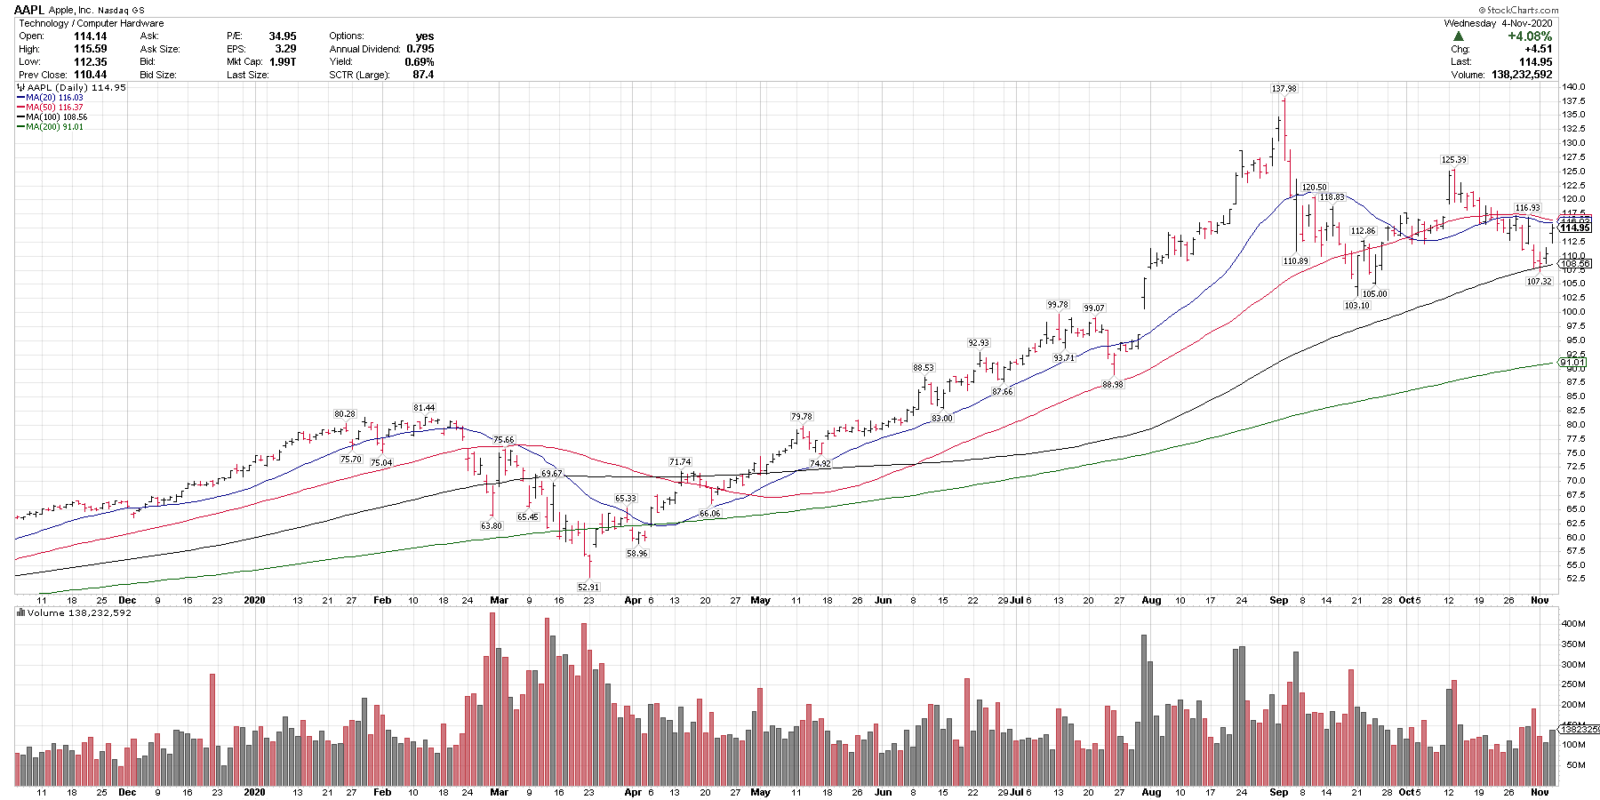
11/05/20
Apple, AAPL
Close: 114.95
Pre-mkt: 117.96
Stop level: 97.70
AAPL is consolidating in a longer-term uptrend & just pulled back 14.4% off recent highs into the rising 100-sma. Testing over the 20 & 50-sma pre-mkt. $100-$105 is key on any pullbacks.
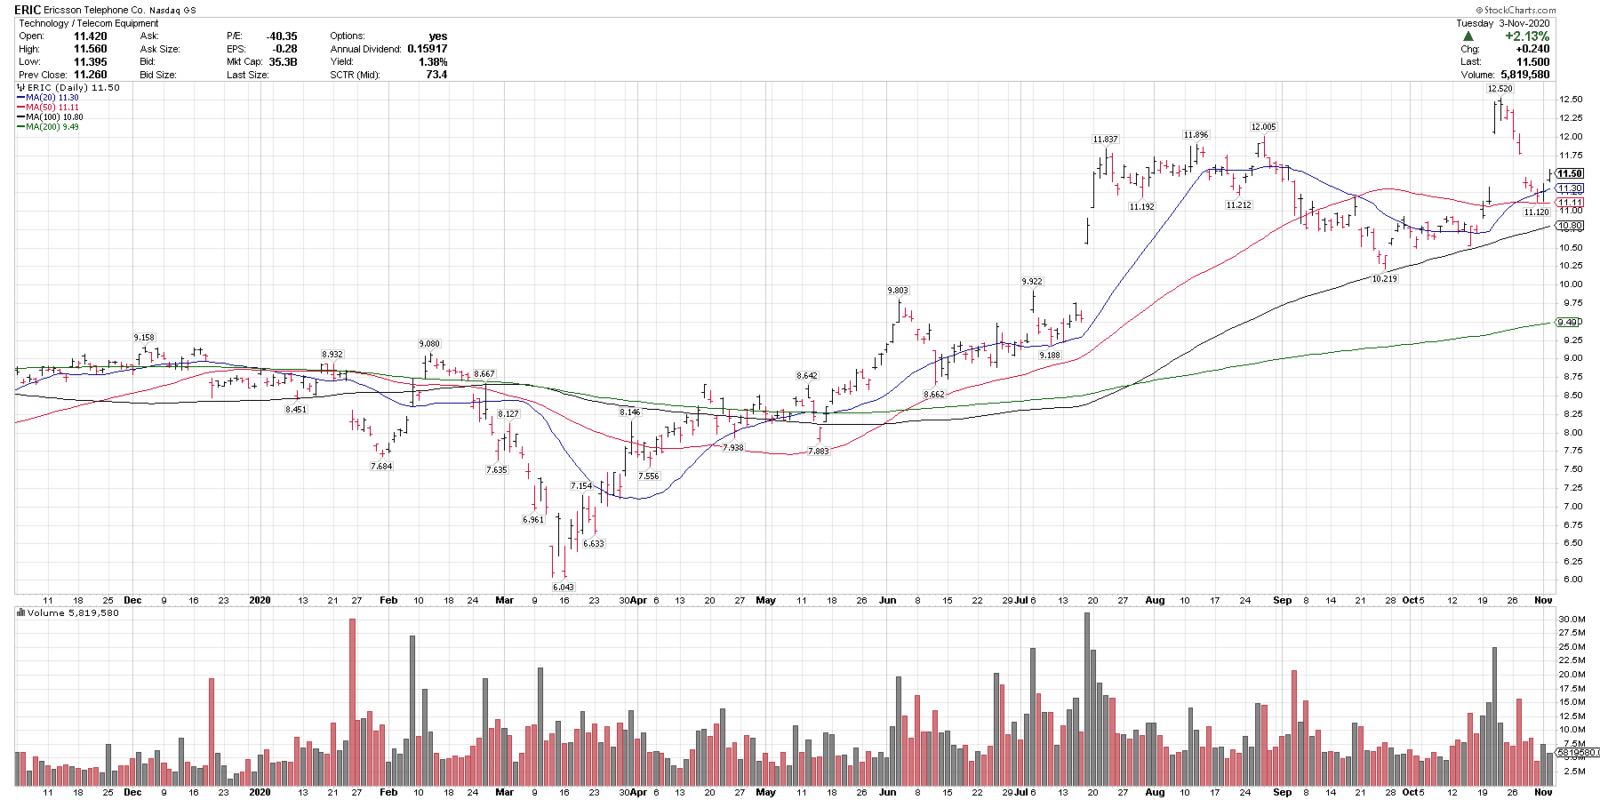
11/04/20
Ericsson, ERIC
Close: 11.50
Pre-market: 11.66
Stop level: 9.77
ERIC is in a technical uptrend above all key MAs and recently pulled back 11.1% off of 9-year highs. There is key support in the $10-$11 range.
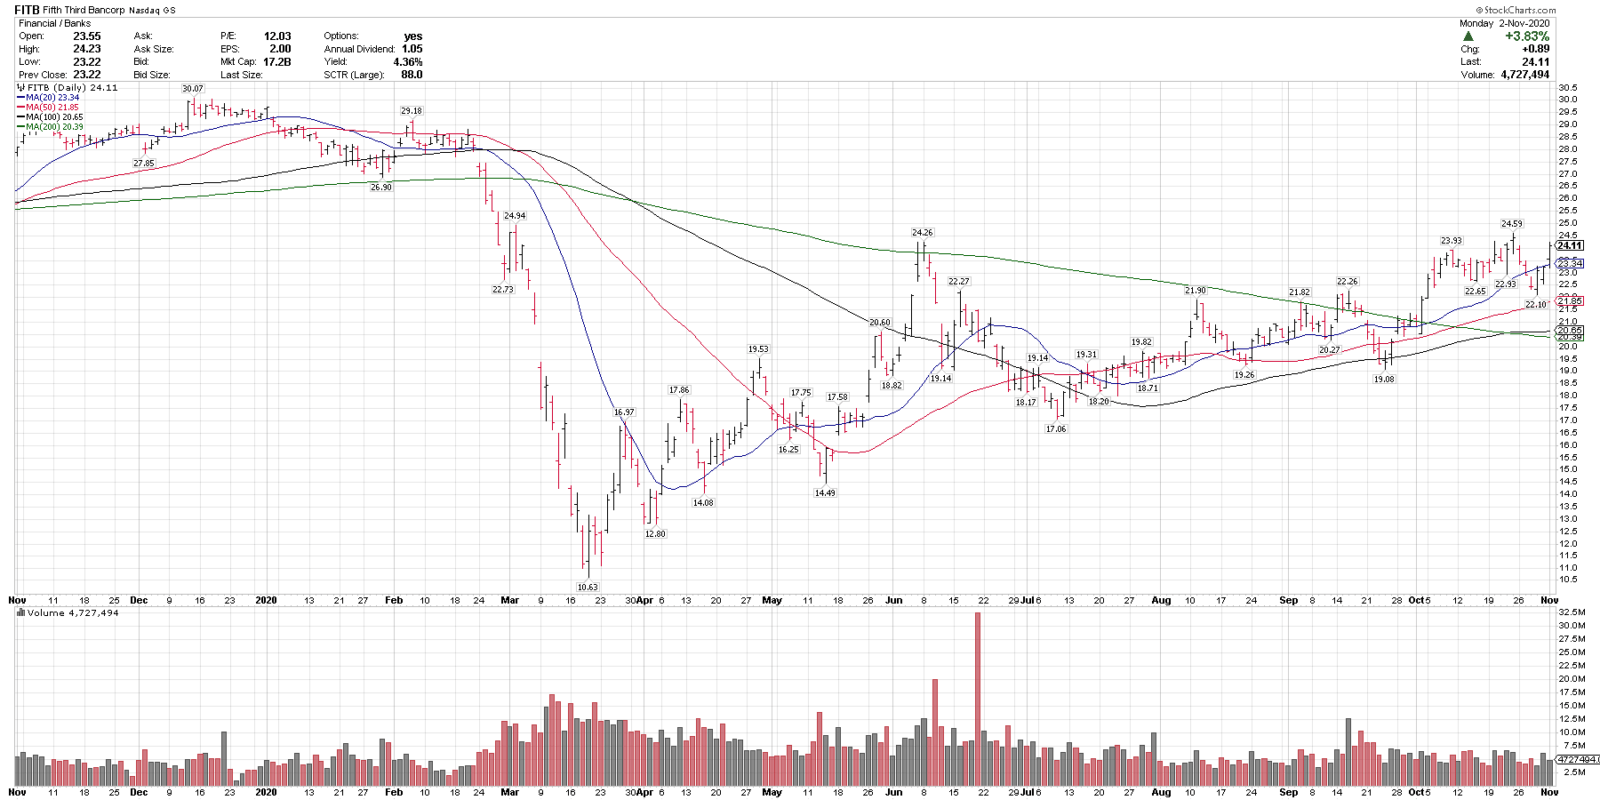
11/03/20
Fifth Third Bancorp, FITB
Close: 24.11
Pre-market: 24.50
Stop level: 20.49
FITB is in a technical uptrend above the rising 20, 50 & 100-sma & above the 200-sma. It recently broke out to 7-month highs & is a part of the improving regional banking group. KRE is an ETF alternative.
Blue Chip Daily Chart of the Week:
Arcelor Mittal, MT
Close: 13.60
Stop level for position traders and investors: $11.45
please see chart analysis below
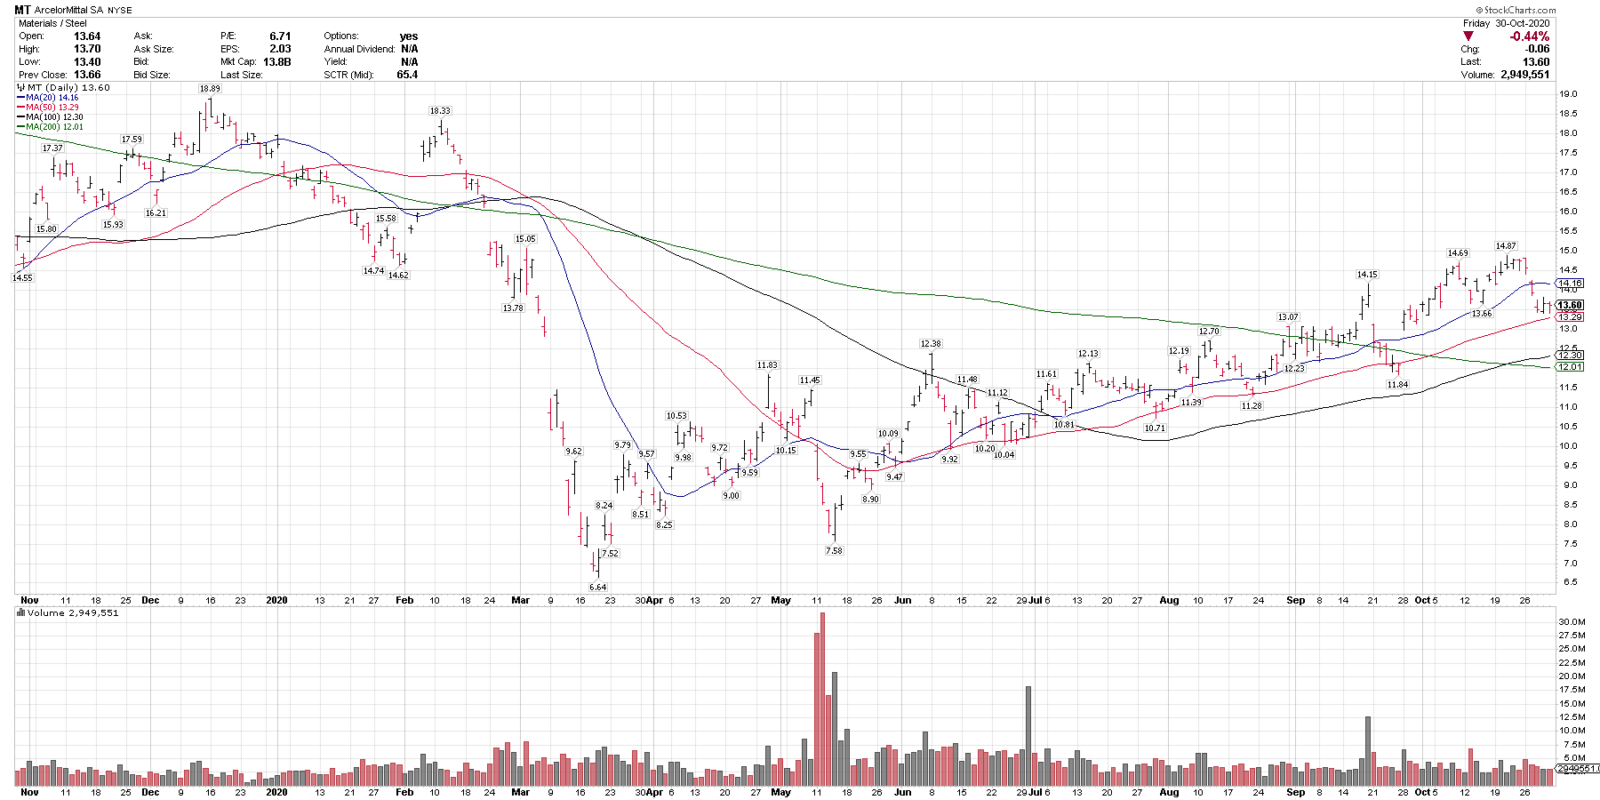
- ArcelorMittal, MT, is in a technical uptrend with a series of higher highs and higher lows, above the rising 50, and 100-day moving averages, and above the 200-sma as well, indicating an uptrend on multiple time frames.
- MT recently pulled back 9.8% off 6-month highs and is holding the rising 50-sma currently.
- On any pullbacks, $12.50 – 13.00 is a key support range, as well as the 200-sma near $12.
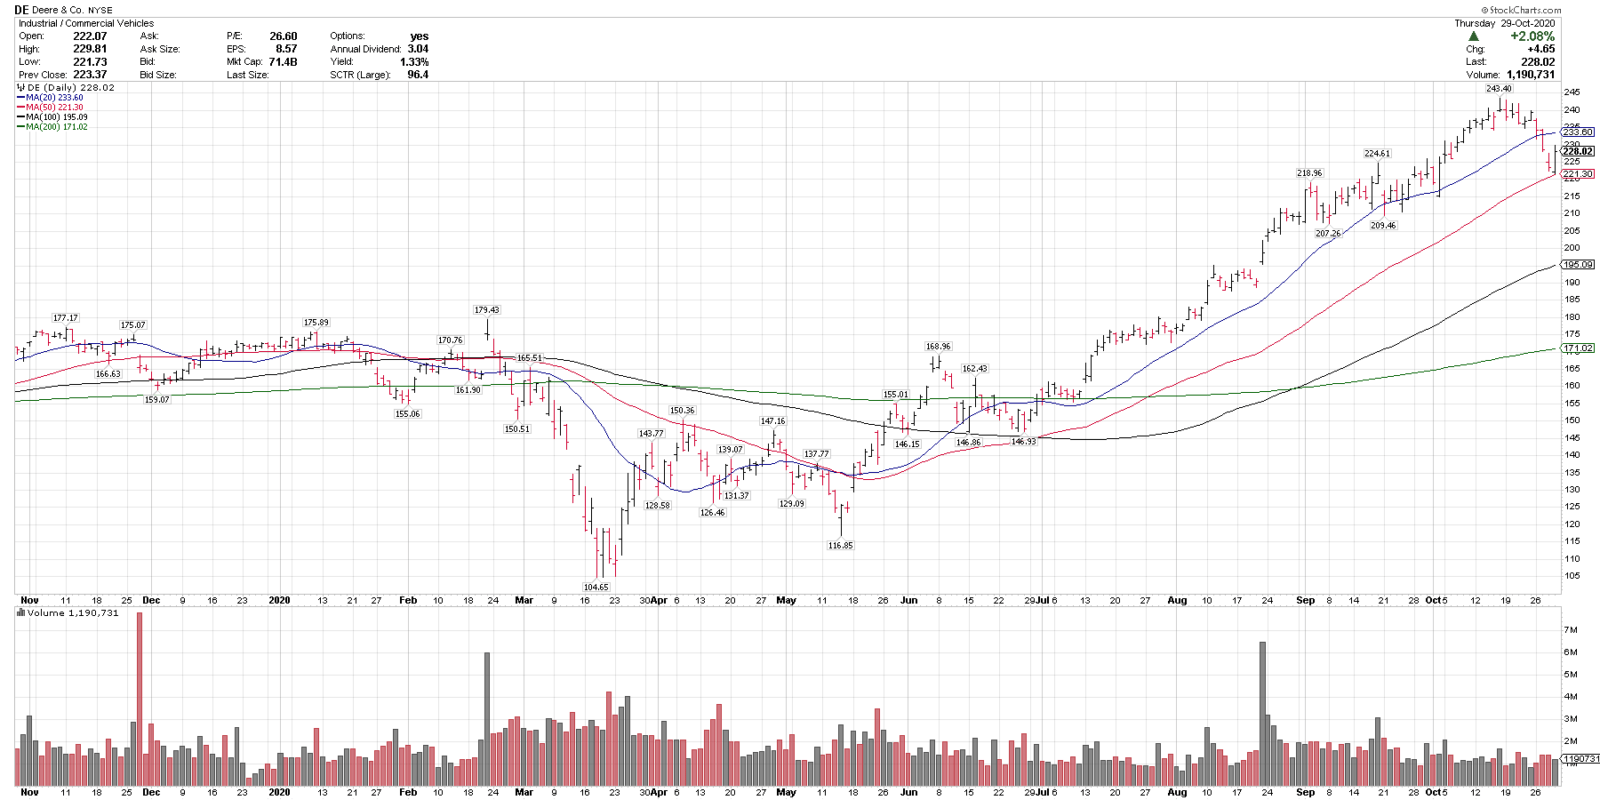
10/30/20
Deere & Co., DE
Close: 228.02
Pre-mkt: 225.75
Stop level: 191.88
DE is in a technical uptrend above the rising 50, 100 & 200-sma and recently pulled bac 9.0% off all-time highs into the rising 50-sma. 205-220 is a support range on any further pullbacks.
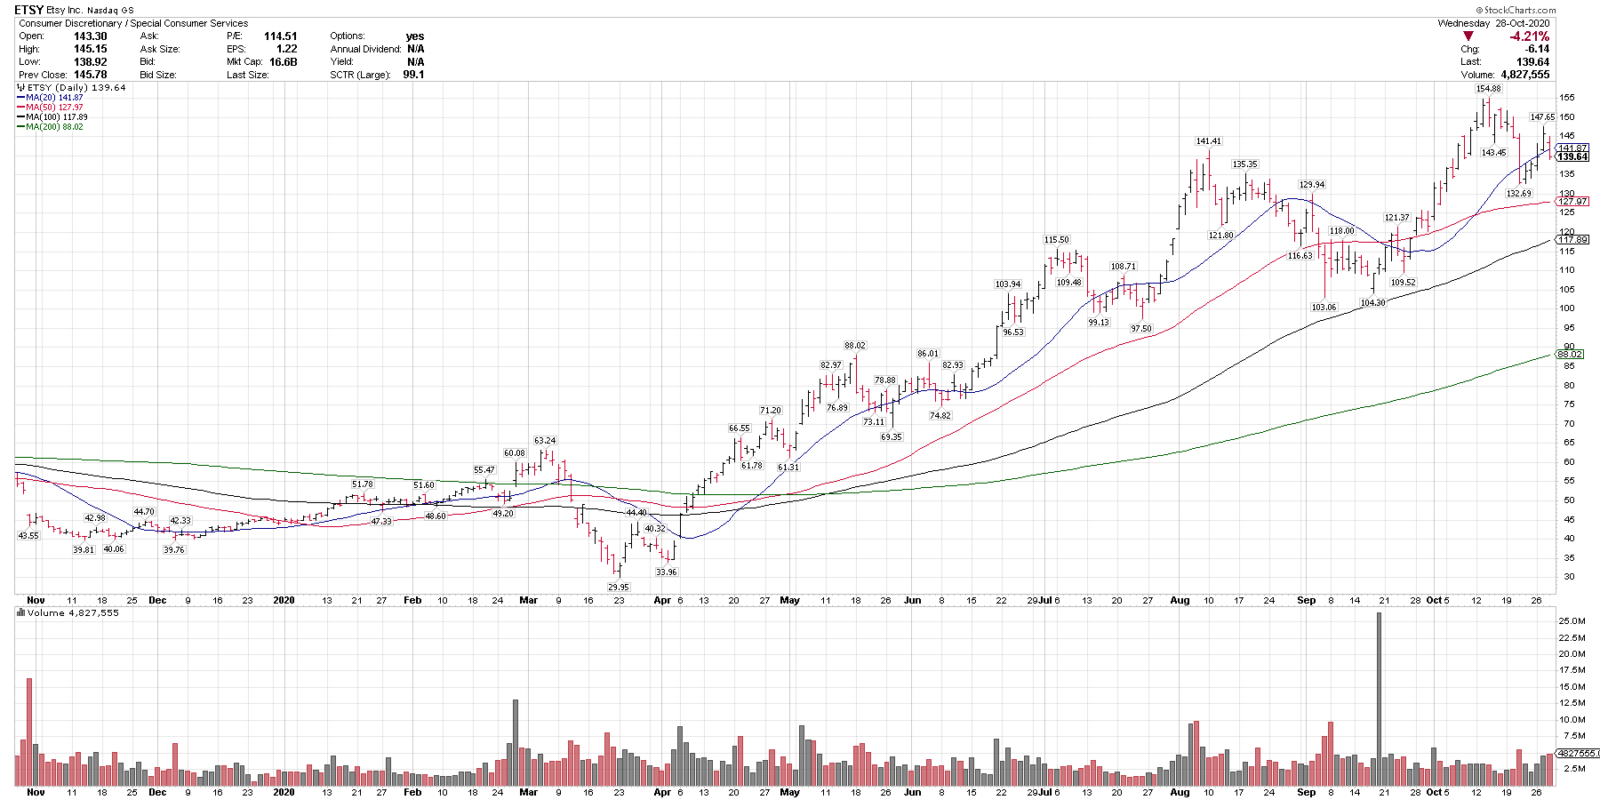
10/29/20
Etsy Inc., ETSY
Pre-market: 137.55
Stop level: 113.47
(wider stop due to higher market volatility here)
ETSY is in a longer term uptrend above the rising 50, 100 & 200-sma. It recently corrected 14.3% off all-time highs.
10/28/20
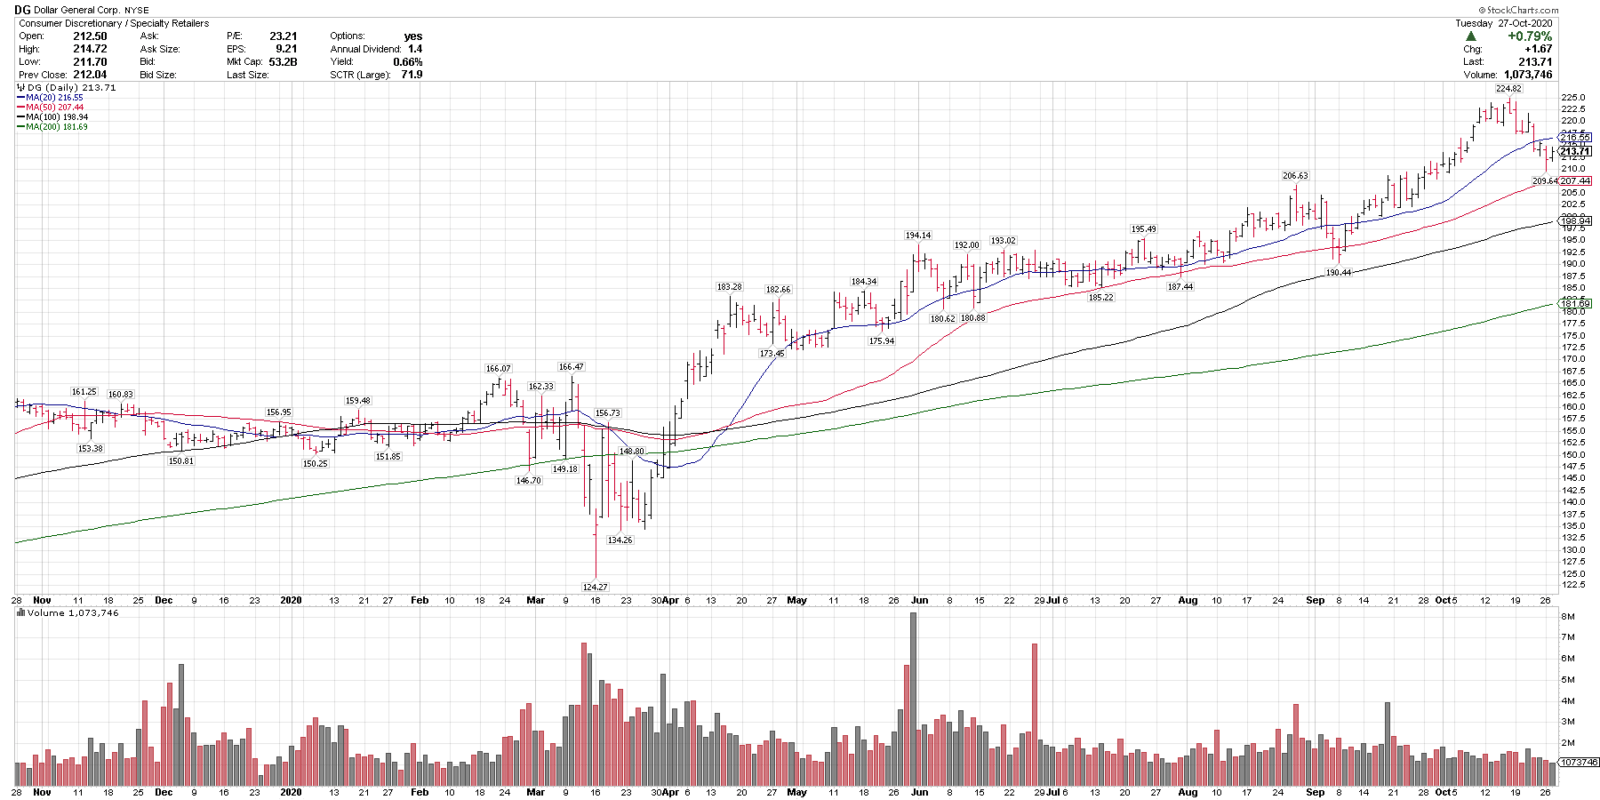
Dollar General, DG
Close: 213.71
Stop level: 181.55
DG is in a technical uptrend above the rising 50, 100 & 200-sma & recently pulled back 6.75% off all-time highs. Key support at 195-200.
10/27/20
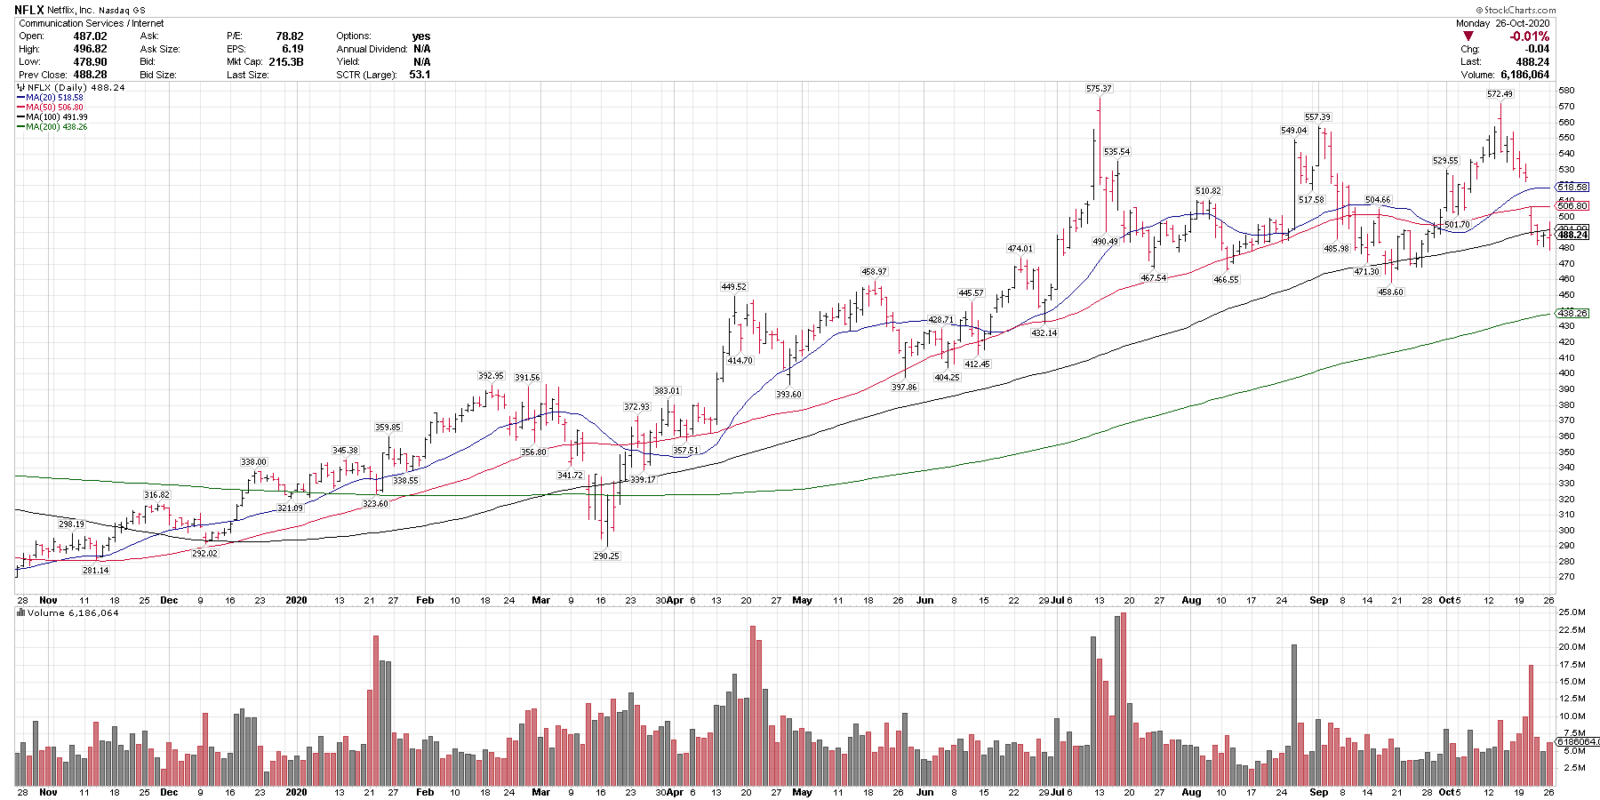
Netflix, NFLX
Close: 488.24
Pre-mkt: 489.50
Stop level: 414.96
NFLX is consolidating in a longer-term uptrend and pulled back 16.1% off recent highs. There is key support in the 450-470 range.
10/26/20
Blue Chip Daily Chart of the Week:
Salesforce.com, CRM
Close: $250.52
Stop level: $212.94
please see chart analysis below
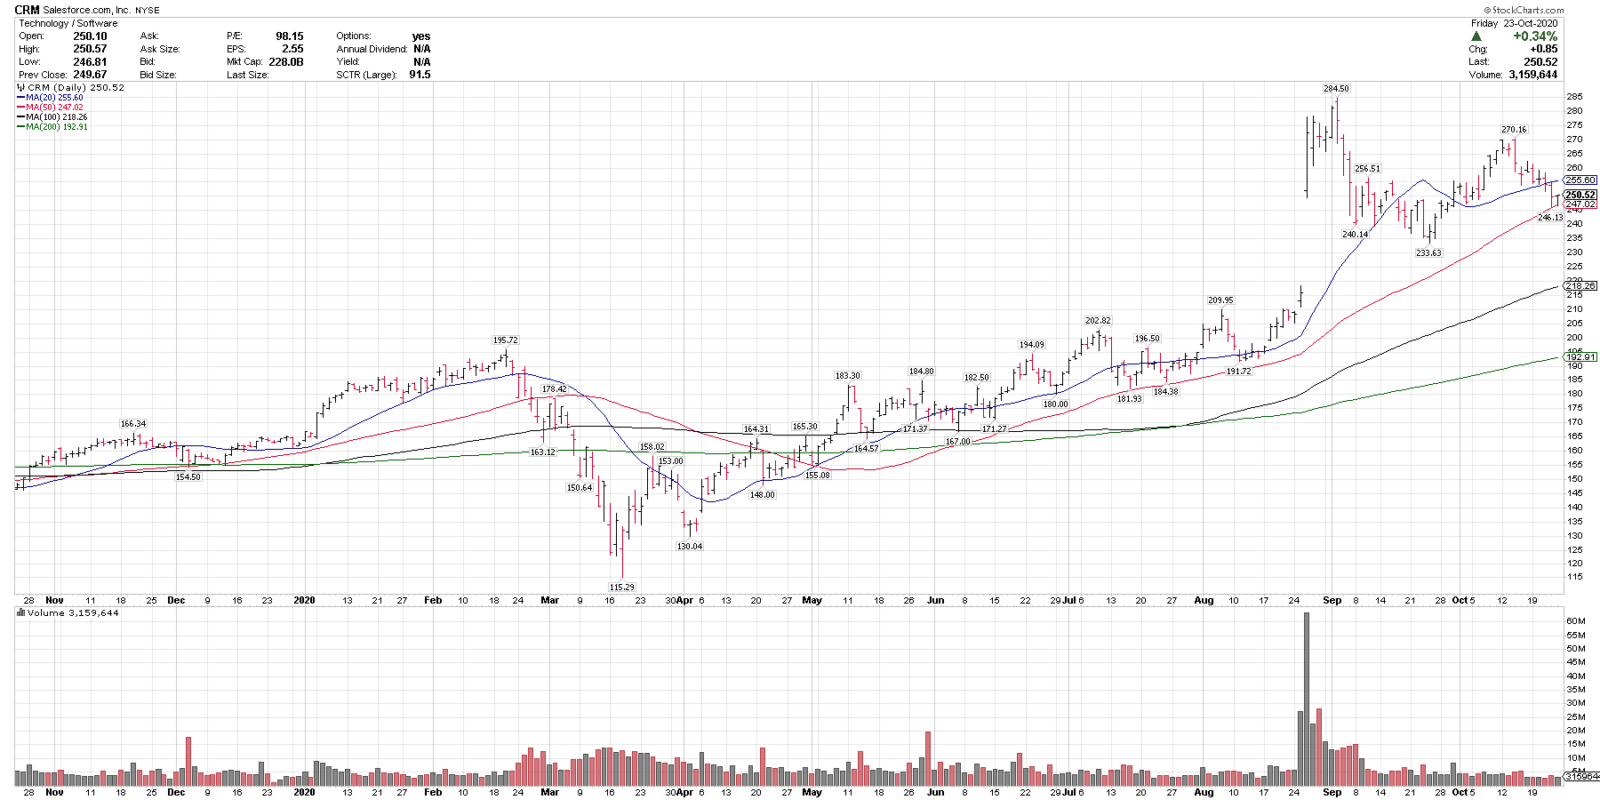
- Salesforce.com, CRM, is in a technical uptrend, above the rising 50, 100 and 200-day moving averages, indicating an uptrend on multiple time frames.
- CRM recently pulled back 17.8% off all-time highs and is testing the rising 50-sma currently.
- On any pullbacks, $235-245 is a key support range.
10/23/20
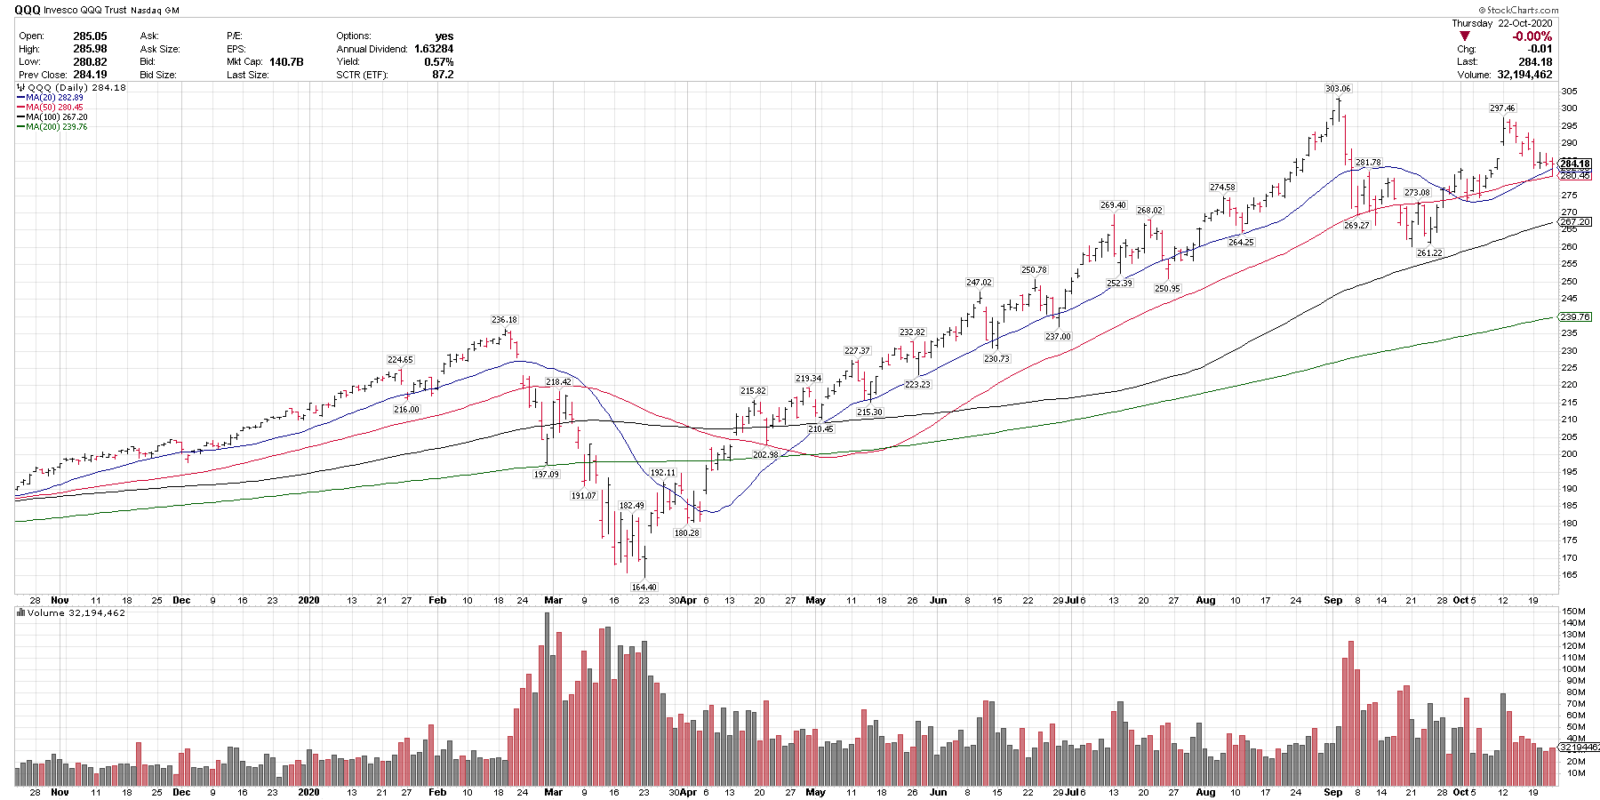
Nasdaq 100 ETF, QQQ
Close: 284.18
Stop level: 255.76
QQQ is in an uptrend above the rising 50, 100 & 200-sma & has pulled back here, down 7 of the last 8 days, into the 50-sma. With many tech names reporting next week, it could be set up well for a rotation to the upside.
10/22/20
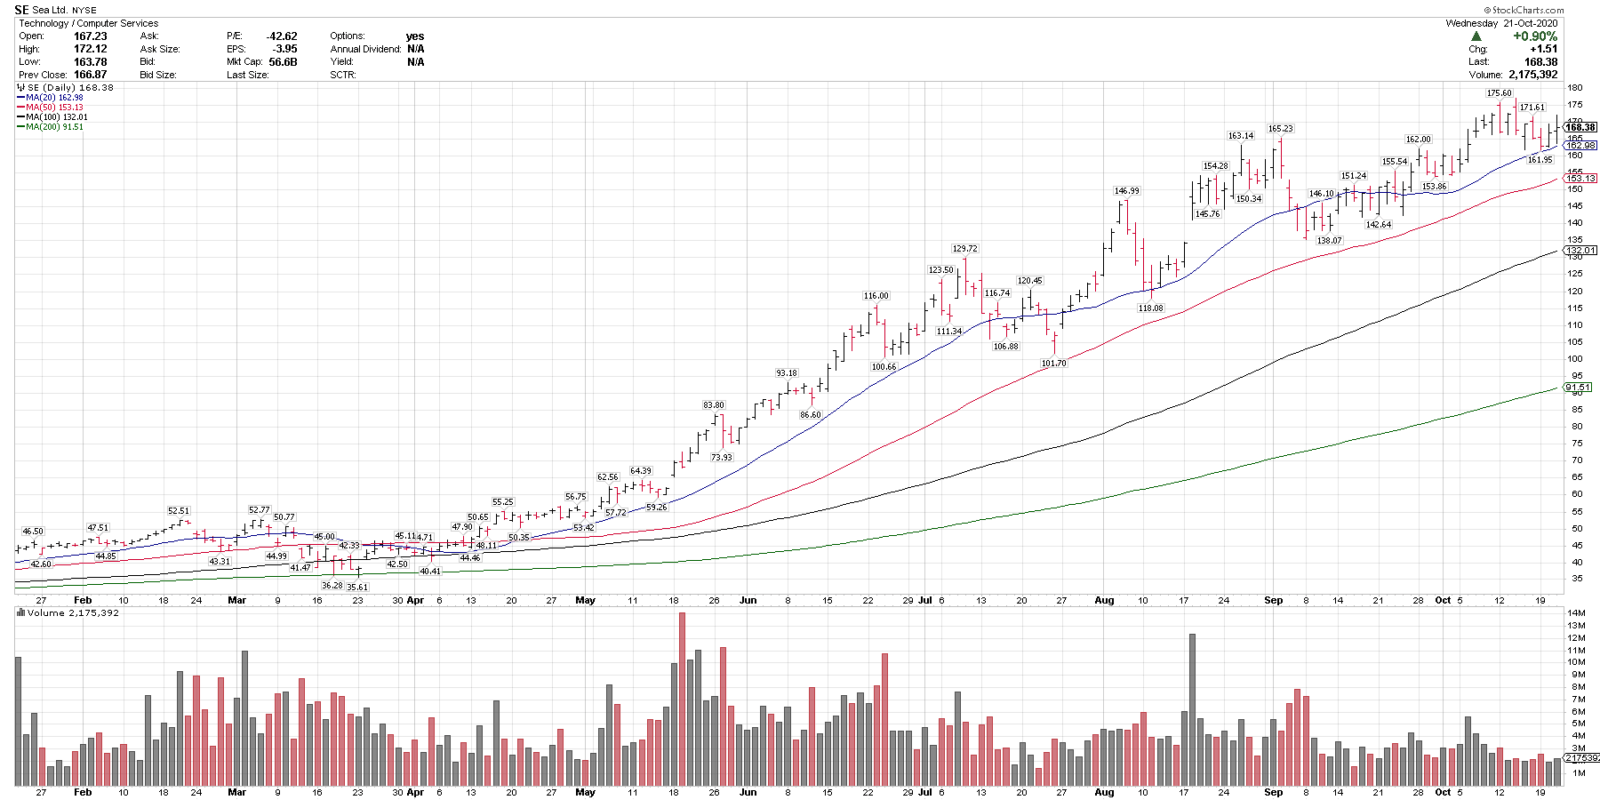
Sea Limited, SE
Close/Pre-market: 168.38
Stop level: 141.43
SE is in a technical uptrend above all key rising MAs and recently corrected 7.7% off all-time highs. 145-160 is key support on any pullbacks.
10/21/20
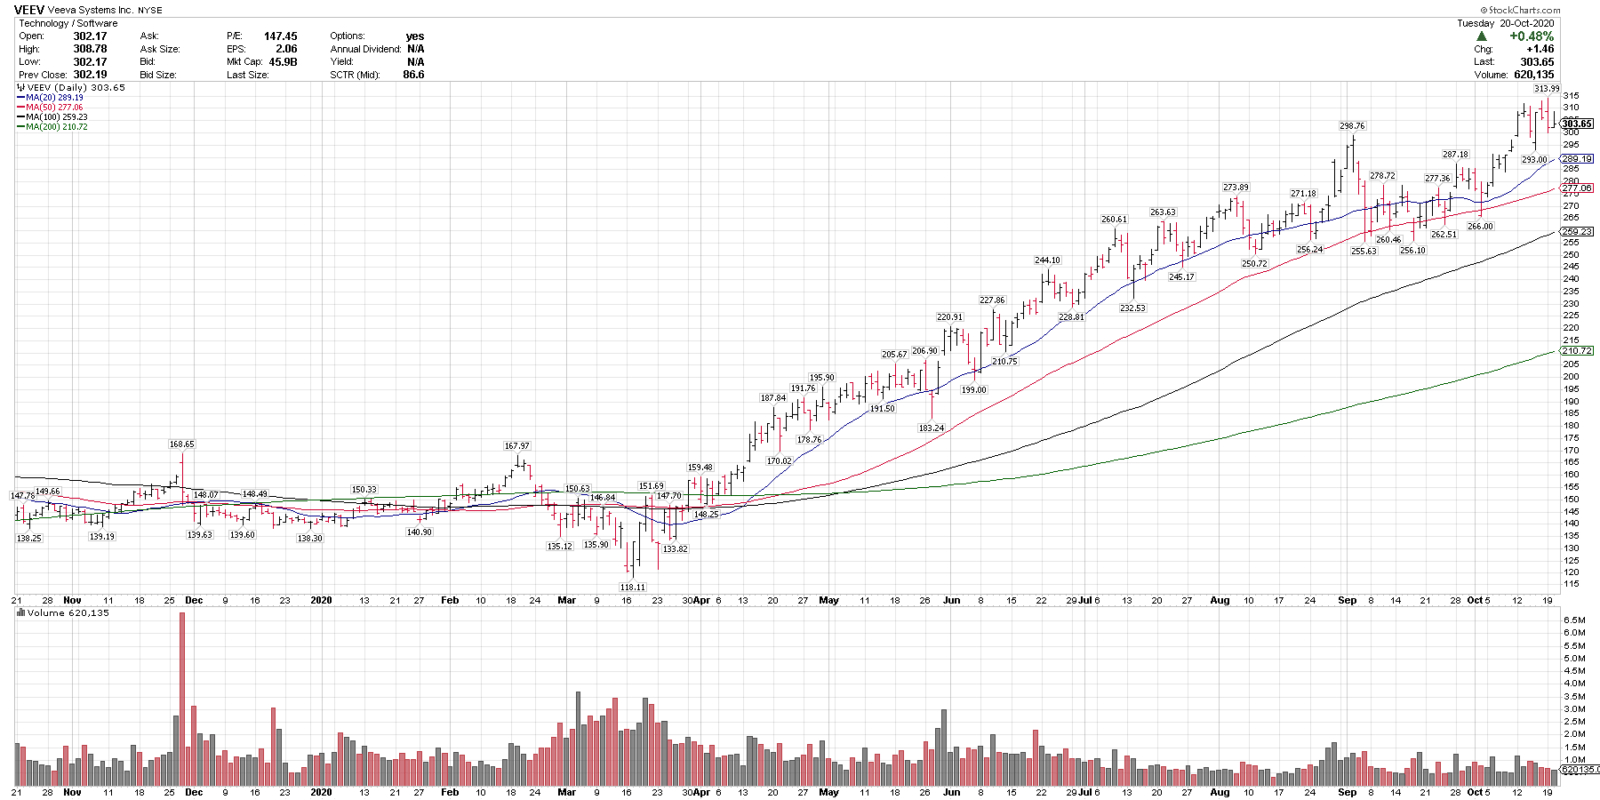
Veeva Systems, VEEV
Close: 303.65
Pre-mkt: 306.21
Stop level: 258.10
VEEV is in a technical uptrend above all key rising MAs and recently corrected 14.4% off all-time highs. There is key support in the 270-285 range.
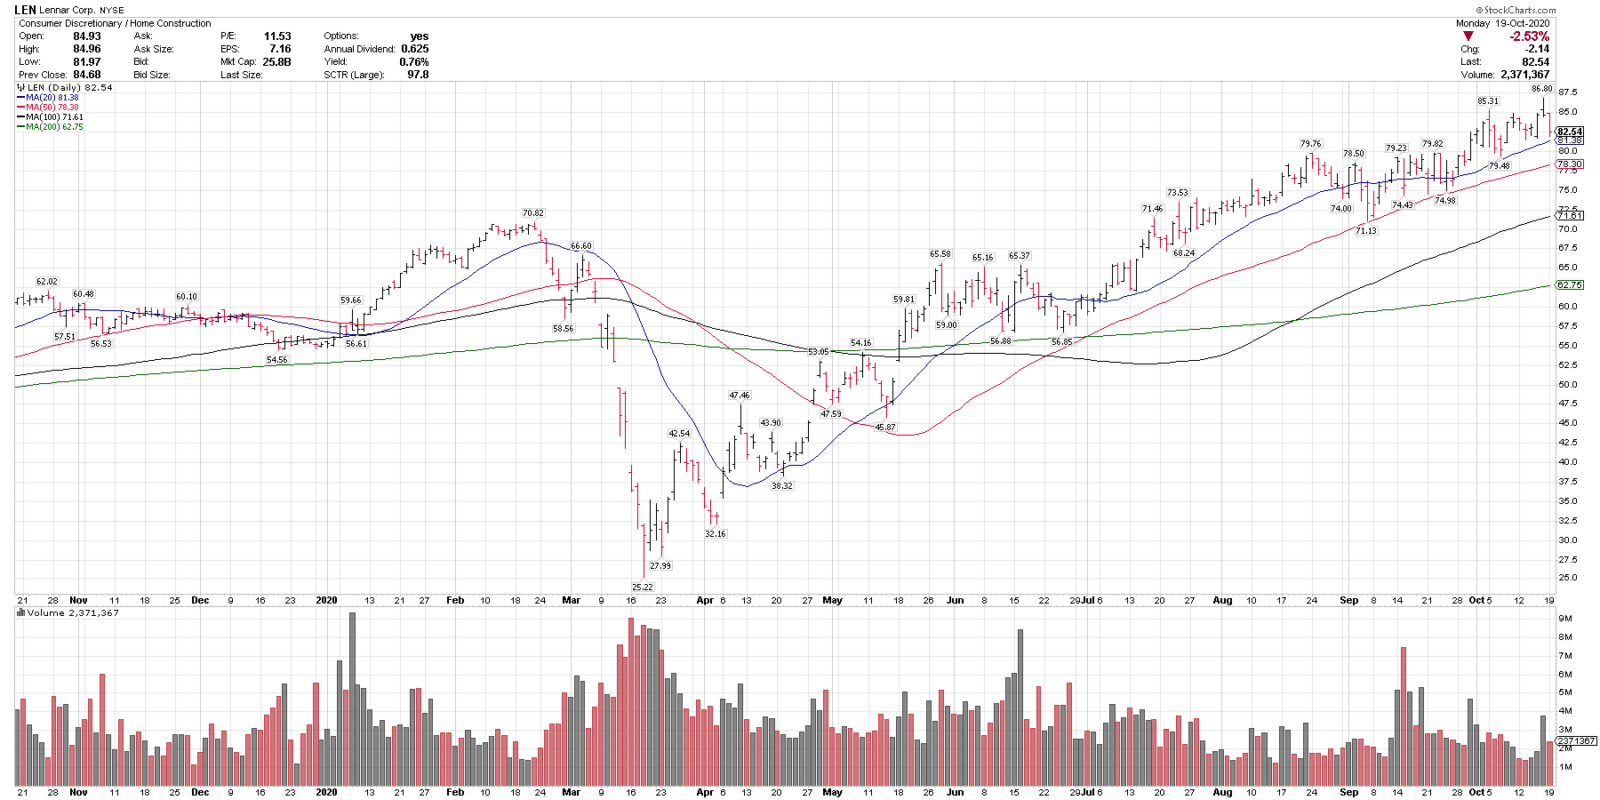
10/20/20
Lennar Corp, LEN
Close: 82.54
Pre-mkt: 82.88
Stop level: 69.85
LEN is in a technical uptrend above all key rising MAs with no closes below the 50-sma since April.
10/19/20
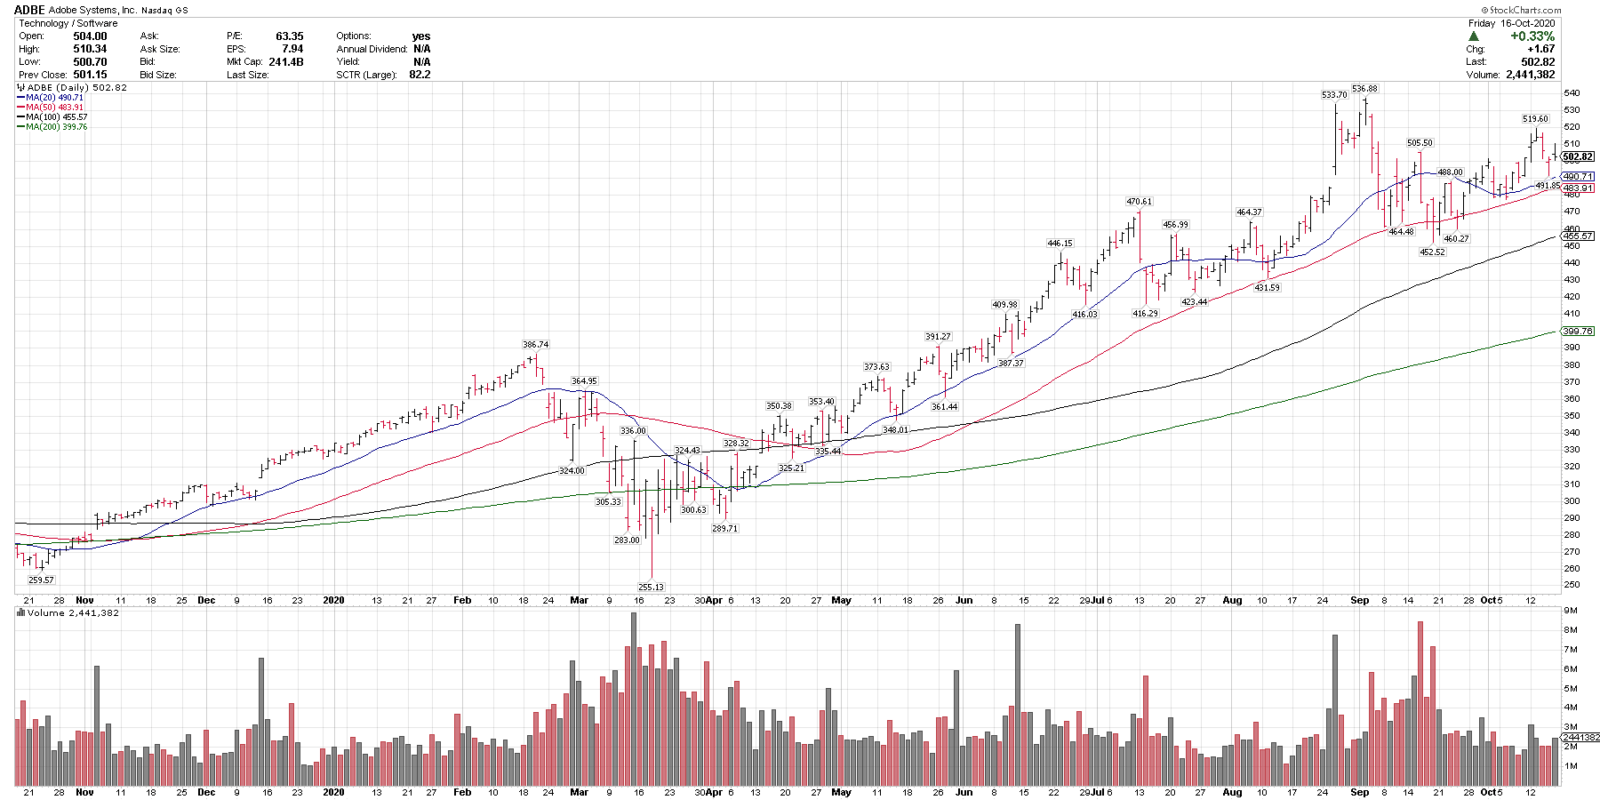
Adobe Systems, ADBE
Close: 502.82
Pre-mkt: 506.40 (+.71%)
Stop level: 427.39
ADBE is in a technical uptrend above all key rising MAs and recently corrected 15.7% of all-time highs. 450-470 is support on any pullbacks.
10/16/20
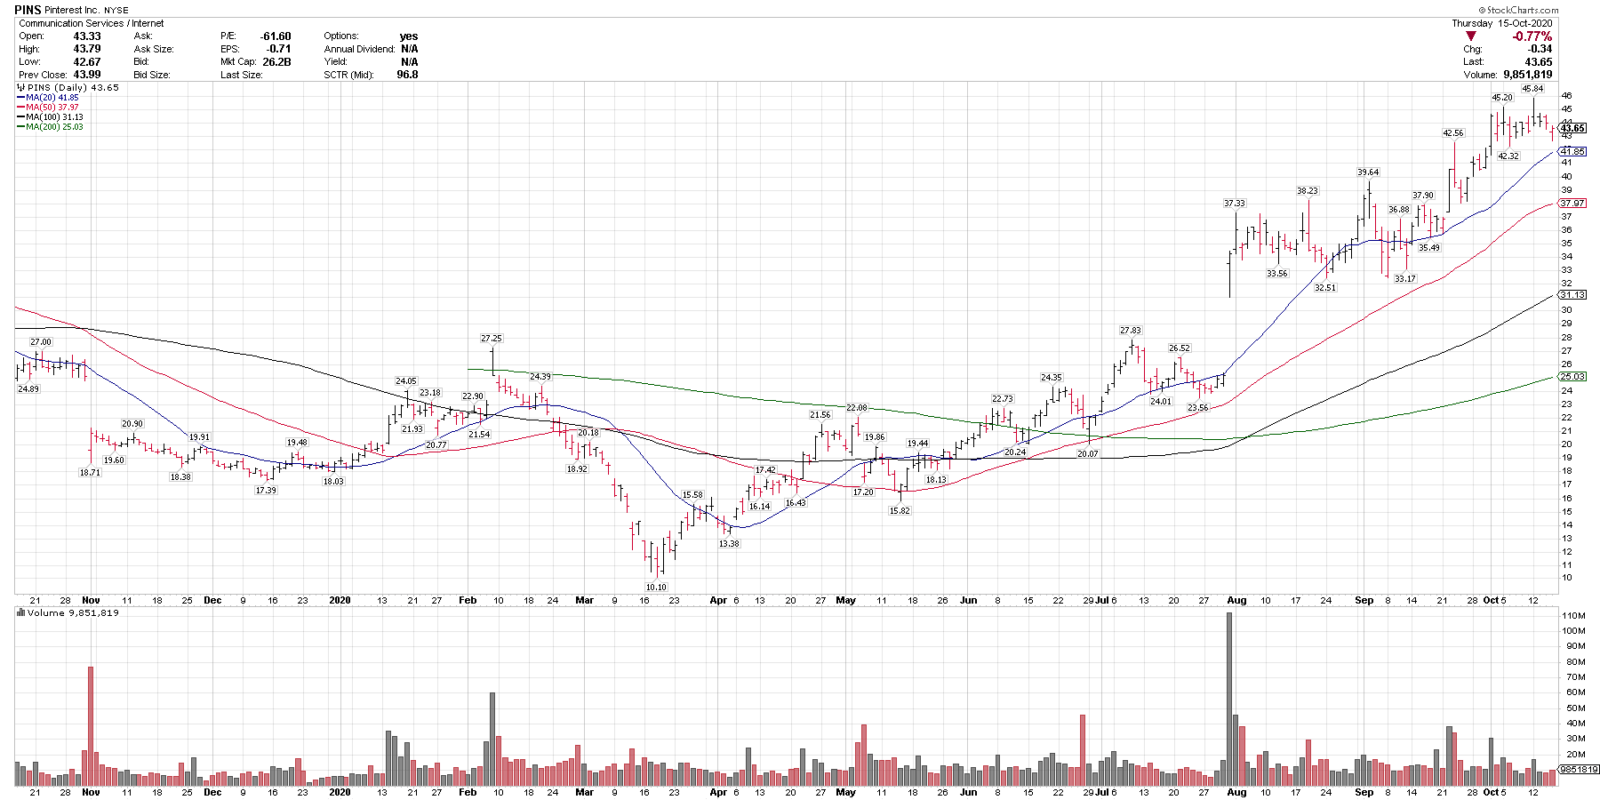
Pinterest, PINS
Close: 43.65
Pre-mkt: 44.72
Stop level: 36.88
PINS is in a technical uptrend above all key rising MAs and is consolidating from a breakout to new highs. $38 & $40 are support levels on any pullbacks. Also on this week’s Top 25 list.
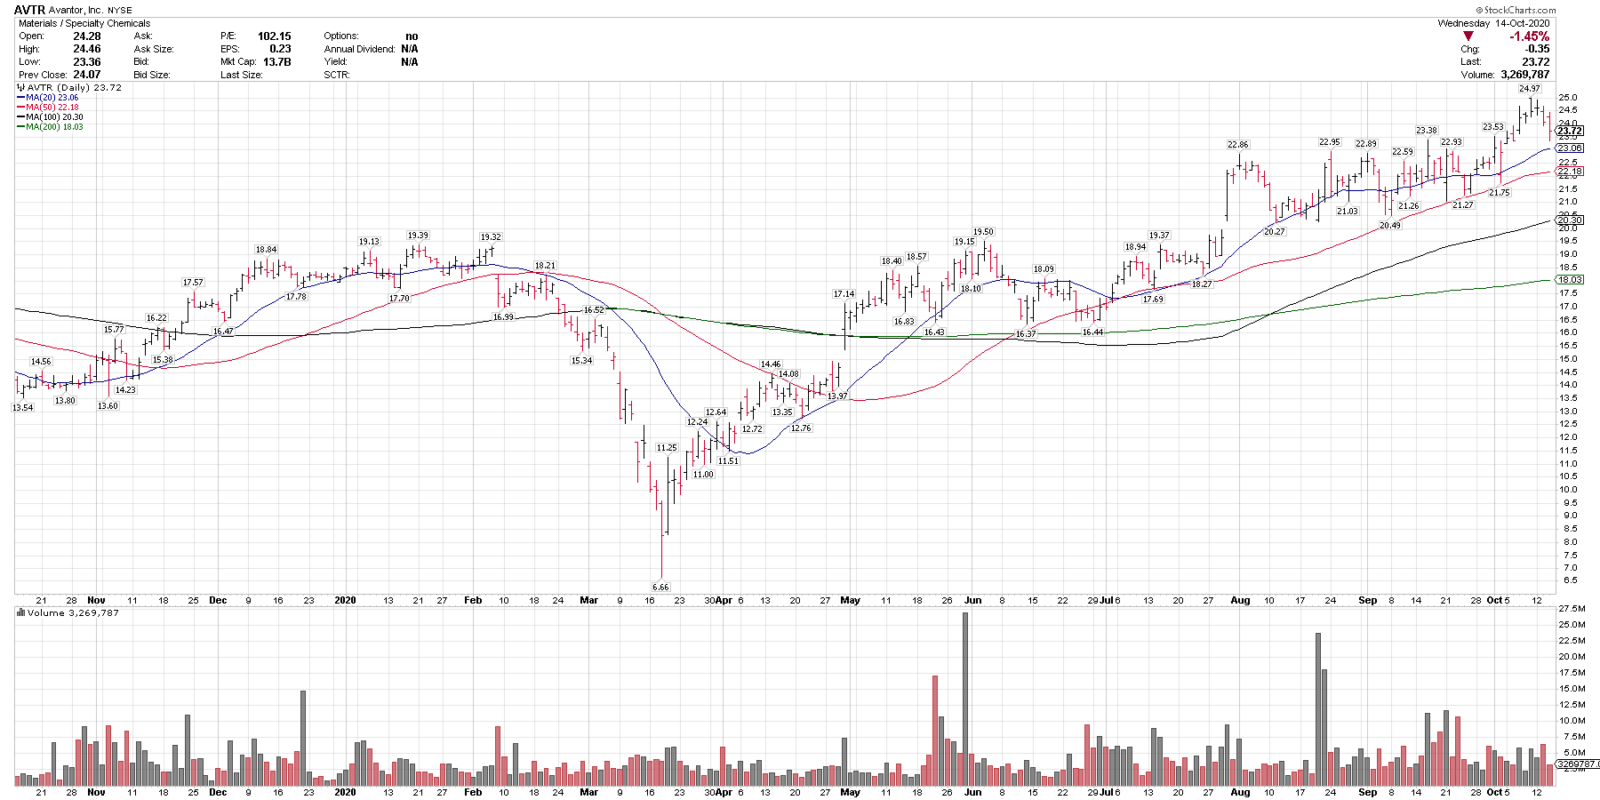
10/15/20
Avantor, AVTR
Close: 23.72
Pre-mkt: 23.20
Stop level: 19.86
AVTR is in a technical uptrend above all key rising MAs and is consolidating off recent all-time highs.
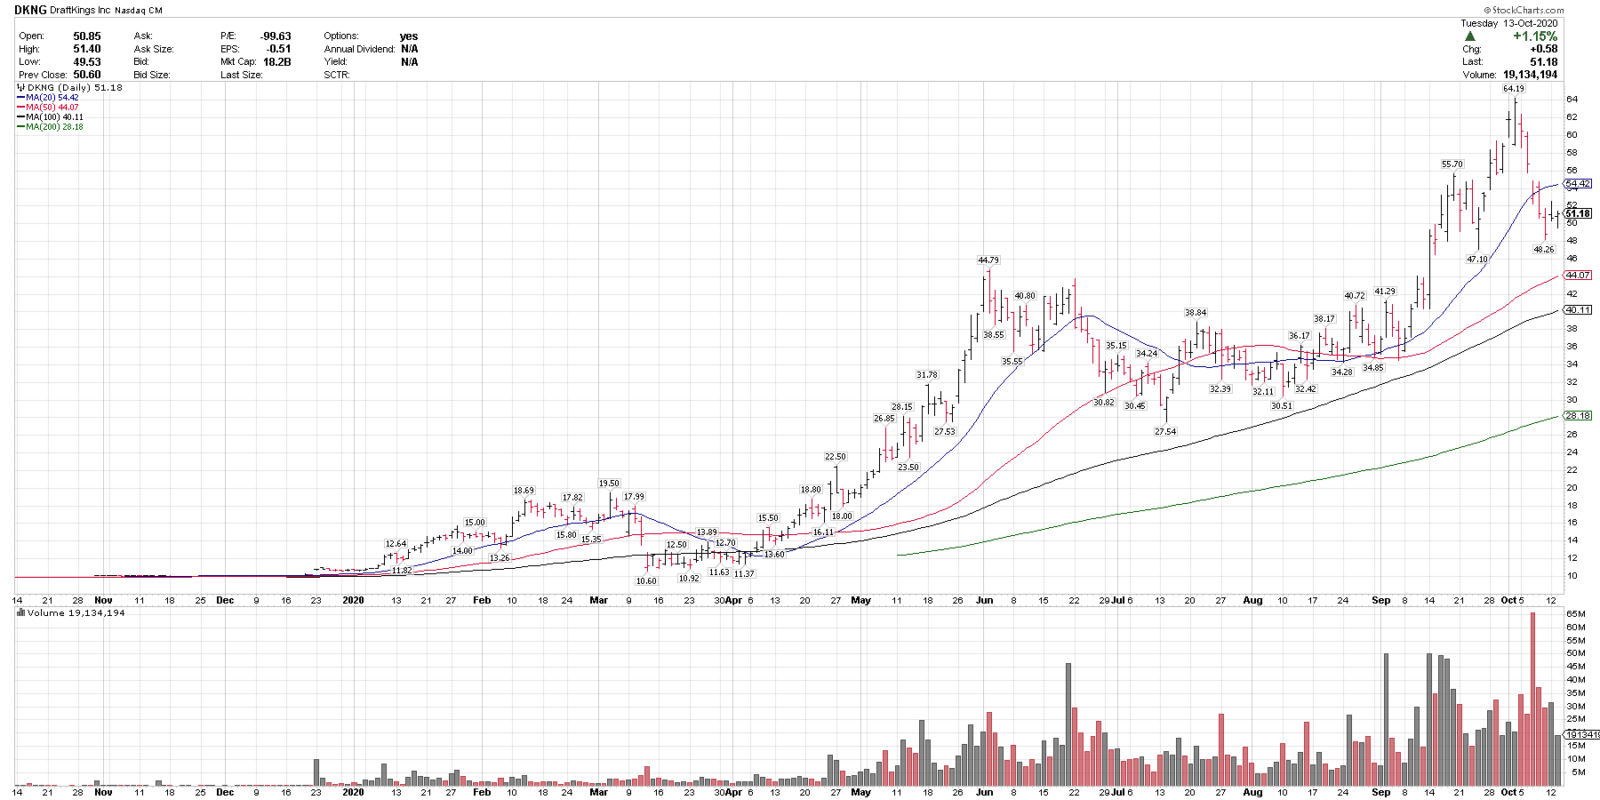
10/14/20
DraftKings, DKNG
Close: 51.18
Pre-mkt: 51.40
Stop level: 43.40
DKNG is in a longer-term uptrend above rising 50, 100 & 200-sma & recently corrected 24.8% off all time highs. DKNG is a higher volatility stock but may offer good potential return vs risk. Over $44 is key.
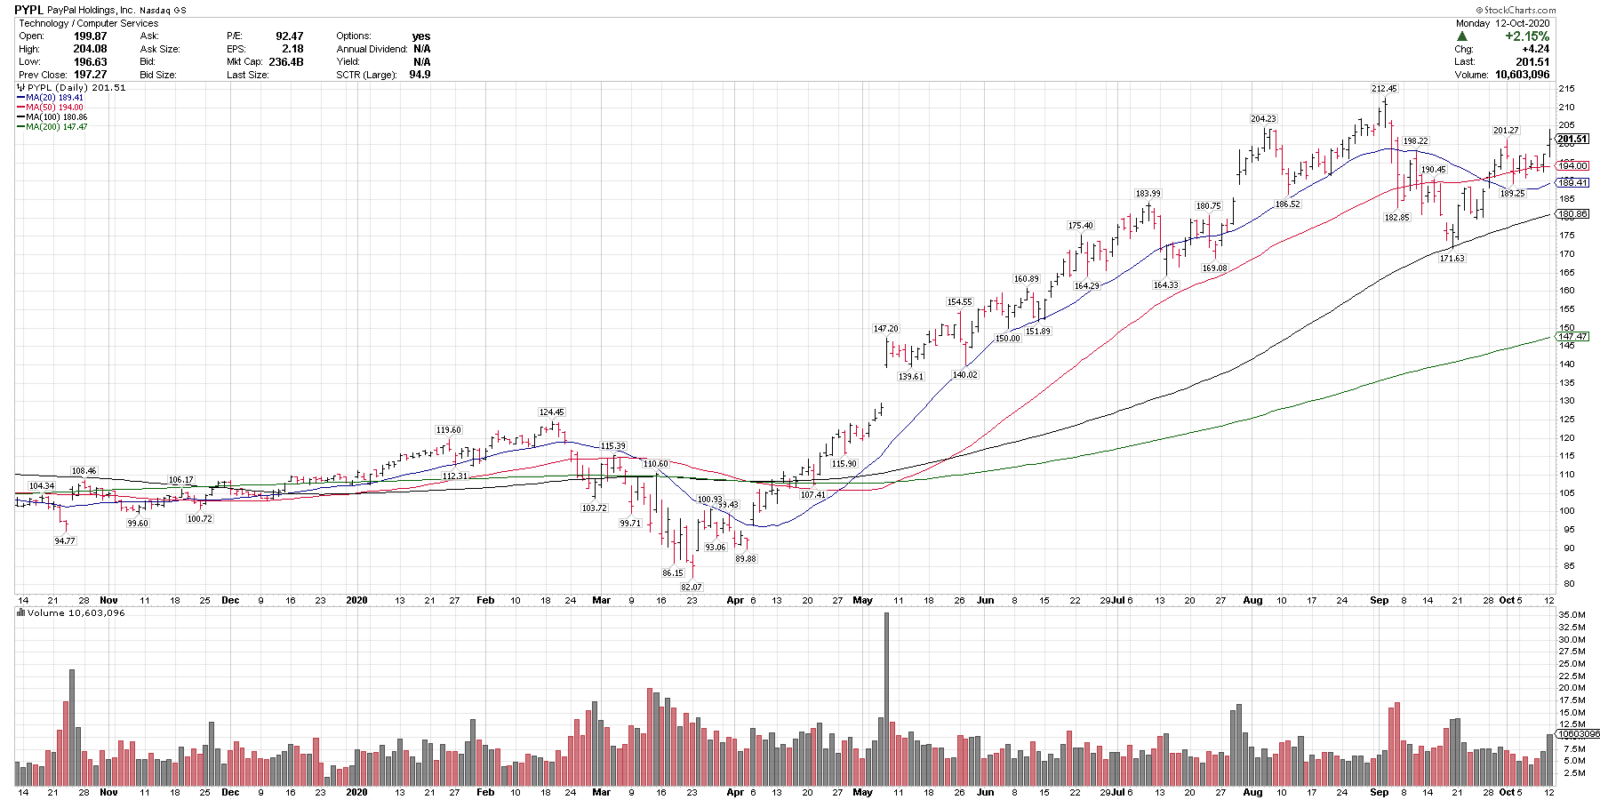
10/13/20
PayPal, PYPL
Close: 201.51
Pre-mkt: 203.85
Stop level: 170.48
PYPL is in a technical uptrend above all key rising MAs and recently corrected 19.2% off all-time highs. There is key support in the 175-195 range and a breakout over 205 could signal a move higher.
10/12/20
Zoom Video Communications, ZM
Close: 492.41
Pre-mkt: 501.60
Stop level: 418.54
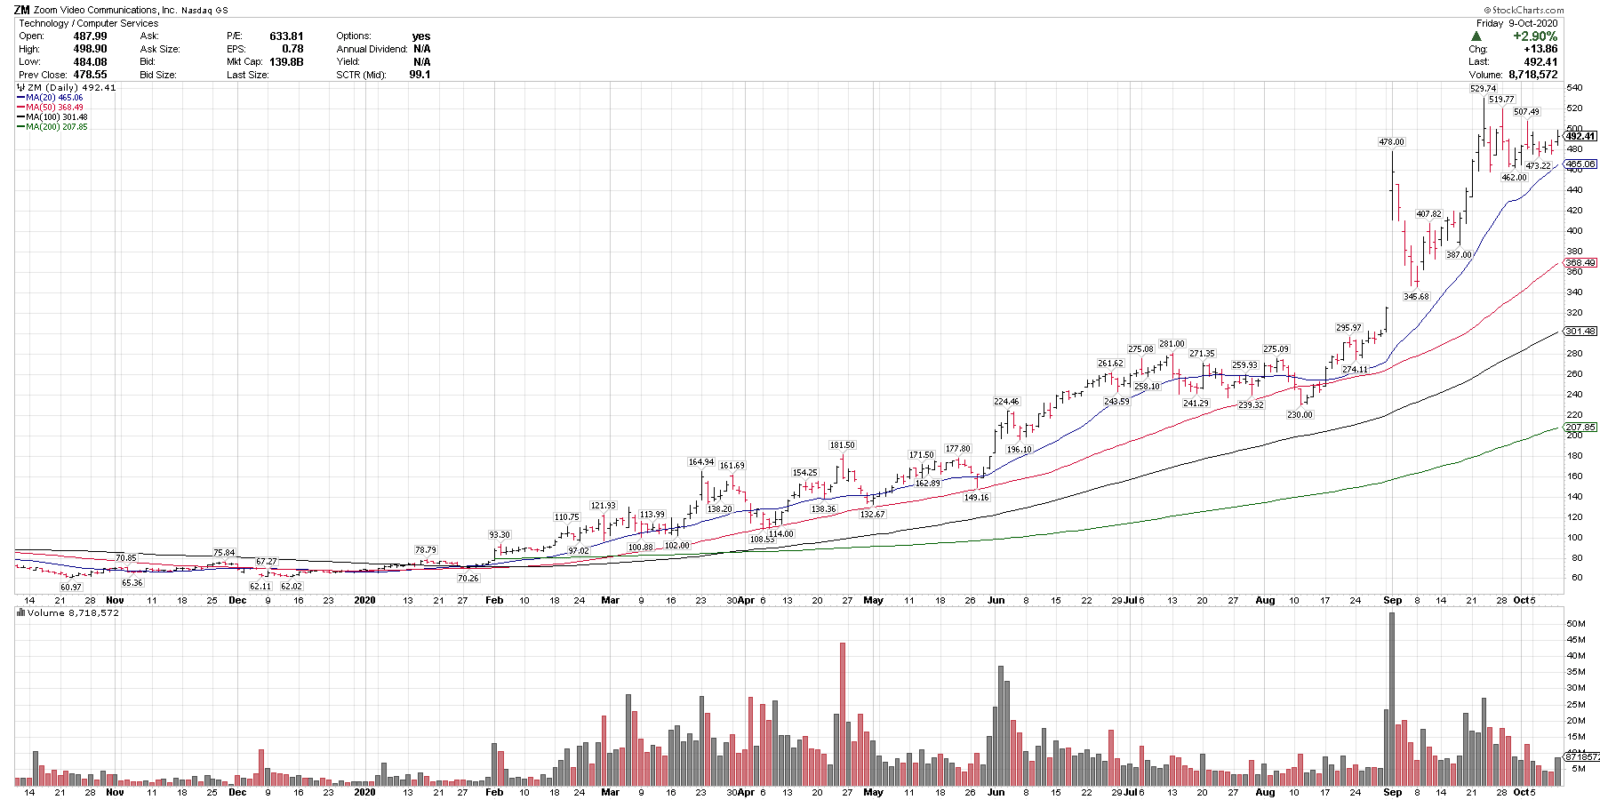
ZM is in a technical uptrend above all key rising MAs, and recently corrected 12.7% off all-time highs. 440-460 is key support & over 500 could signal a breakout higher.
10/11/20
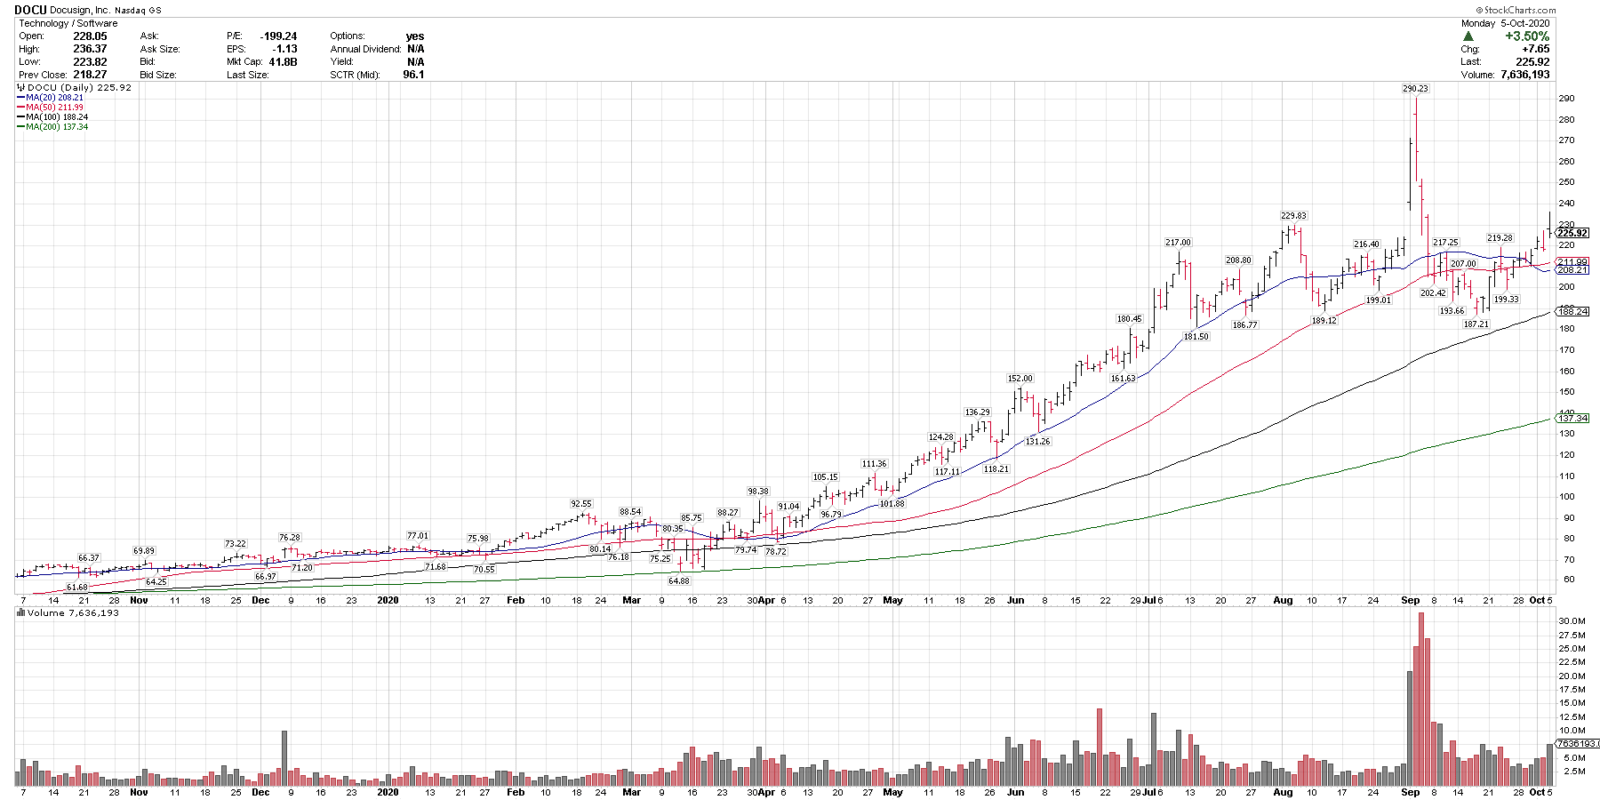
Blue Chip Daily Chart of the Week:
Docusign, DOCU
Close: $225.60
Stop level for position traders and investors: $189.37
please see chart analysis below
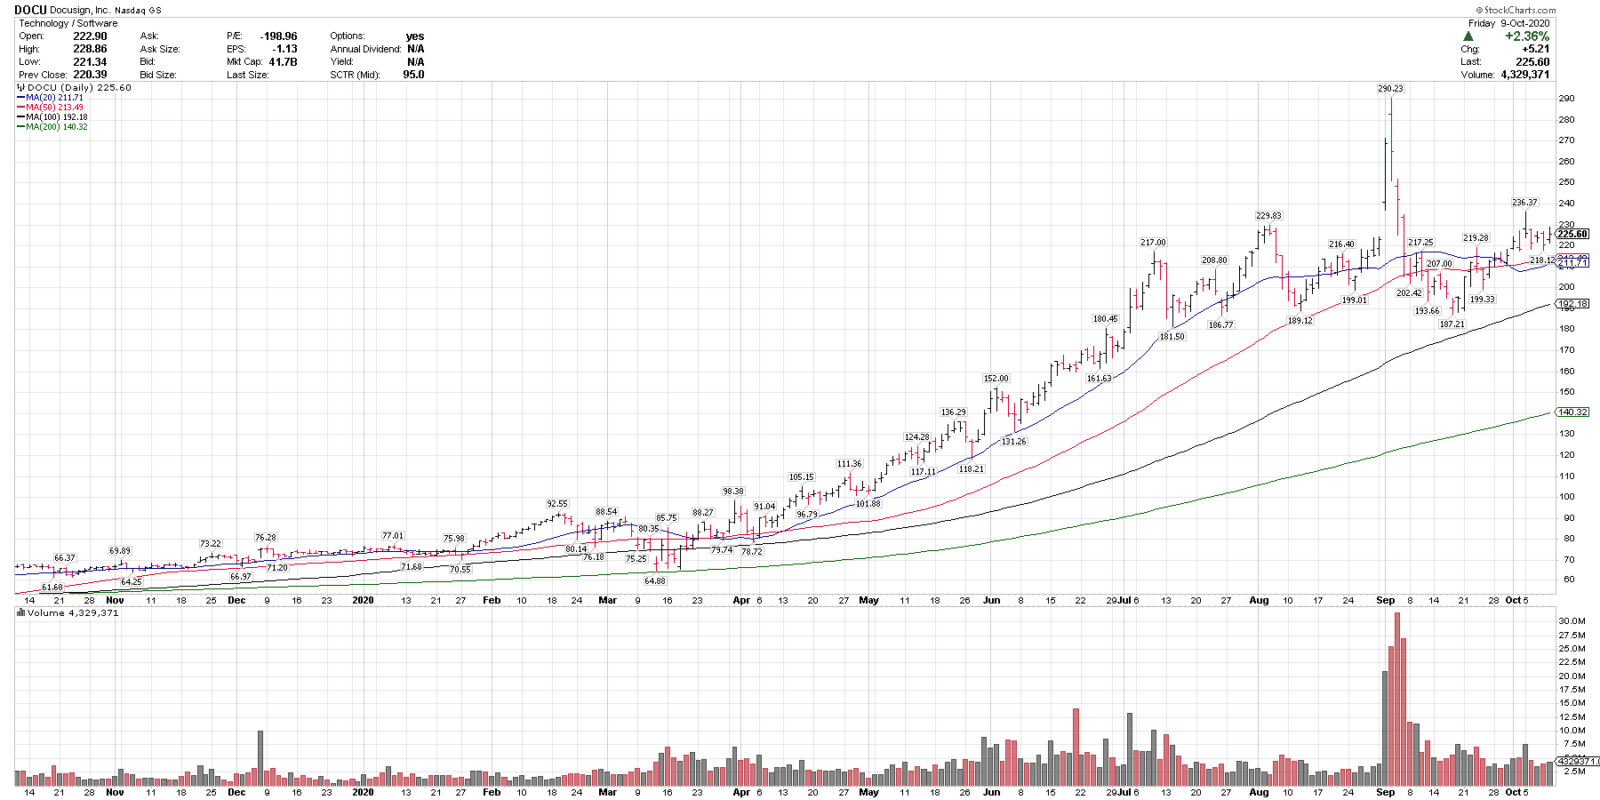
- Docusign, DOCU is in a technical uptrend above the rising 20, 50, 100 and 200-day moving averages, indicating an uptrend on multiple time frames.
- DOCU recently corrected 35.4% off all-time highs and has been consolidating between 190-220 for the past 3 months.
- DOCU made it’s highest weekly close on record on Friday, and it’s first weekly close over the 220 consolidation range.
- On any pullbacks, 220, 200 and 190 are key support levels.
10/09/20
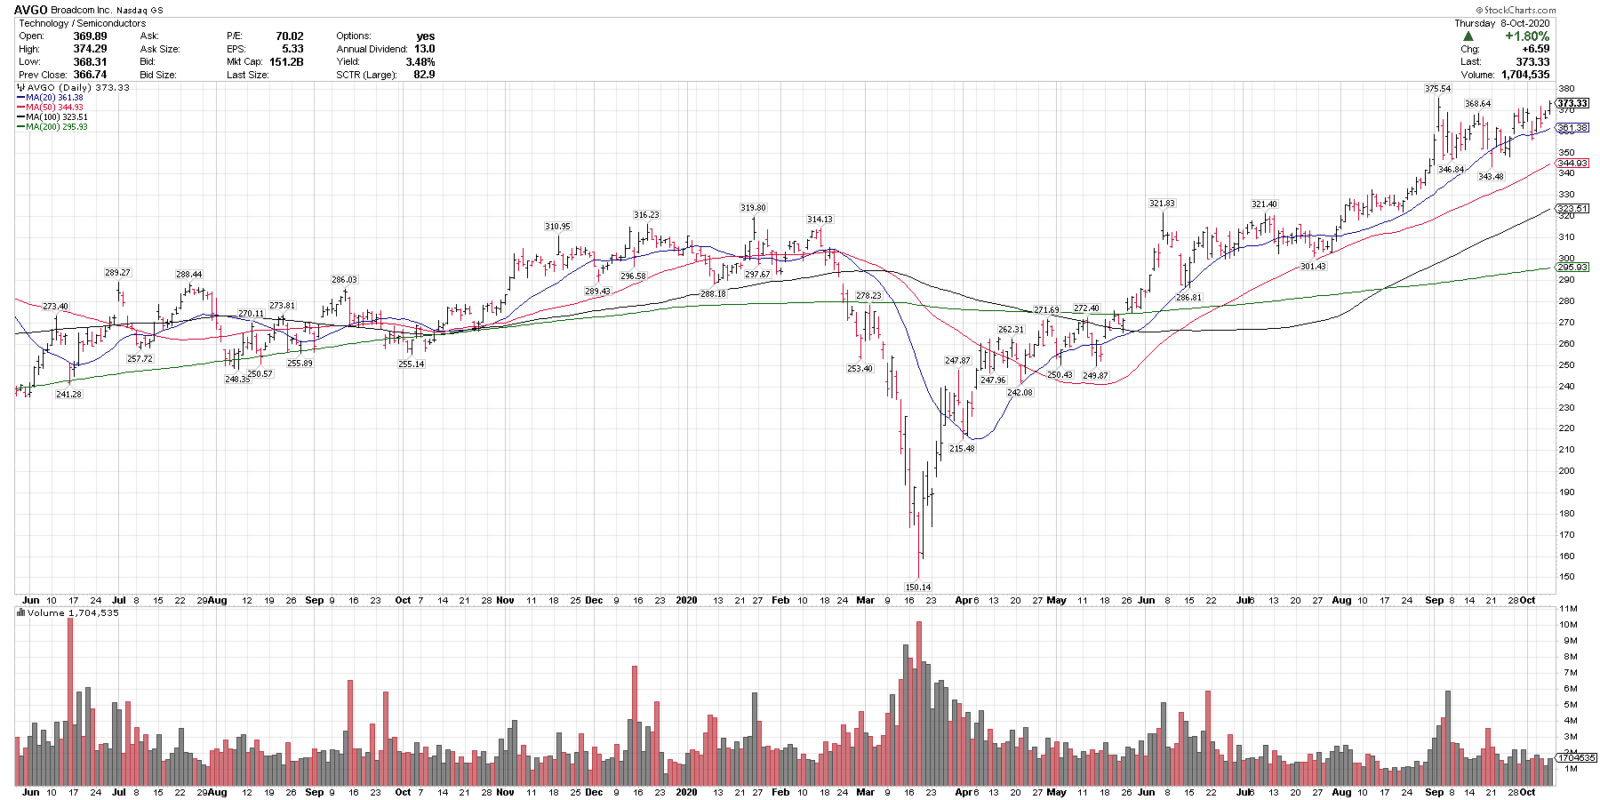
Broadcom, AVGO
Close: 373.33
Pre-mkt: 376.00
Stop level: 317.32
AVGO is in a technical uptrend above all key MAs, recently pulled back 8.5% off highs and is testing a breakout here. 340-345 is near term support.
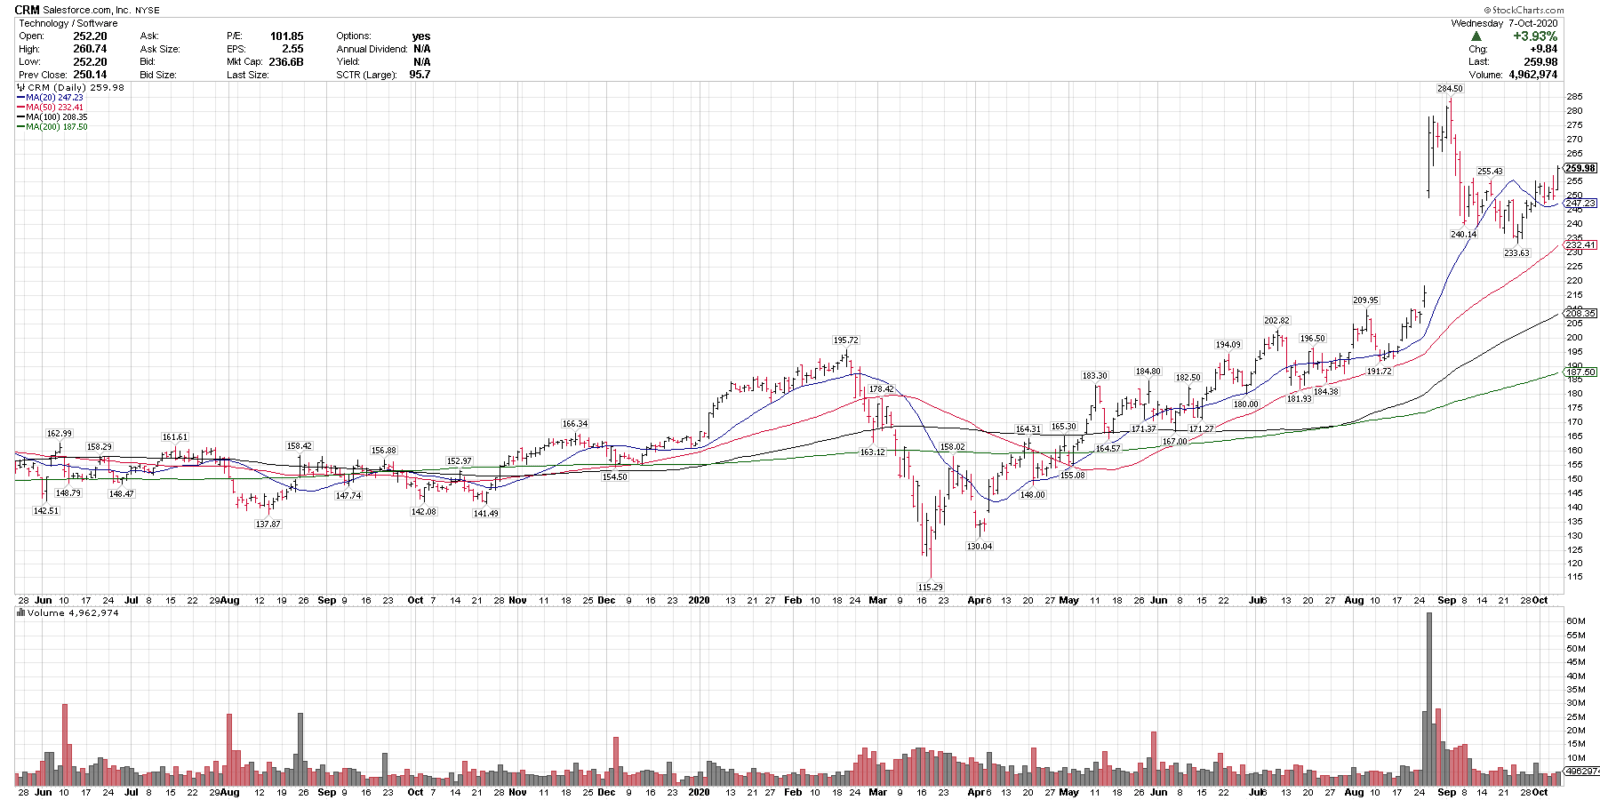
Salesforce.com, CRM
Close: 259.98
Pre-mkt: 262.30
Stop level: 219.78
CRM is in a technical uptrend, trading above the rising 20, 50, 100 & 200-sma. It recently corrected 17.8% off all-time highs and just cleared the mid Sept. high.
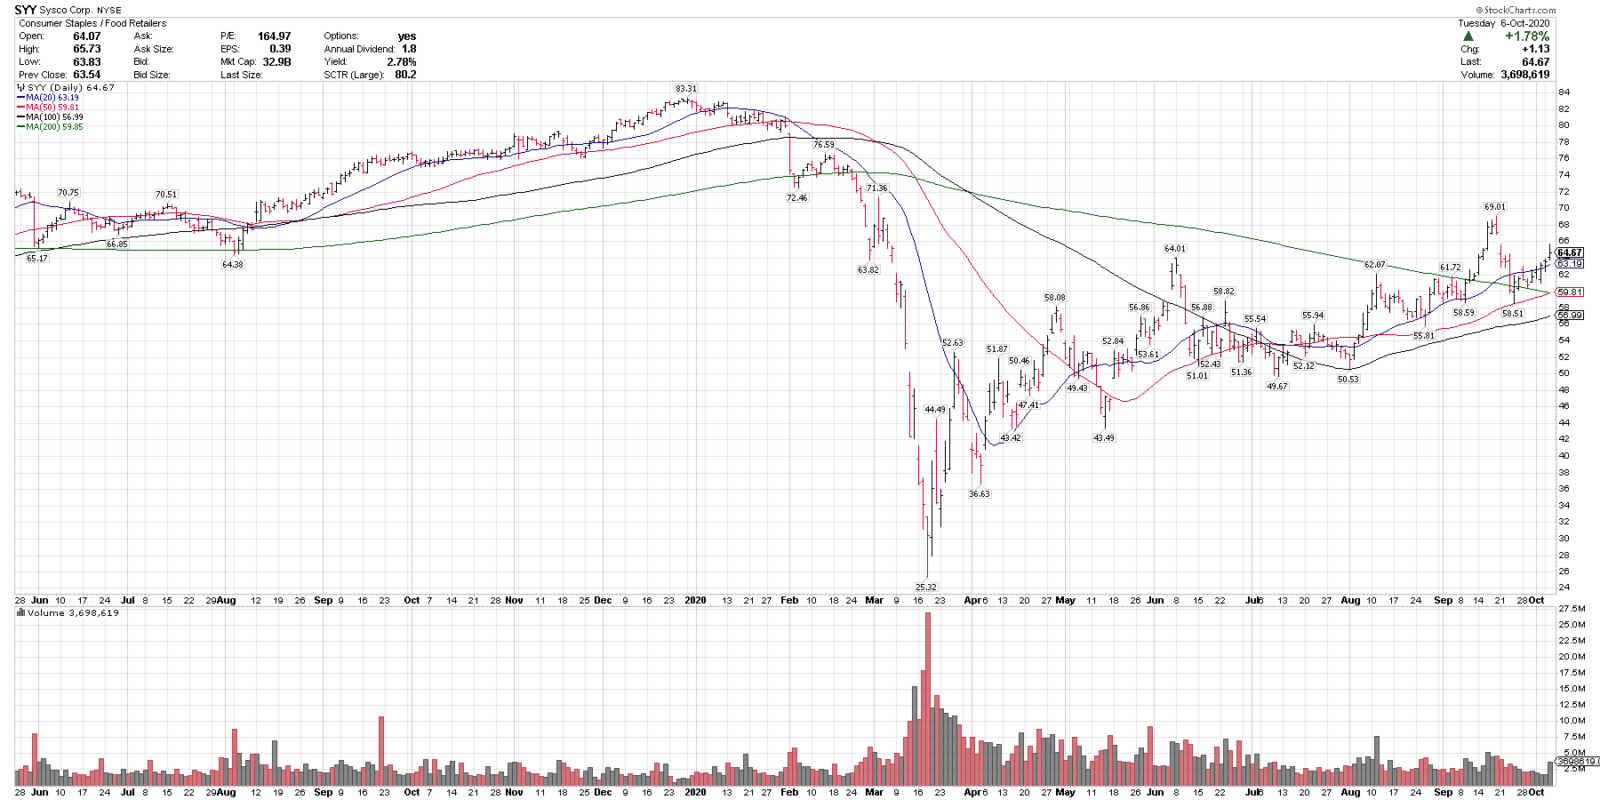
 10/07/20
Sysco Corp., SYY
Close: 64.67
Stop level: 54.96
SYY is in an intermediate-term uptrend above the rising 20, 50 and 100-sma, also above the 200-sma with rising RSI. It recently corrected 15.2% off 6-month highs into the rising 50-sma. It is pending a 50/200-sma cross.
 10/06/20
Docusign, DOCU
Close: 225.92
Pre-mkt: 228.99
Stop level: 189.77
DOCU is trading above all key MAs and starting to break out of a 3-month trading range. 220, 200 and 190 are key technical levels. DOCU recently corrected 35.4% off all-time highs.
 10/04/20
Chart of the Week & Monday Chart of the Day
Carrier Global, CARRClose: $31.23
Stop level for position traders and investors: $27.48
please see chart analysis below
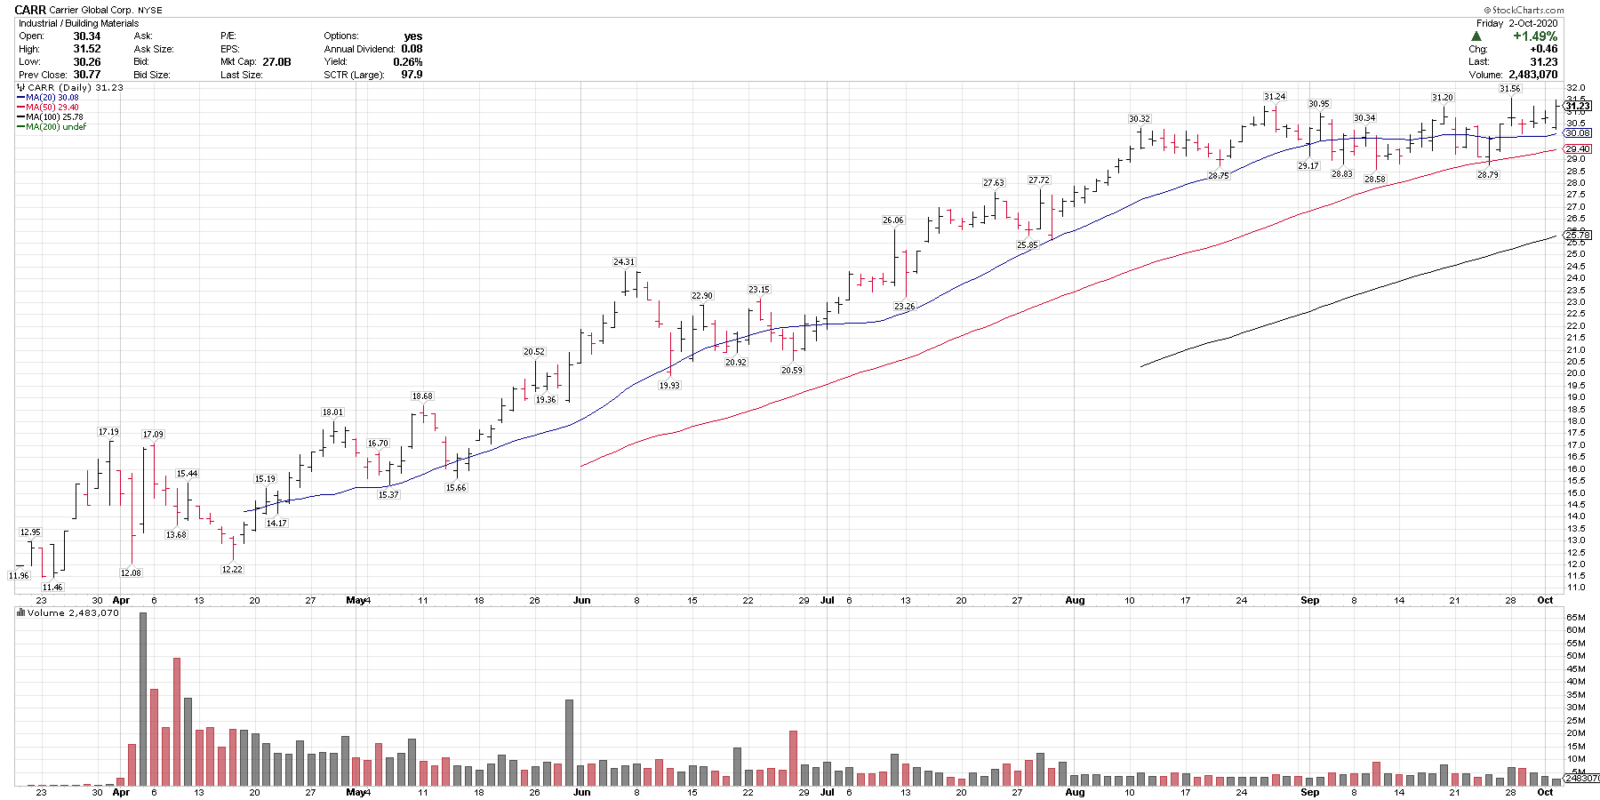
- Carrier (CARR) is in a technical uptrend above the rising 20, 50 and 100-day moving averages, indicating an uptrend on multiple time frames.
- CARR was recently spun off from RTX and does not have a 200-dma as of yet.
- CARR reached a new all-time high last week, and made a weekly closing high, showing above average relative strength and testing an upside breakout.
- The rising 50-sma is a key intermediate term trend gauge.
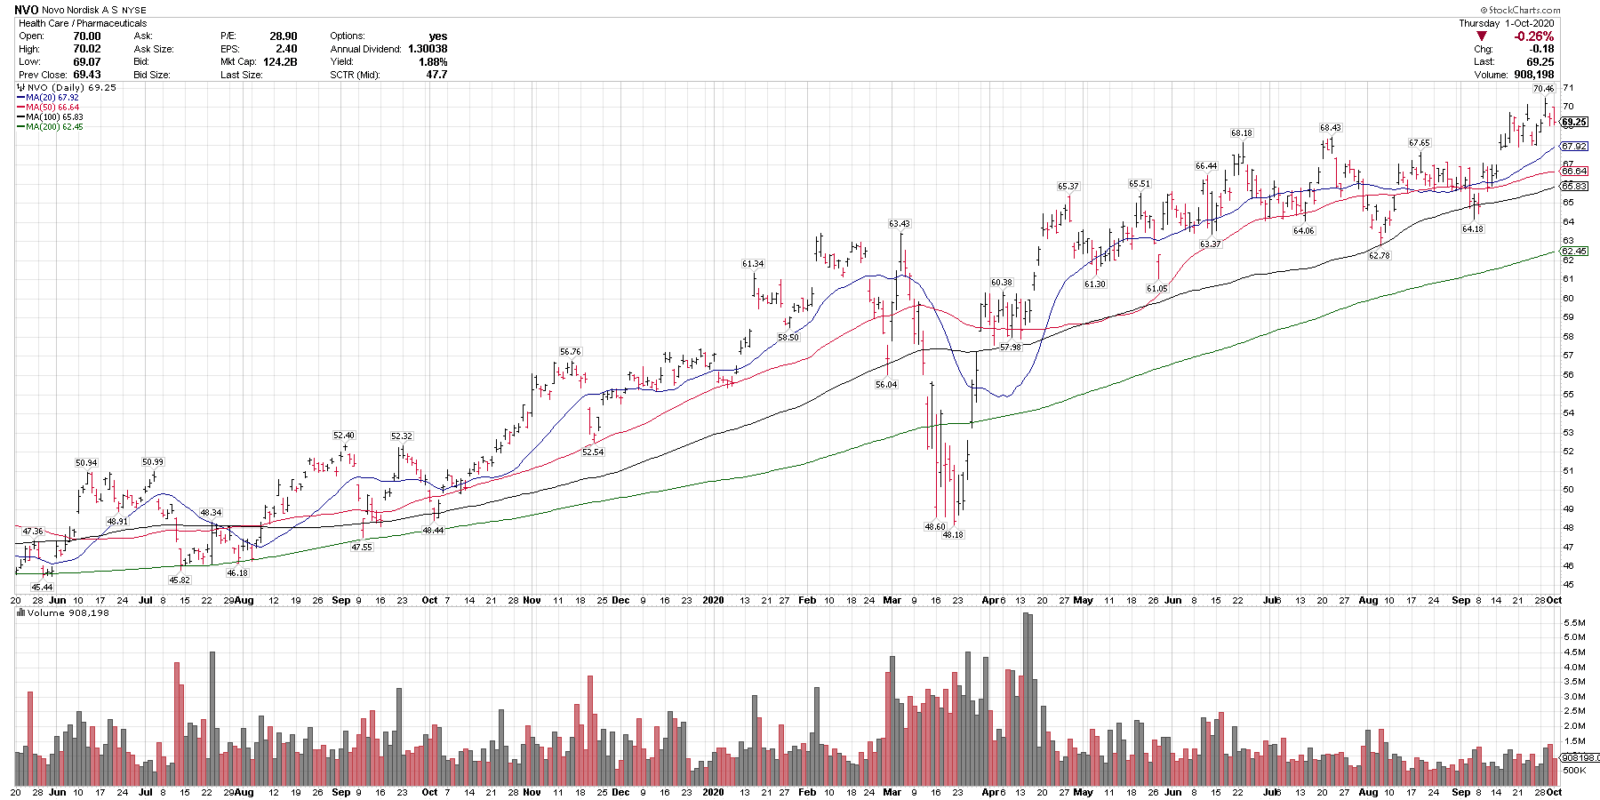
10/02/20
Novo Nordisk, NVO
Close: 69.25
Stop level: 60.94
NVO is in a technical uptrend above all key rising MAs, and is the highest ranked pharma name on our screen. The stop is below the rising 200-sma.
 10/01/20
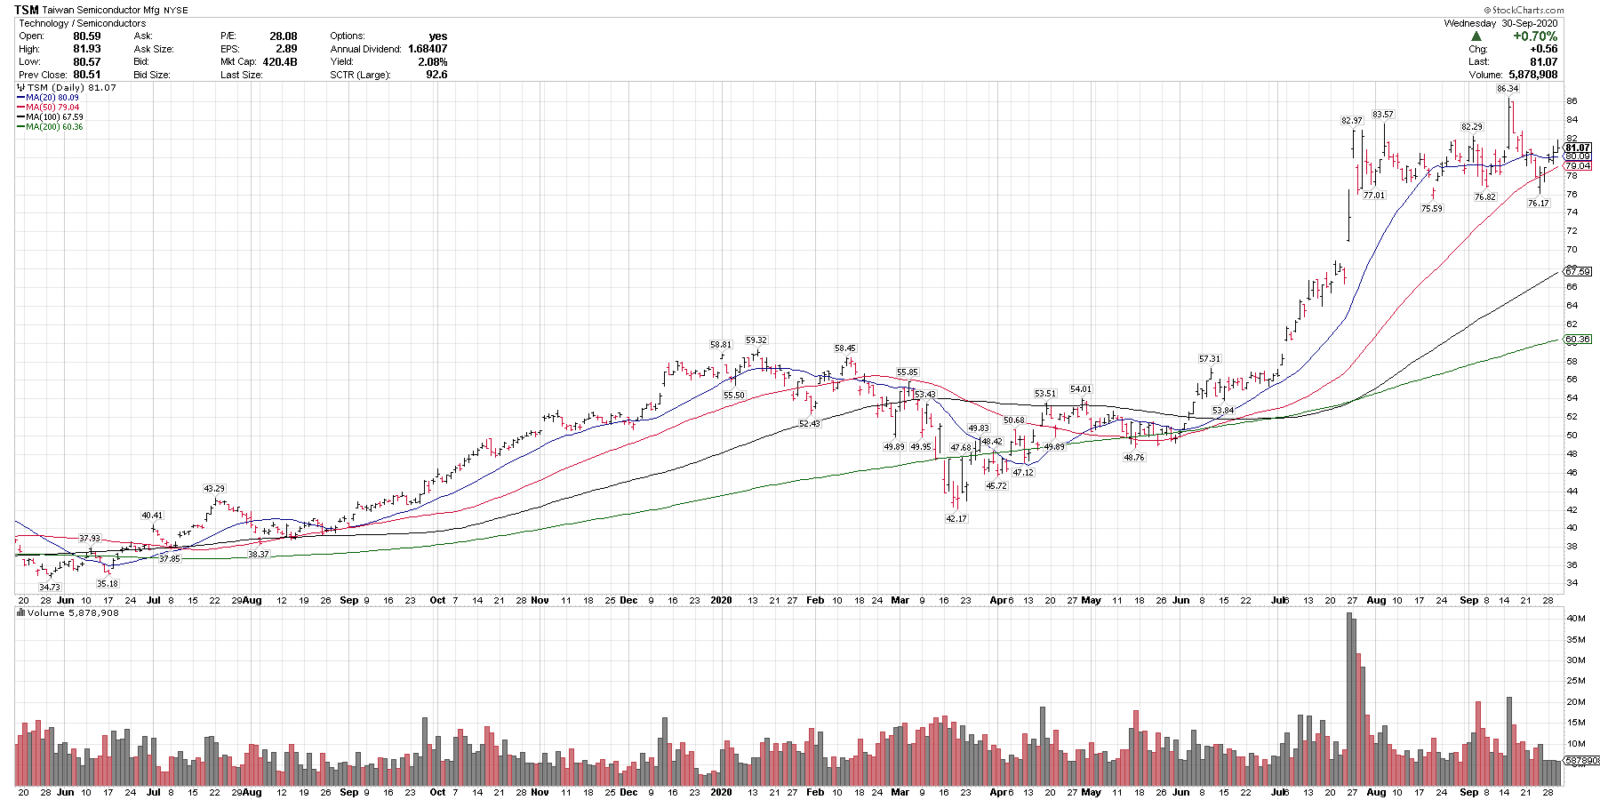
Taiwan Semiconductor, TSM
Close: 81.07
Pre-mkt: 81.90
Stop level: 68.88
TSM is in a technical uptrend above all key MAs and recently corrected 11.7% off all-time highs. $75-$76 is a key support level.
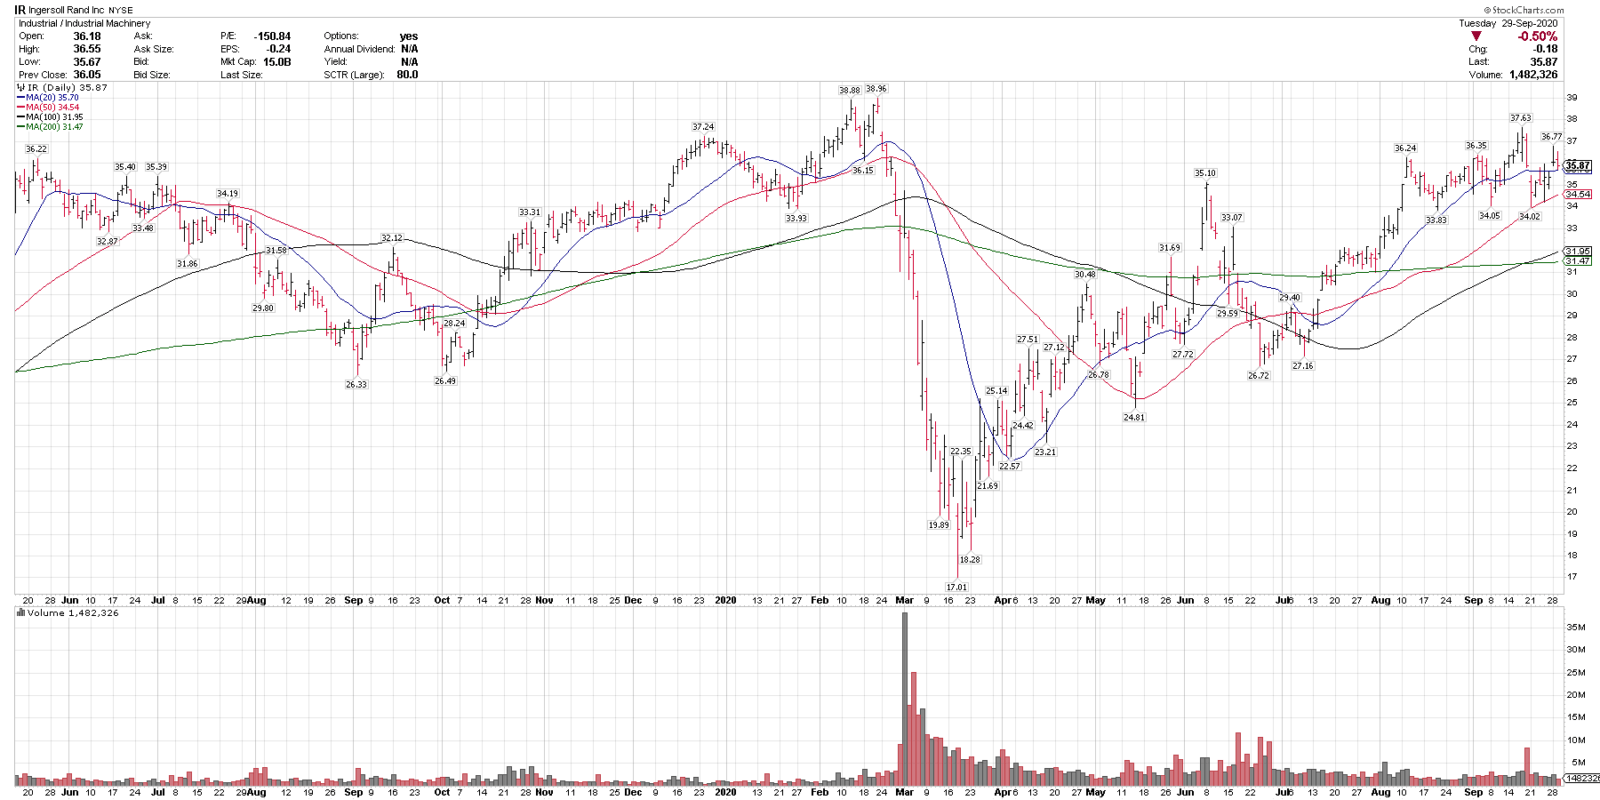
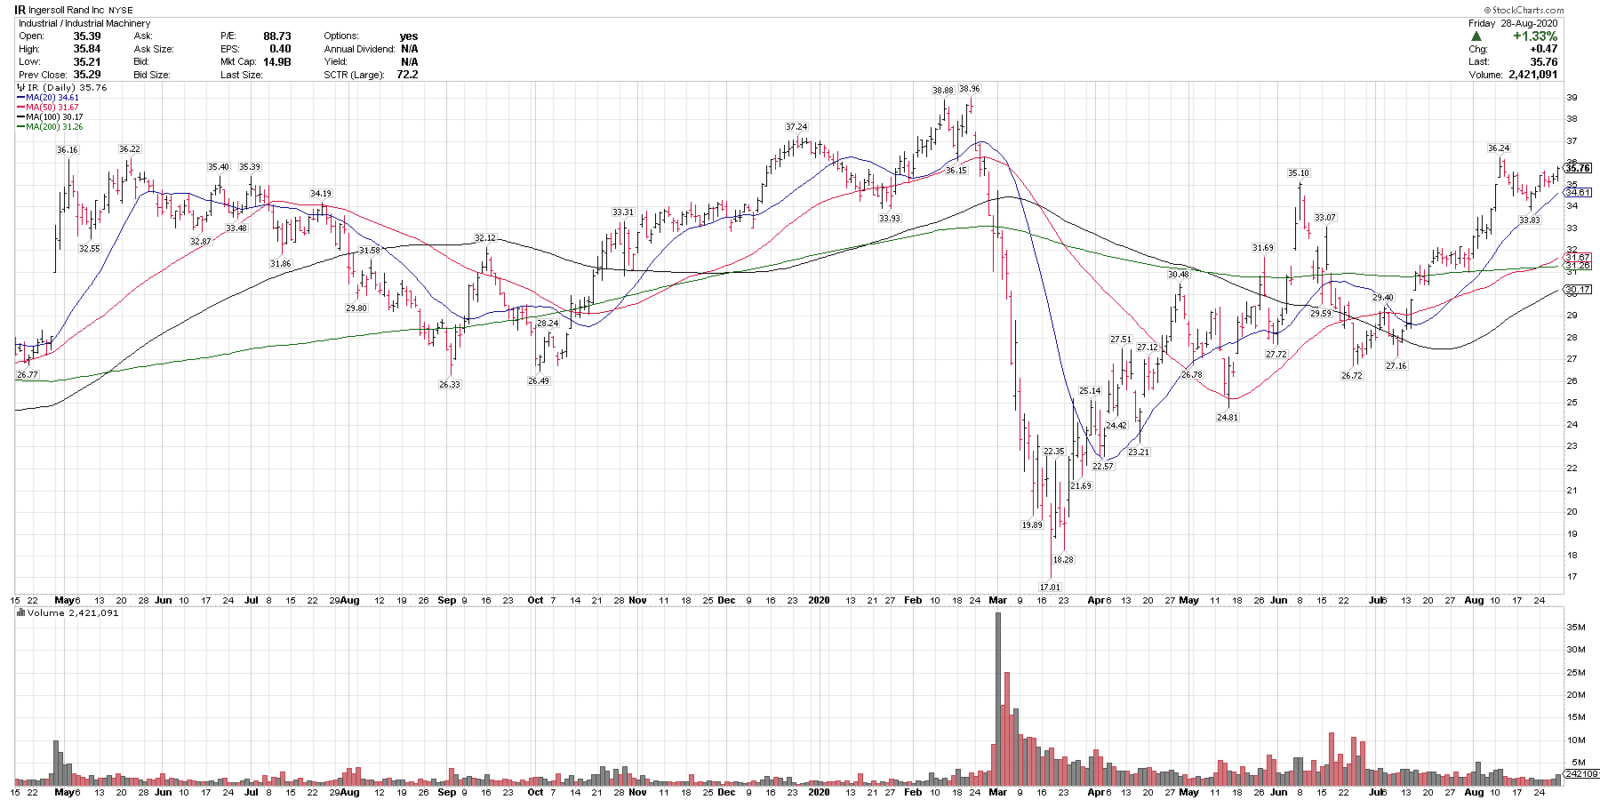
9/30/20
Ingersoll Rand, IR
Close: 35.87
Stop level: 30.48
IR is in a technical uptrend above all key rising MAs and recently corrected 9.5% into the rising 50-sma. $34 and the 50-sma are key support levels.
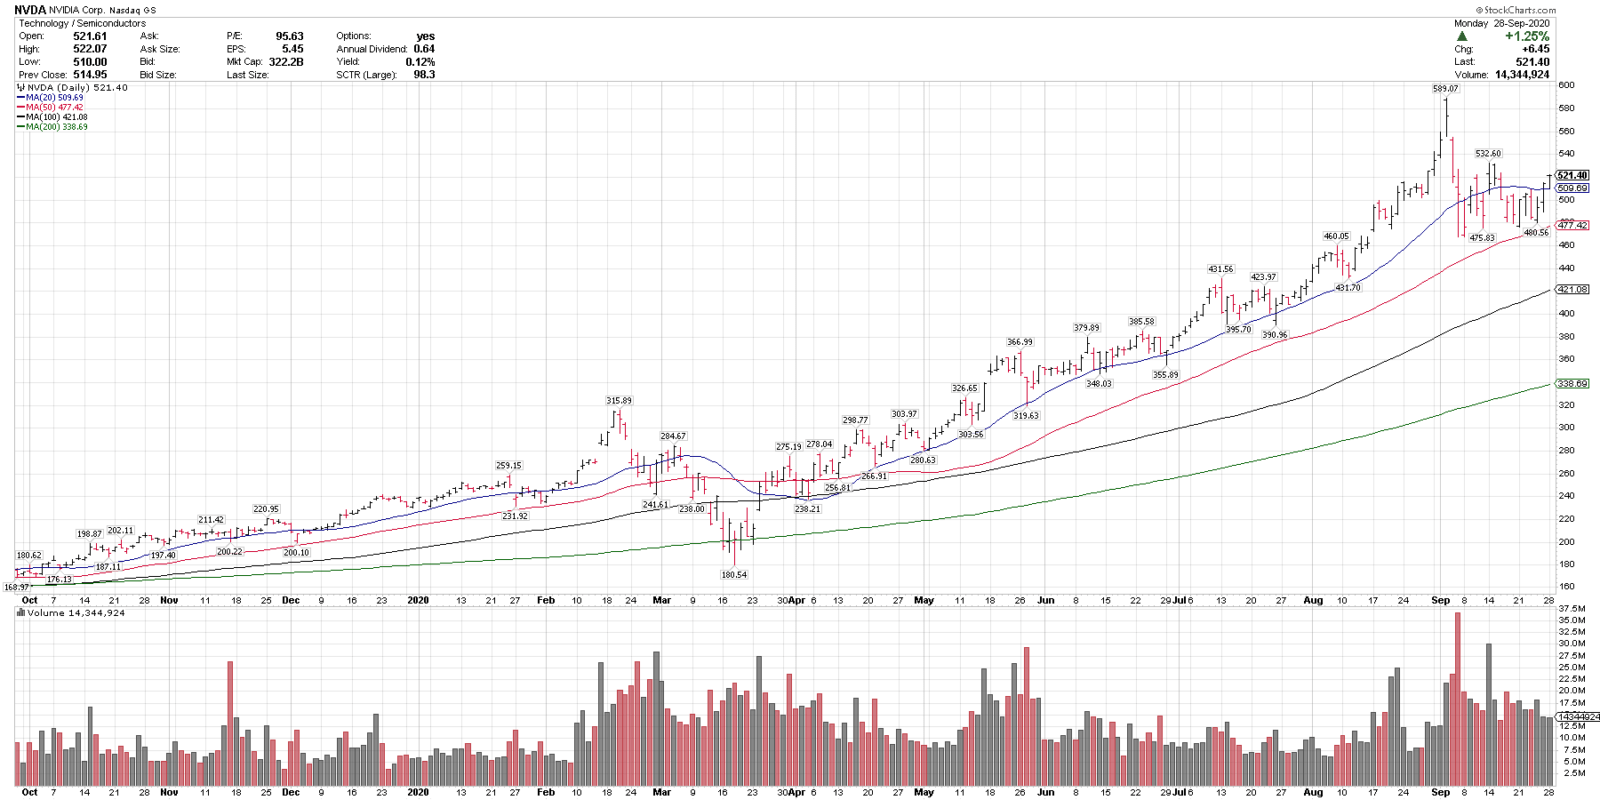
 9/29/20
Nvidia, NVDA
Close: 521.40
Pre-mkt: 519.56
Stop level: 443.19
NVDA is in a technical uptrend above all key rising MAs and recently corrected 19.2% off all-time highs. 460-475 & the rising 50-sma is key support below.
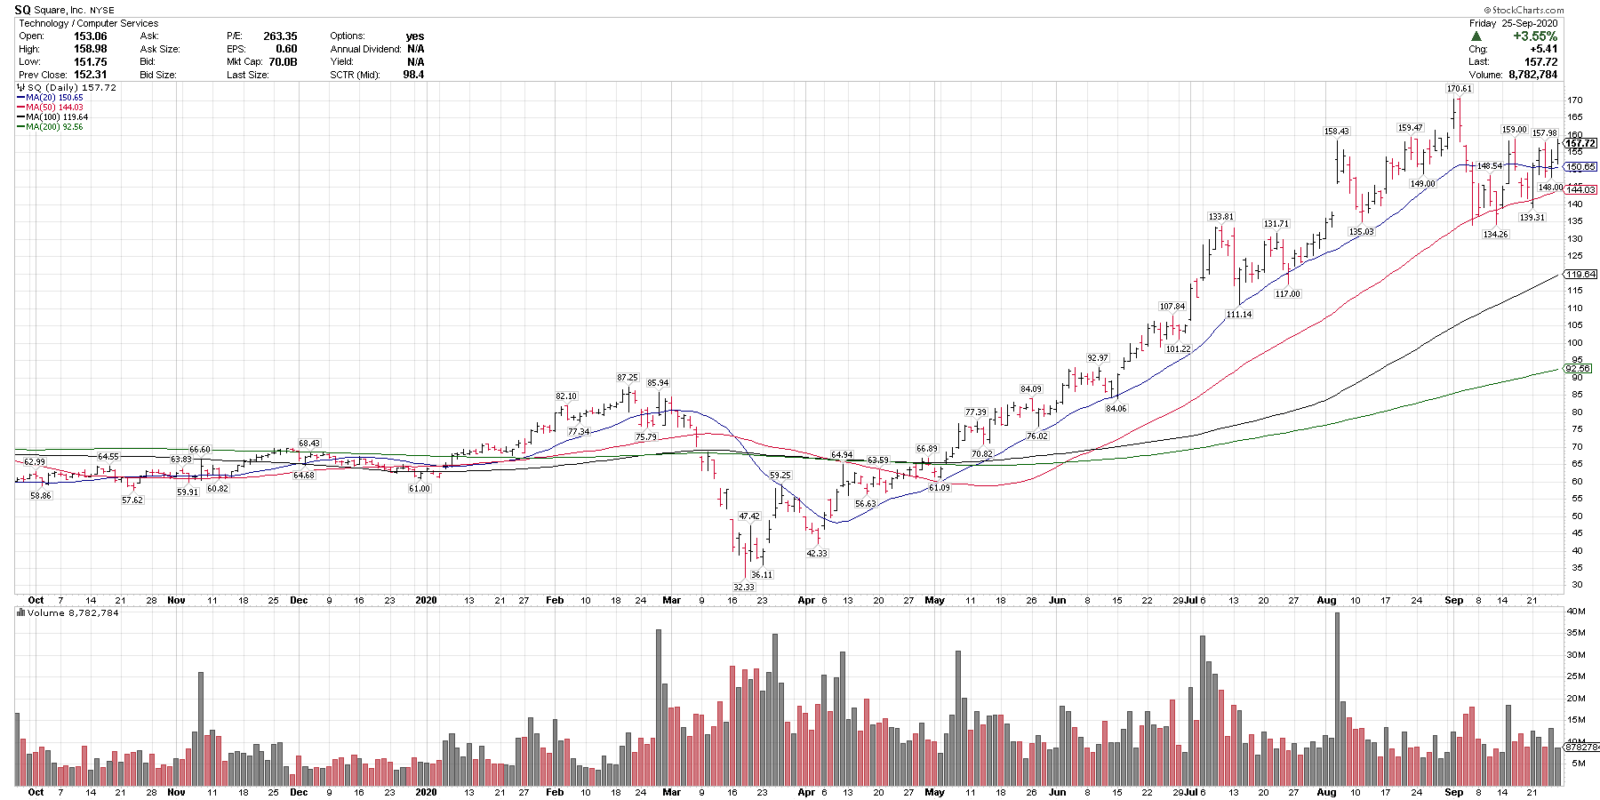
 9/28/20
Square, SQ
Close (when posted to Top 25 list): 157.72
Pre-mkt: 161.74
Stop level: 133.96
SQ is in a technical uptrend above all key rising MAs, made two higher lows, and is testing a higher high pre-market. 135-140 is key support. SQ is on the Weekly Top 25 list.
9/27/20
Blue Chip Daily Chart of the Week:
Sea Ltd., SE
Close: $155.29
Stop level for position traders and investors: $134.32
please see chart analysis below
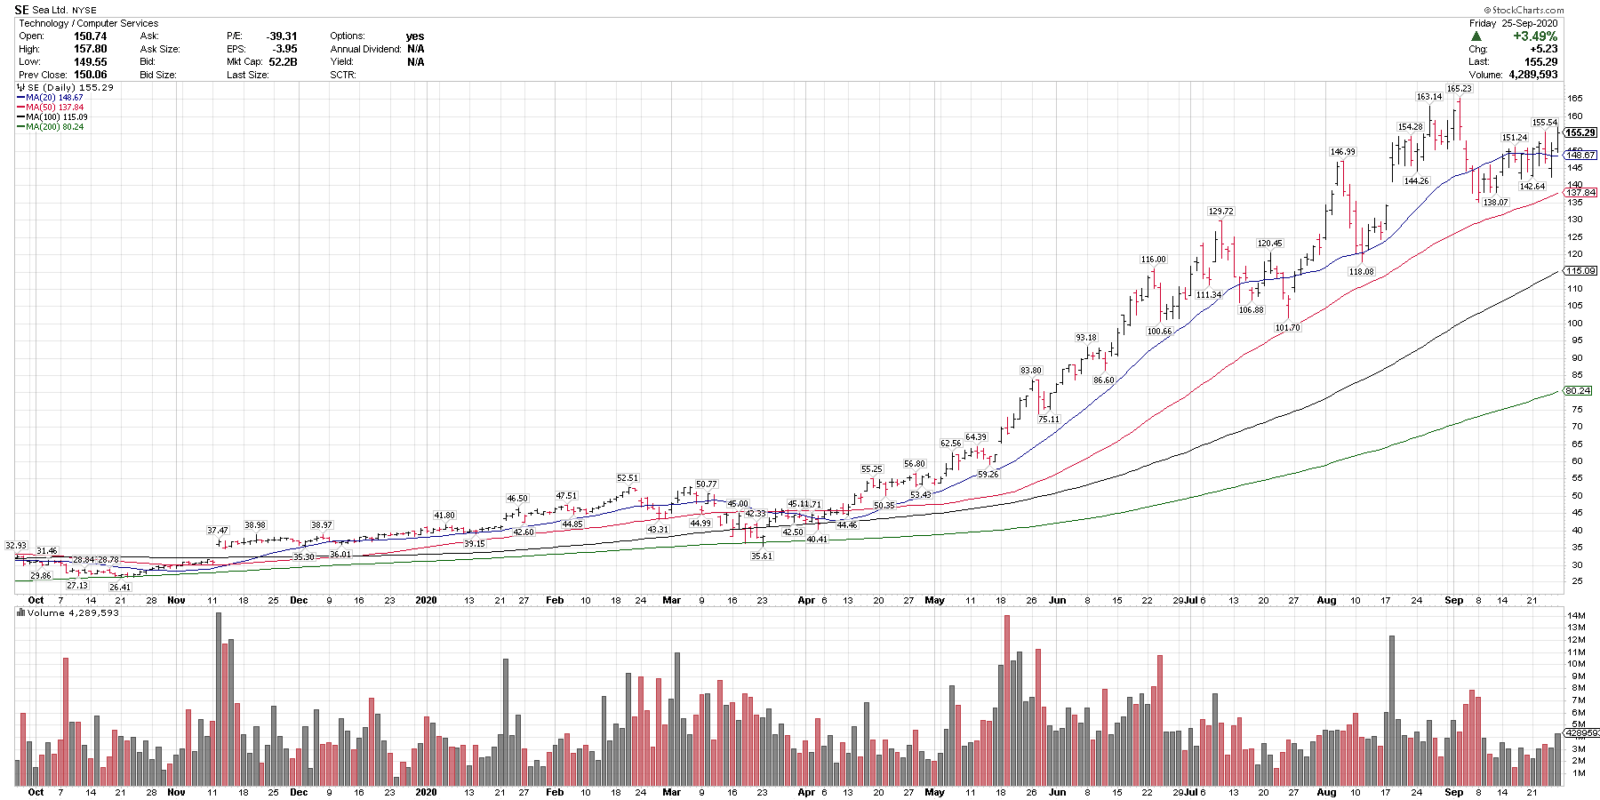
- Sea, (SE), is in a technical uptrend above the rising 20, 50, 100 & 200-sma, indicating an uptrend on multiple time frames.
- SE recently corrected 16.4% off all-time highs and held over the rising 50-sma.
- SE closed the week at an all-time weekly closing high, showing improving price momentum.
- The rising 50-sma is a key intermediate term trend gauge.
9/25/20
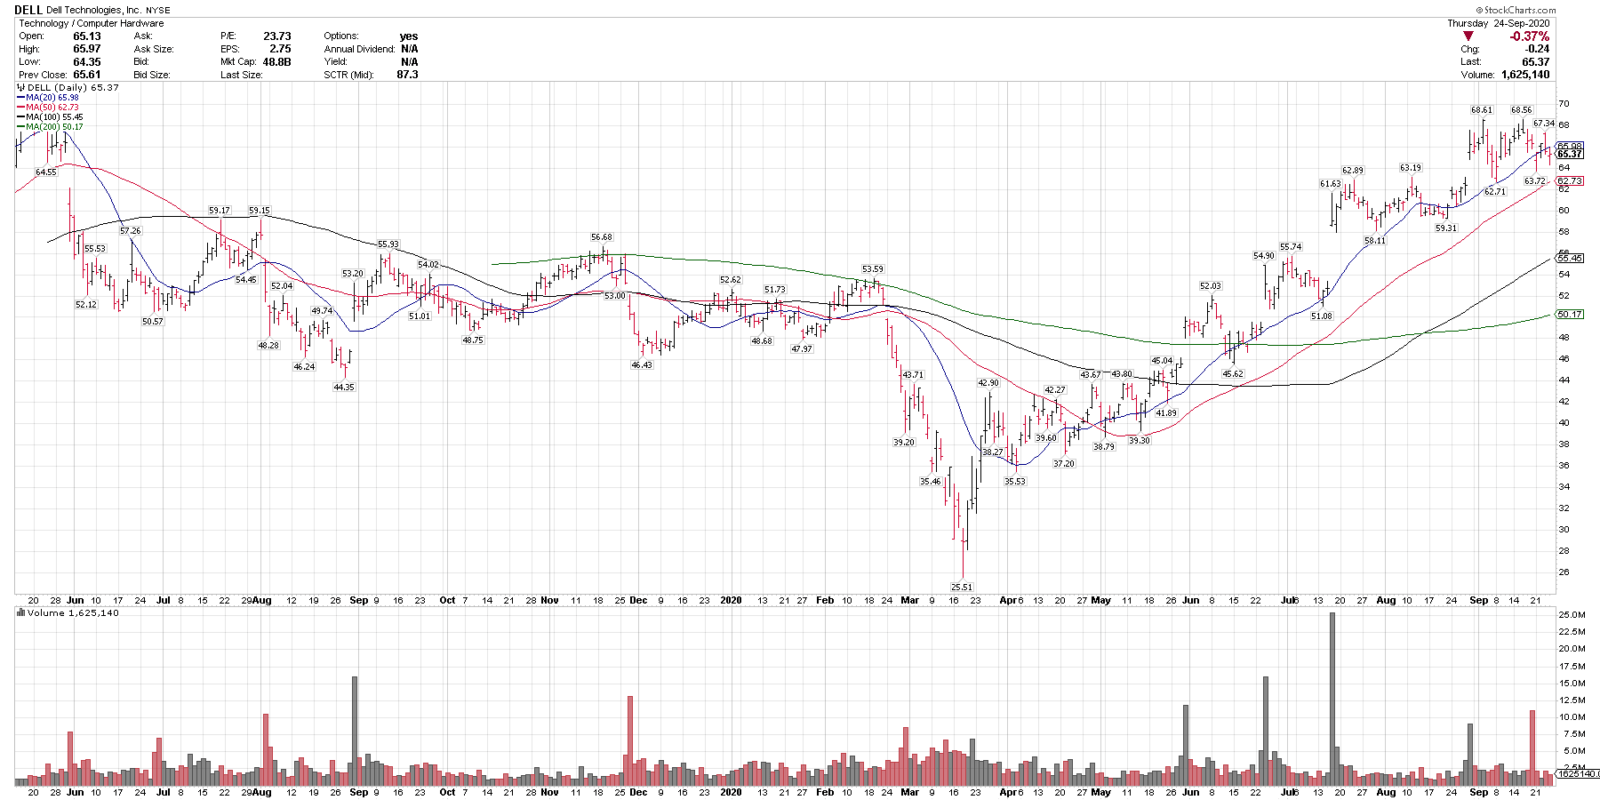
Dell Technologies, DELL
Close: 65.37
Stop level: 55.56
DELL is in a lower volatility uptrend above the rising 50, 100 & 200-sma and recently corrected 8.5% off 52 week highs. The rising 50-sma below is a key near term trend gauge.
 9/24/20
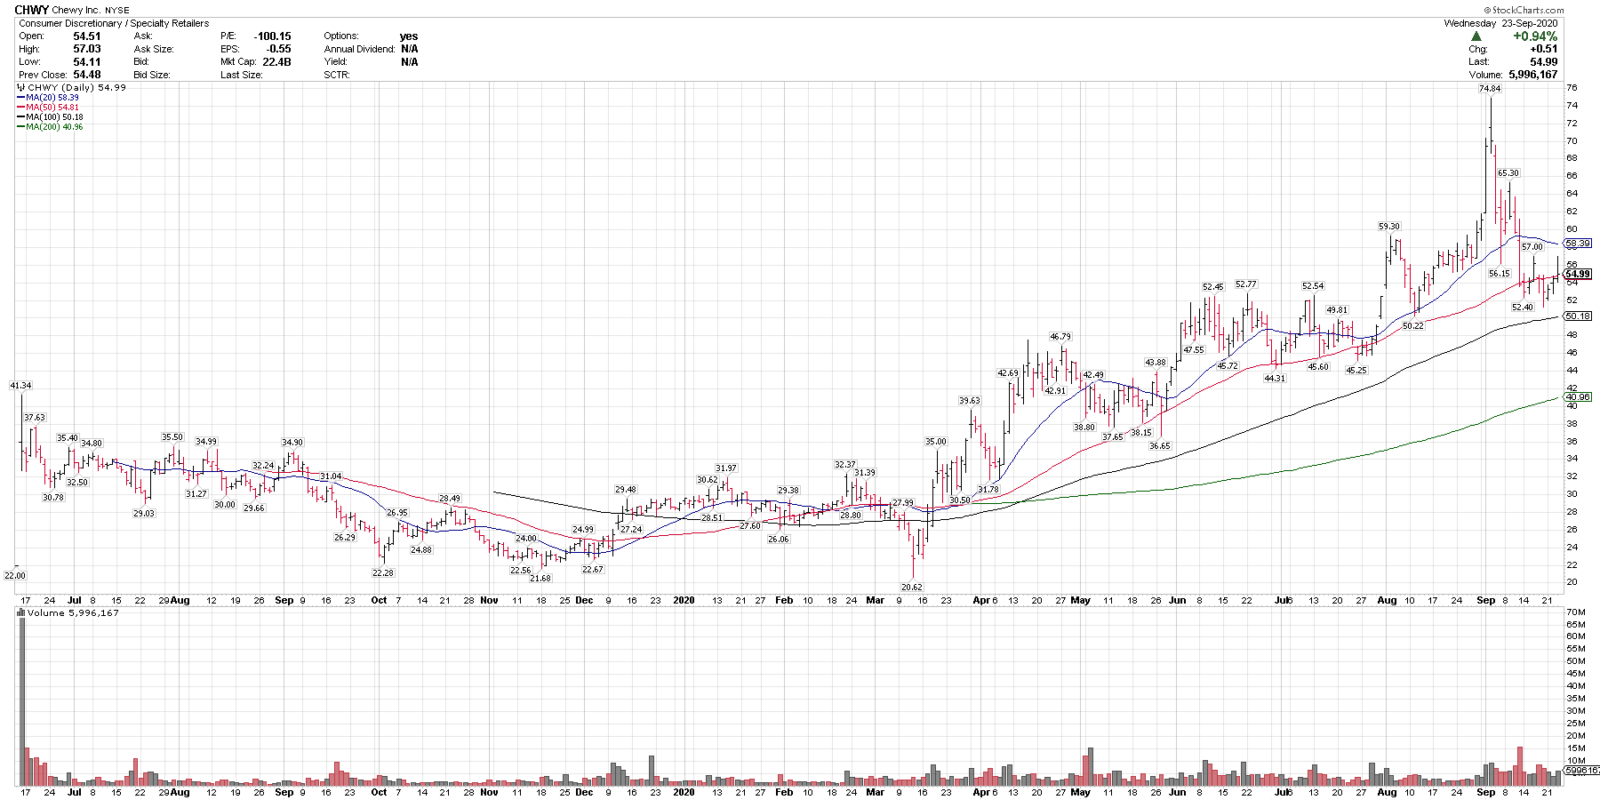
Chewy, CHWY
Close: 54.99
Stop level: 46.74
CHWY is in a technical uptrend above the rising 50, 100 & 200sma. It recently corrected 31.5% off all time highs, has price support between 48-52 and is up on the week, showing improving relative strength.
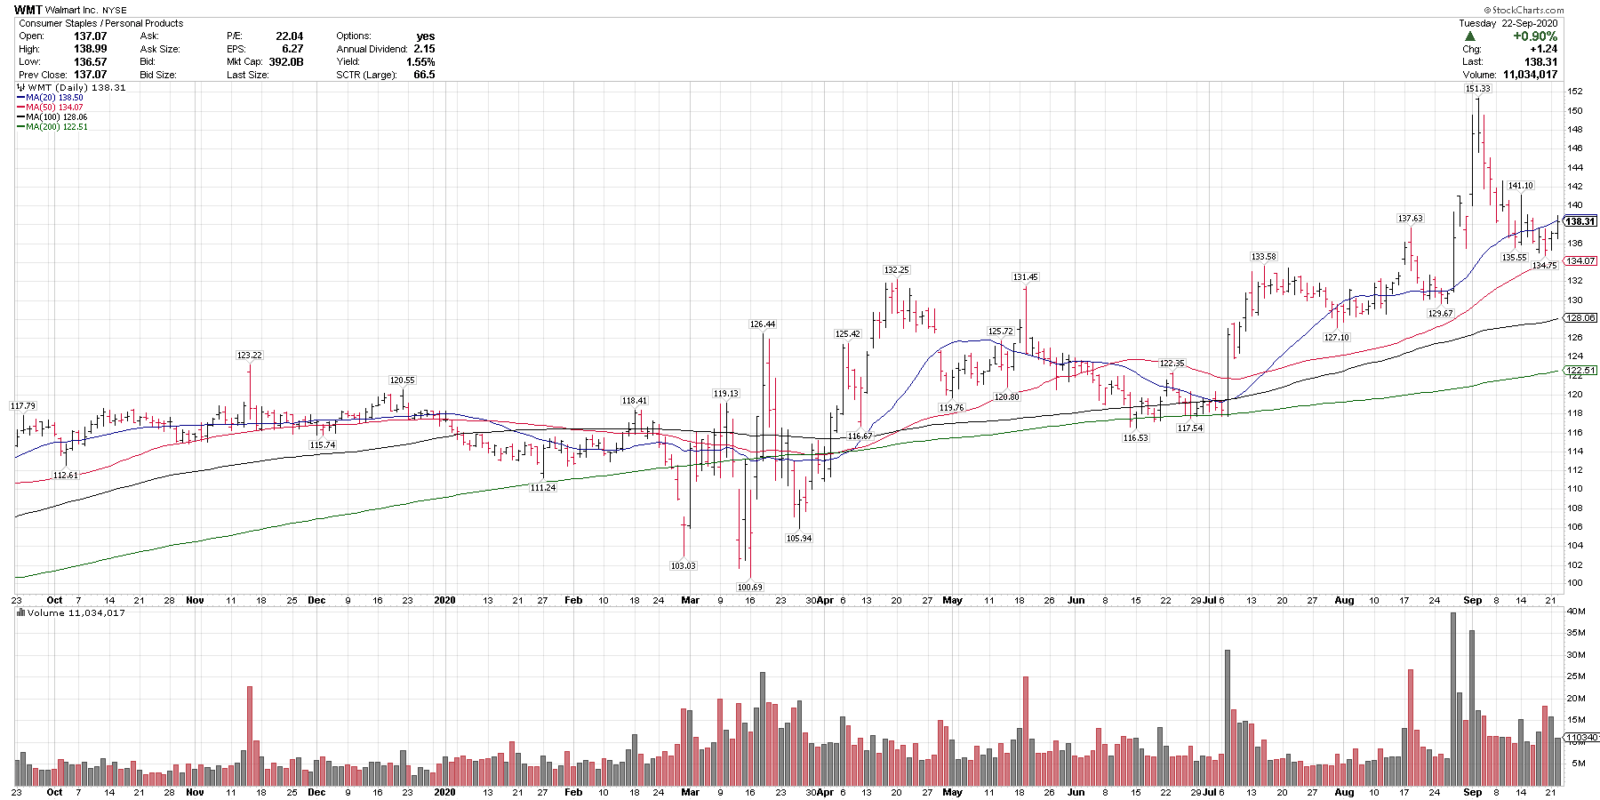
9/23/20
Walmart, WMT
Close: 138.31
Pre-mkt: 138.75
Stop level: 121.71
WMT is in a technical uptrend above the rising 50, 100 & 200-sma and recently corrected 10.9% off all-time highs into it’s breakout range and rising 50-sma.
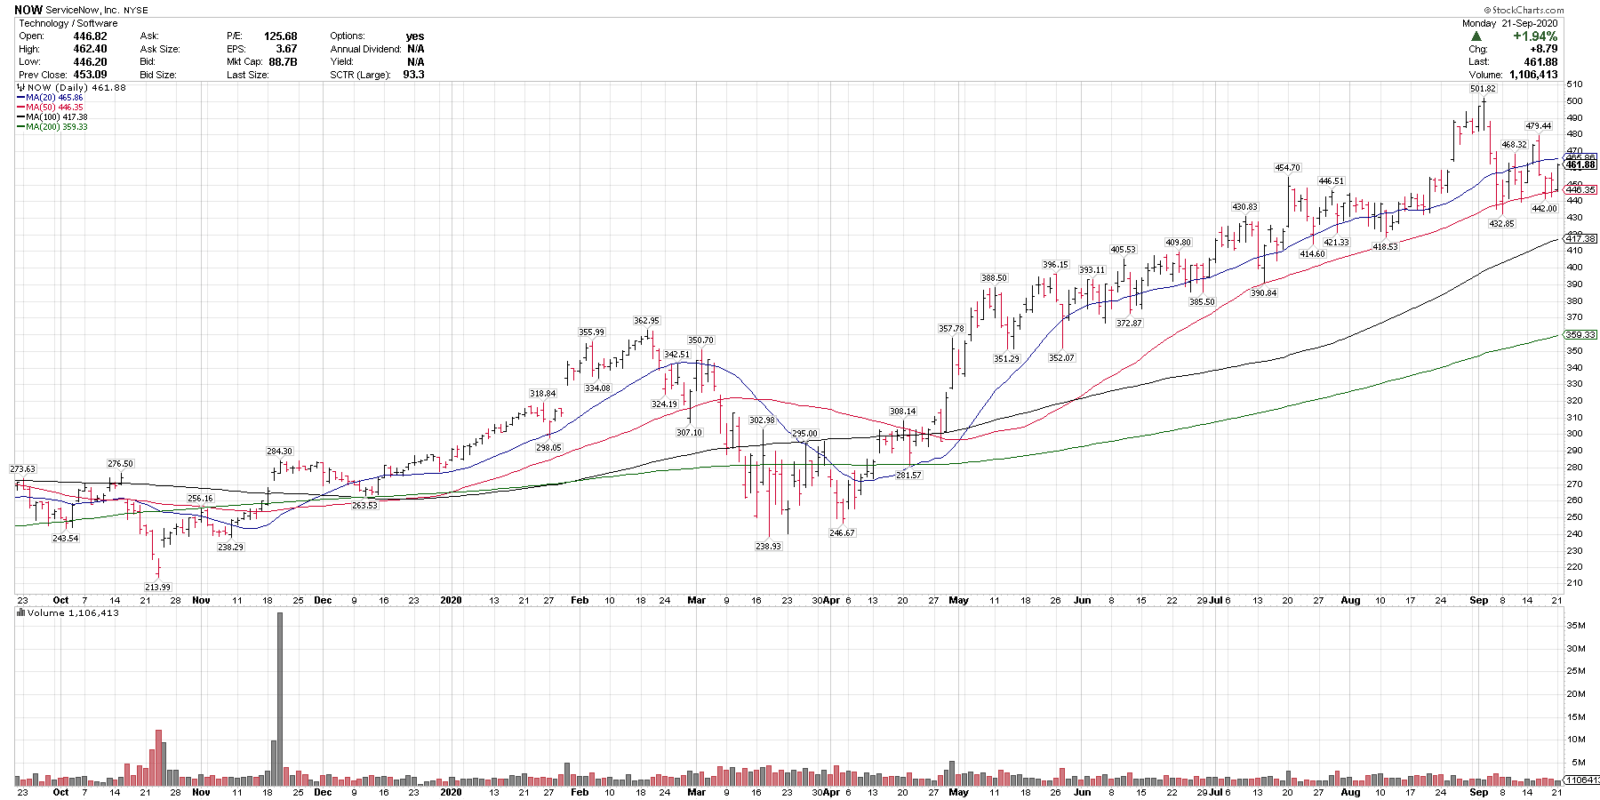
 9/22/20
Close: 461.88
Pre-mkt: 464.40 (+.55%)
Stop level: 392.59
NOW is in a technical uptrend above the rising 50, 100 & 200-sma and recently corrected 13.7% off all time highs into the rising 50-sma.
 9/21/20
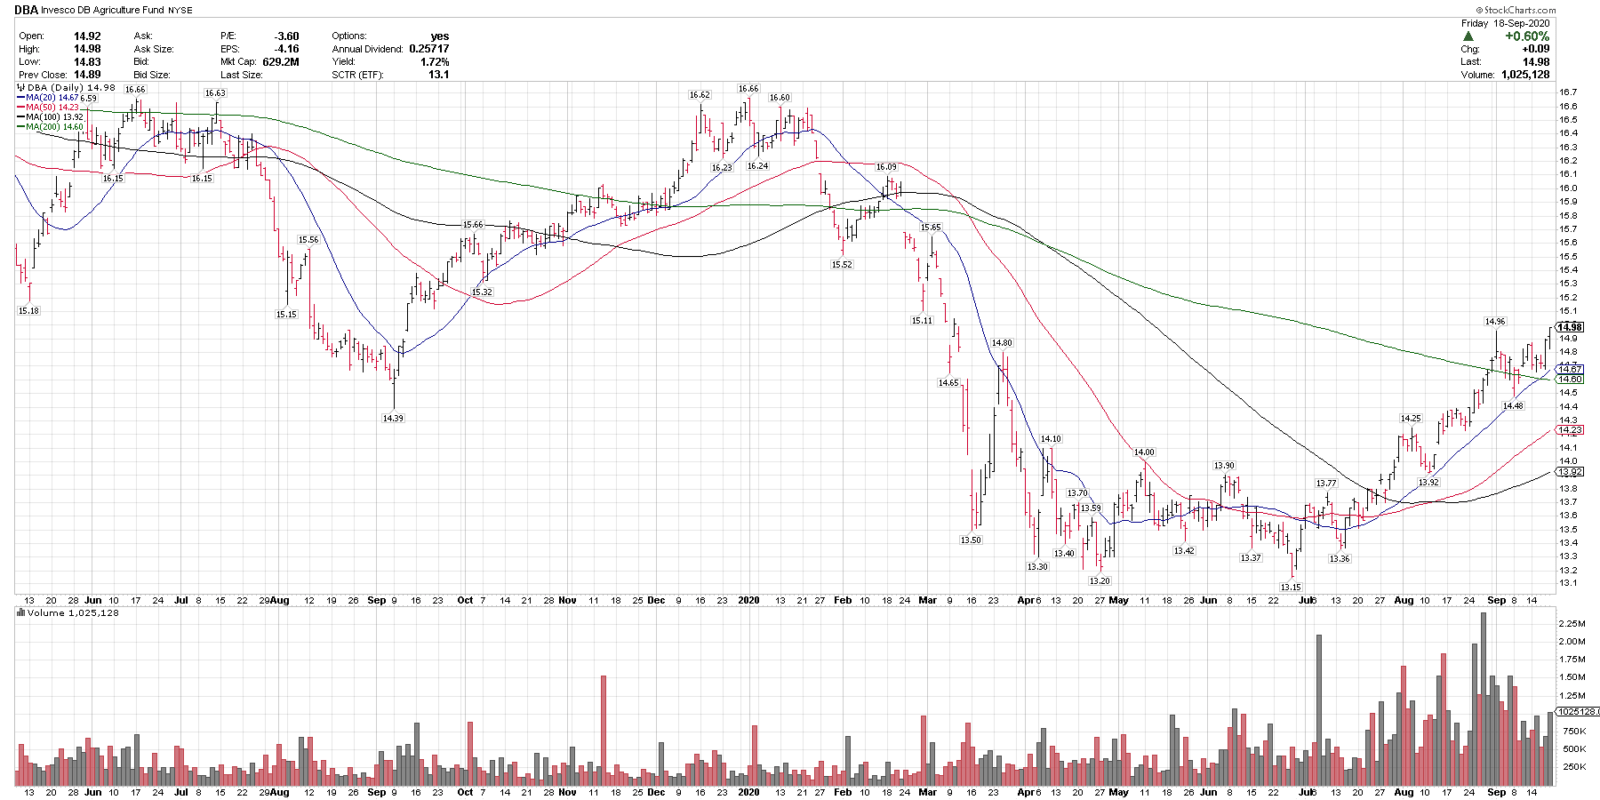
Invesco DB Agriculture Fund, DBA
Close: 14.98
Stop level: 13.47
DBA is in an uptrend over the rising 20, 50 and 100-sma testing 6-month highs and recently closed back over the 200-sma, on increasing volume. DBA is a lower volatility ETF which could be uncorrelated to equity markets.
 9/20/20Blue Chip Daily Chart of the Week:
HONEYWELL, HON
Close: $168.70
Stop level for position traders and investors: $148.45
please see chart analysis below
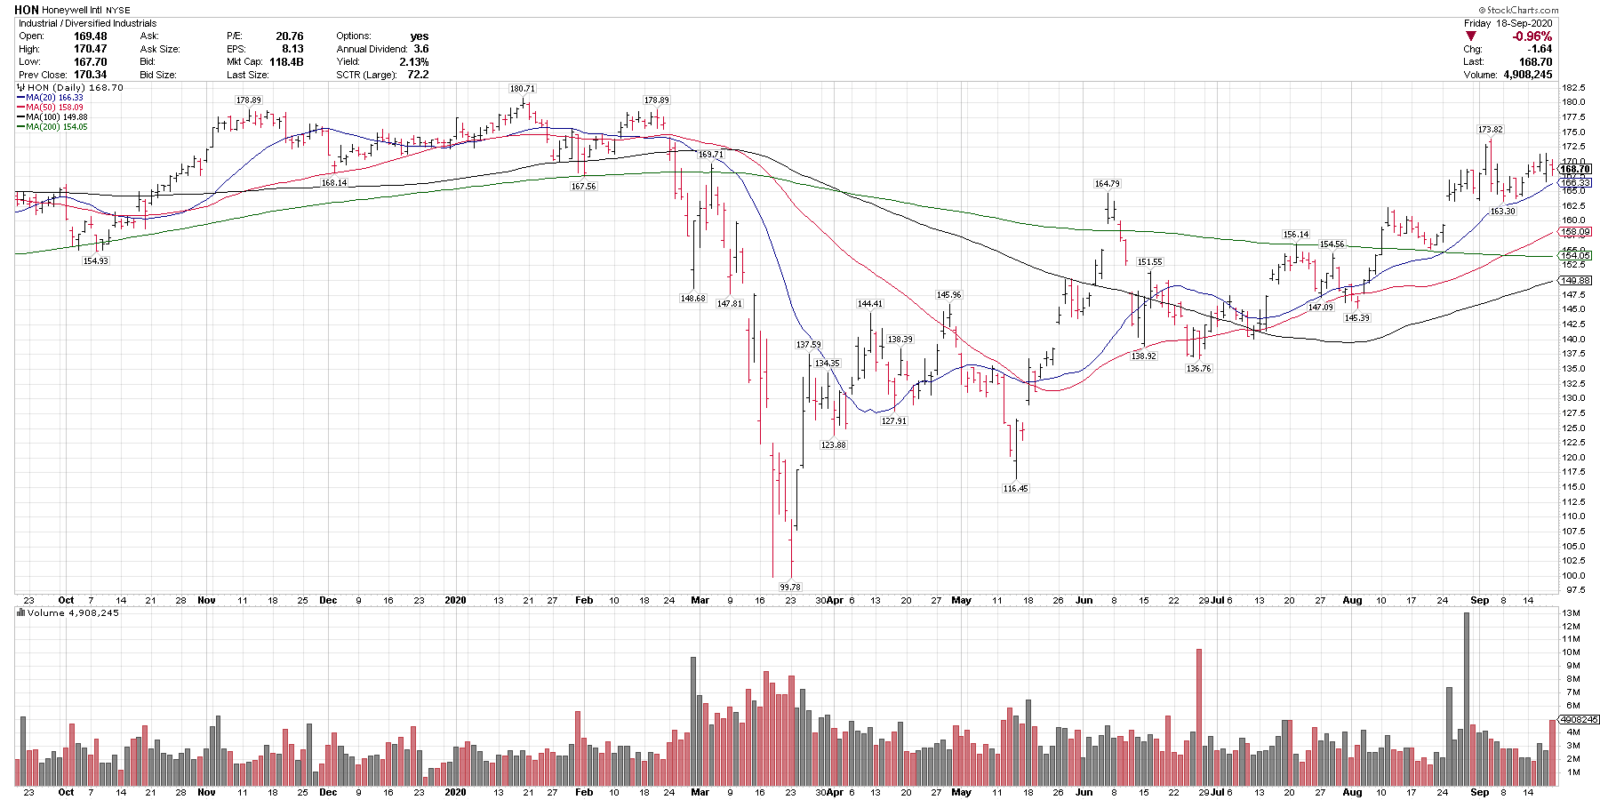
- Honeywell (HON) is in a technical uptrend above the rising 20, 50, and 100 200-sma, and also the 200-sma, indicating an uptrend on multiple time frames.
- HON recently corrected 6% off of 6-month highs into the rising 20-sma.
- HON was up on the week and on the month vs $SPX which is down, showing improving relative strength.
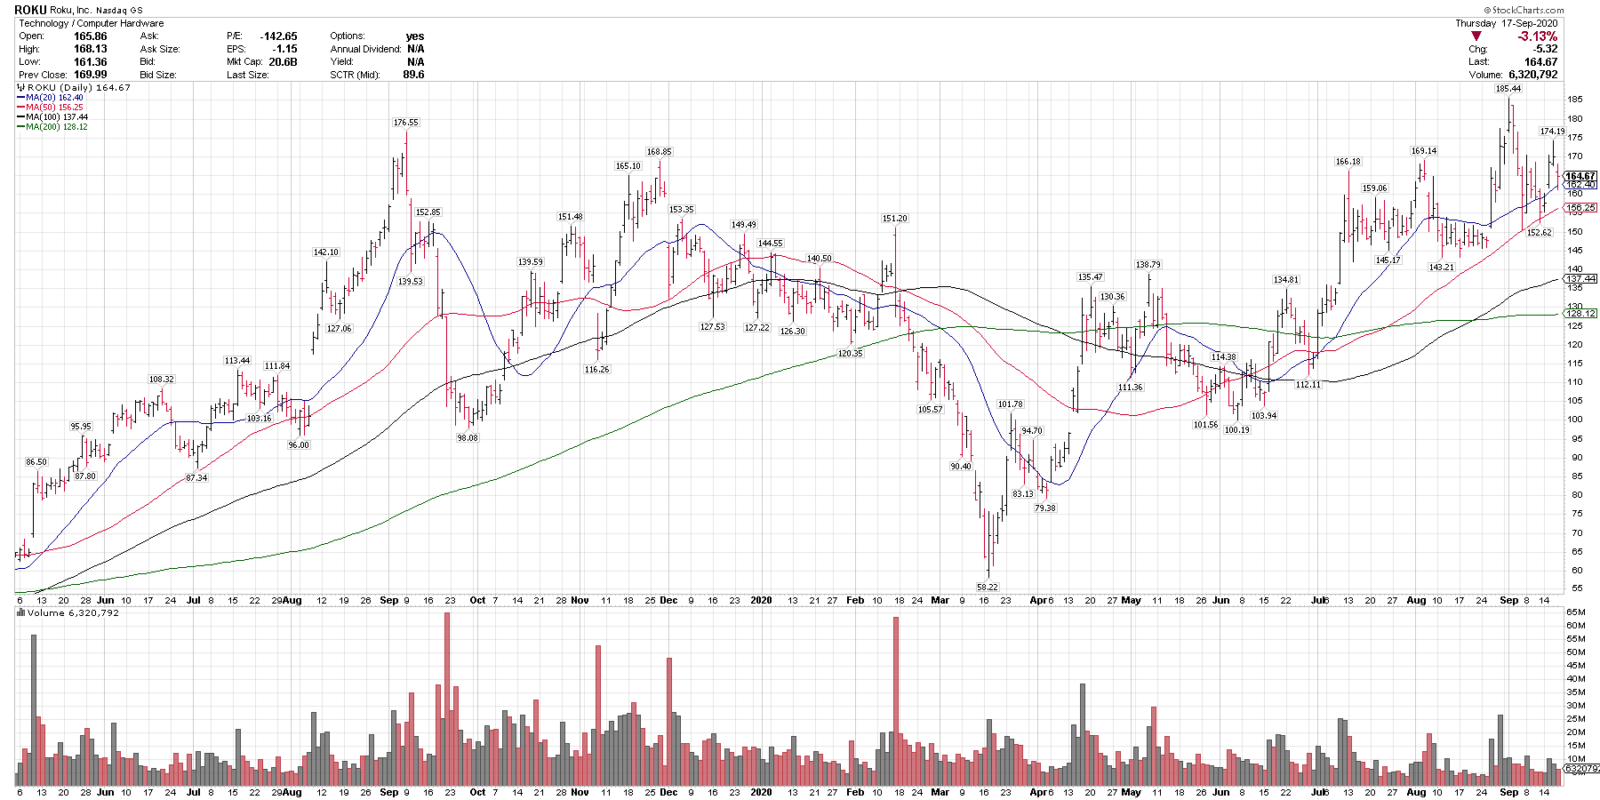
9/18/20
Roku, ROKU
Close: 164.67
Pre-mkt: 165.60
Stop level: 139.96
ROKU is in a technical uptrend above all key rising MA’s and recently corrected 17.6% off all-time highs into the rising 50-sma. The rising 50-sma and $145 are support levels on any pullbacks.
 9/17/20
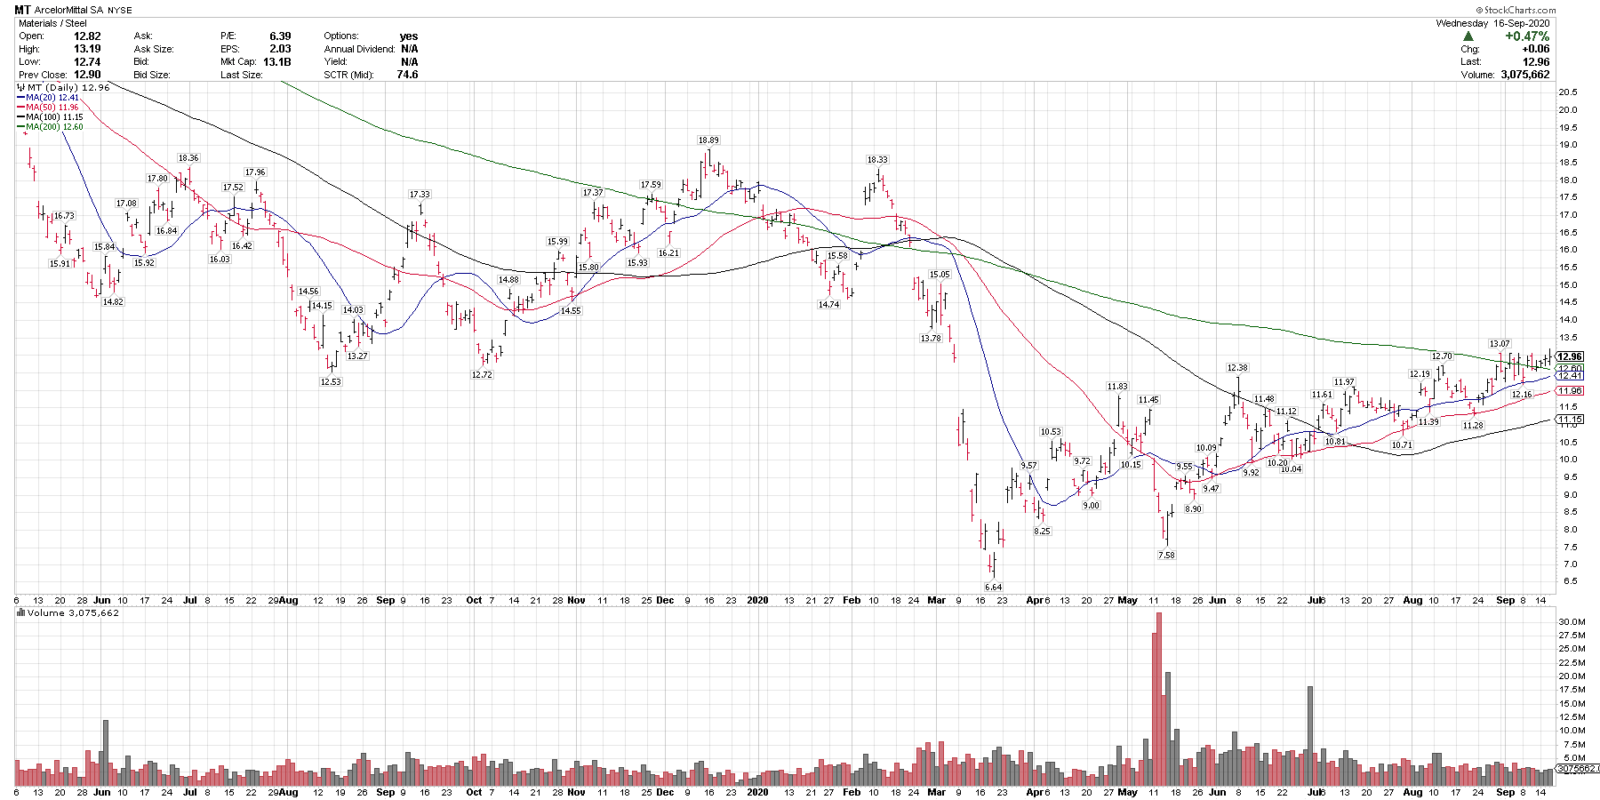
ArcelorMittal, MT
Close: 12.96
Pre-market: 13.34
Stop level: 10.96
MT is in a technical uptrend above rising 20, 50 & 100-sma and over the 200-sma as well. MT could be volatile with the market and was covered in last night’s video.
9/16/20
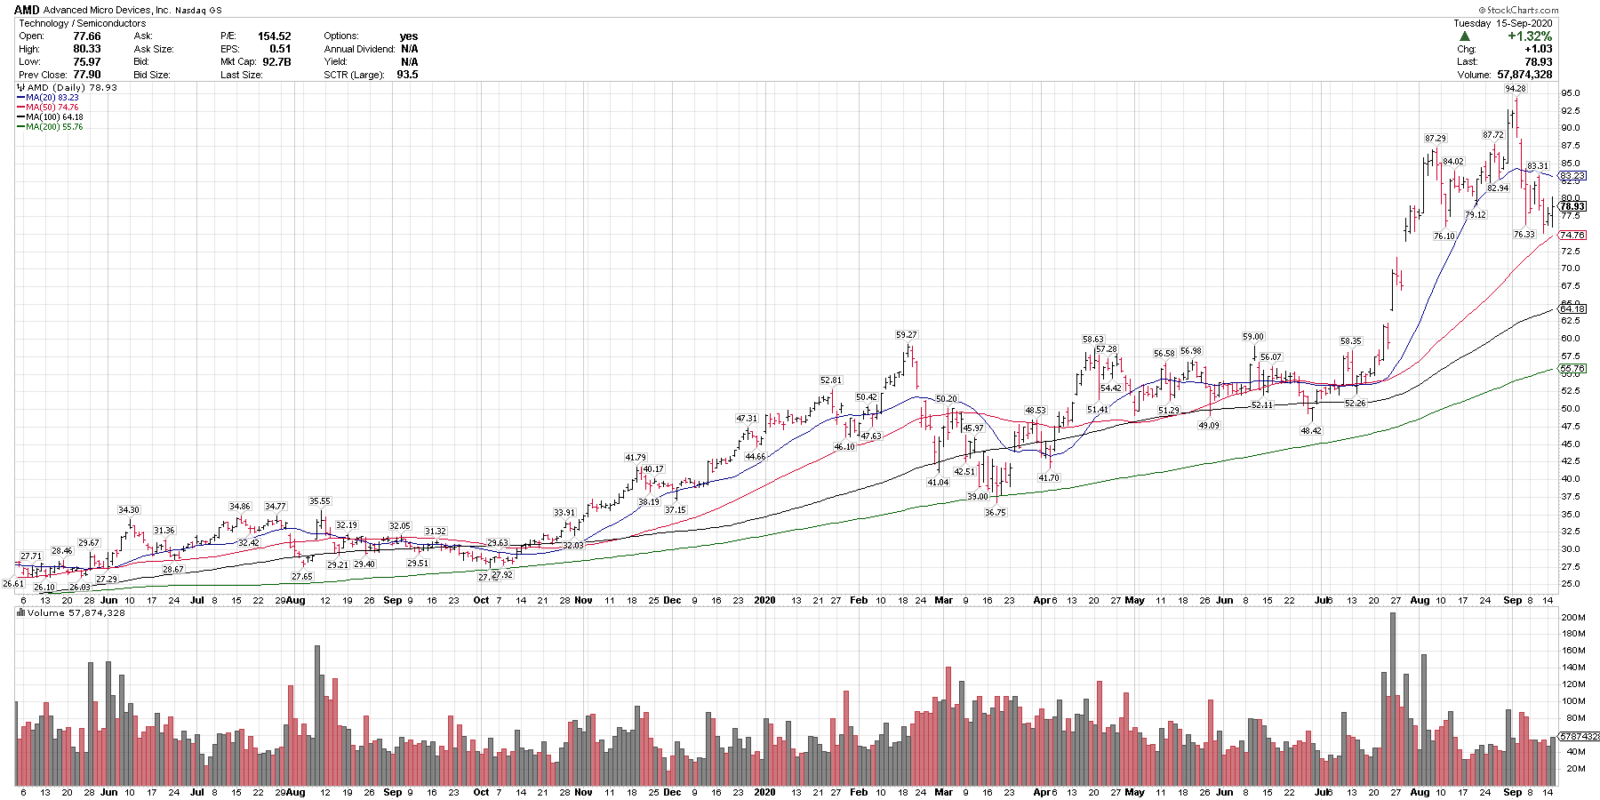
Advanced Micro Devices, AMD
Close: 78.93
Pre-mkt: 79.25
Stop level: 68.66
AMD is in a technical uptrend above the rising 50, 100 & 200-sma and recently corrected 20.4% off all-time highs. The rising 50-sma below near $75 is a key near term support level.
 9/15/20
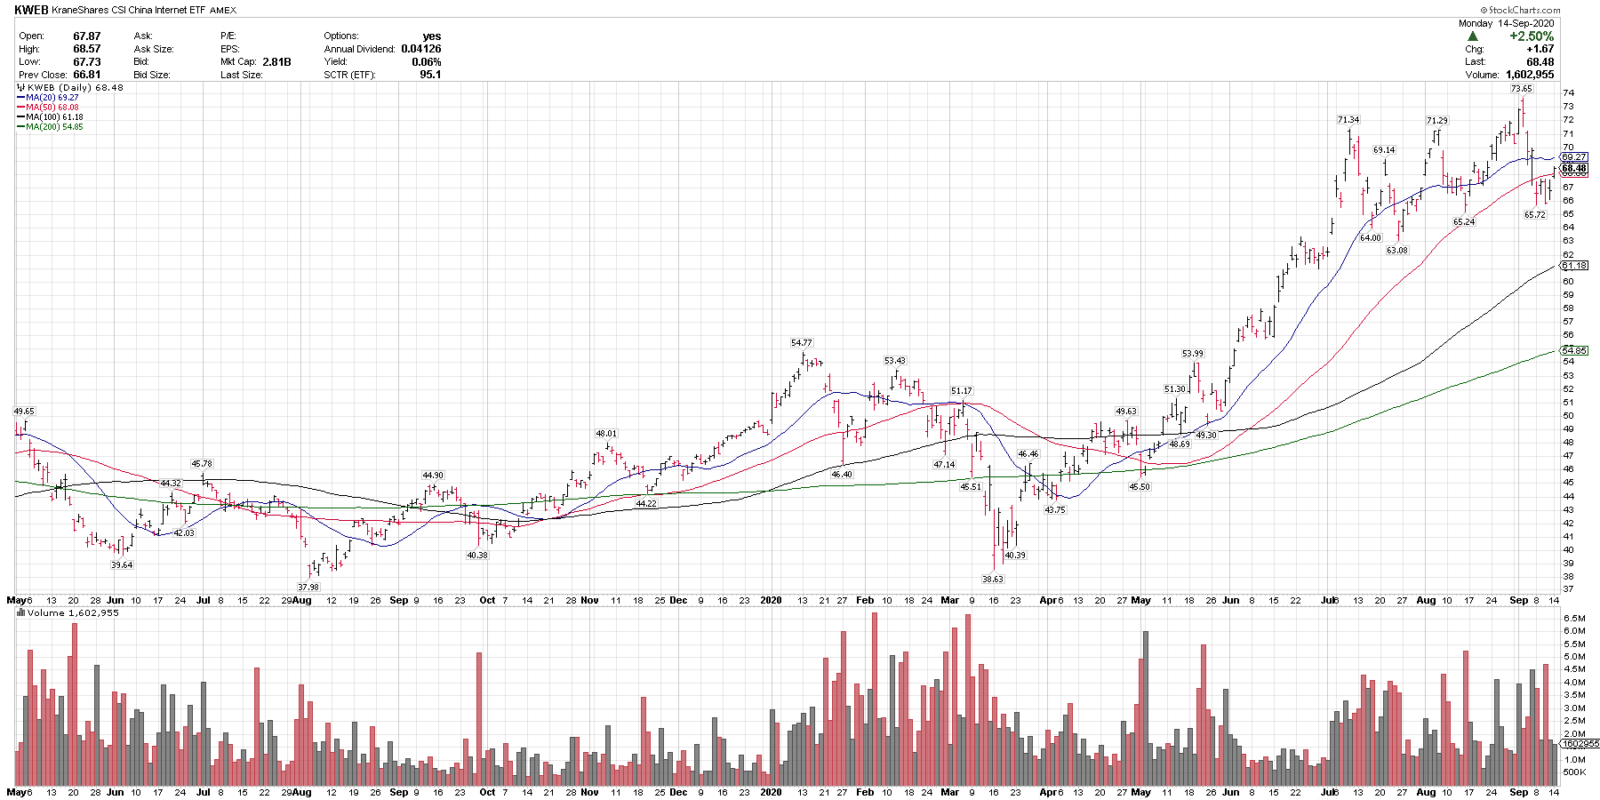
KraneShares China Internet ETF, KWEB
Close: 68.48
Stop level: 60.46
KWEB is in a technical uptrend above the rising 50, 100 and 200-sma and recently corrected 10.7% off all-time highs. BABA, JD and TCEHY are top ranked stocks in this group. 65 and 63 are key near-term support levels.
 9/14/20
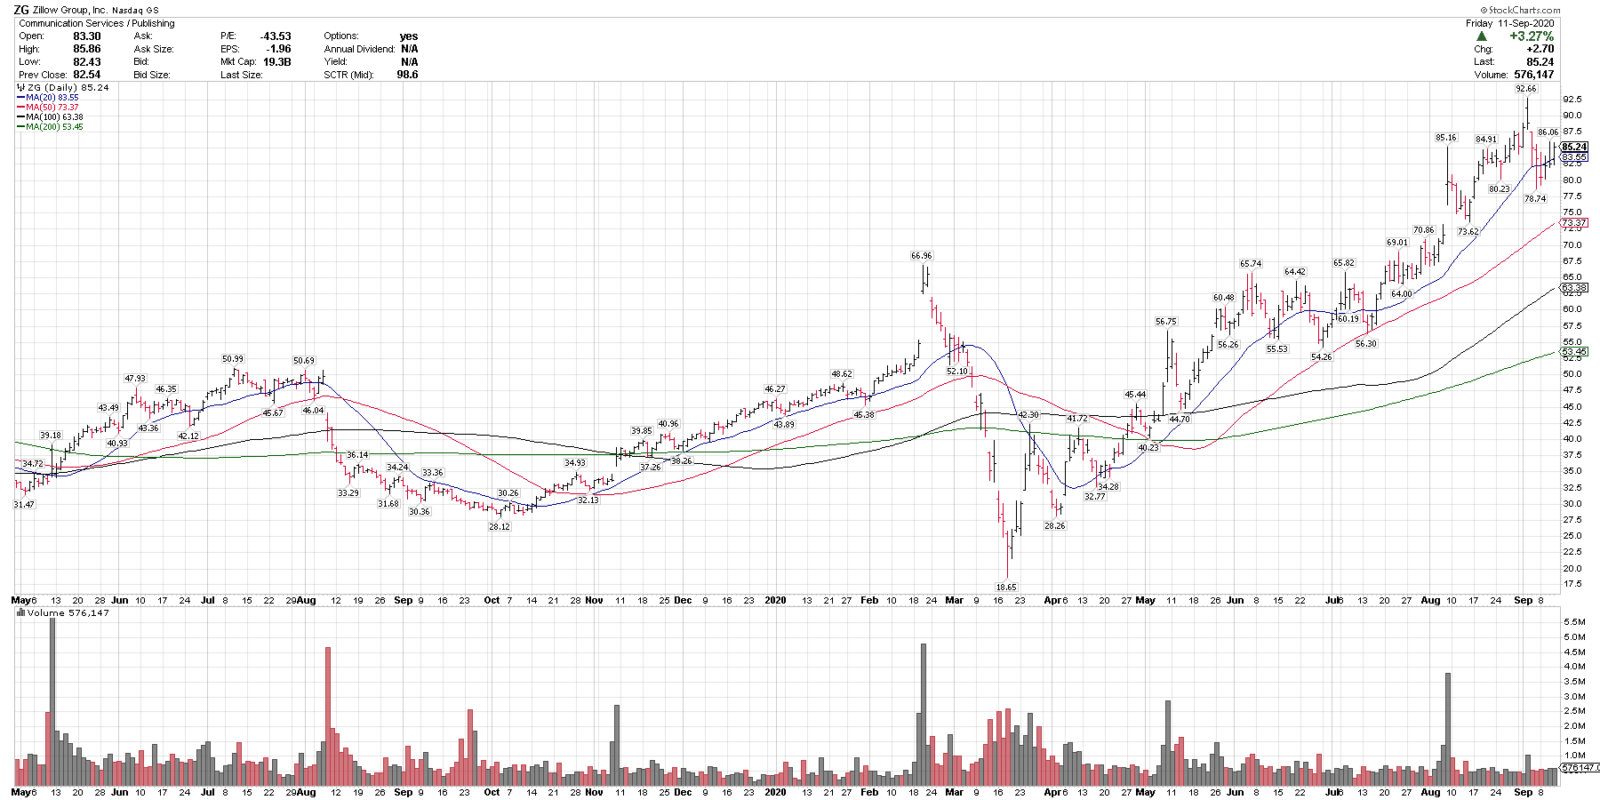
Zillow Group, ZG
Close: 85.24
Pre-mkt: 86.00
Stop level: 72.46
ZG is in a technical uptrend above all key rising MAs and recently pulled back 15% off all-time highs. $80 is near term support & then the rising 50-sma.
 9/13/20Blue Chip Daily Chart of the Week:
DR HORTON, DHI
Close: $71.39
Stop level for position traders and investors: $62.72
please see chart analysis below
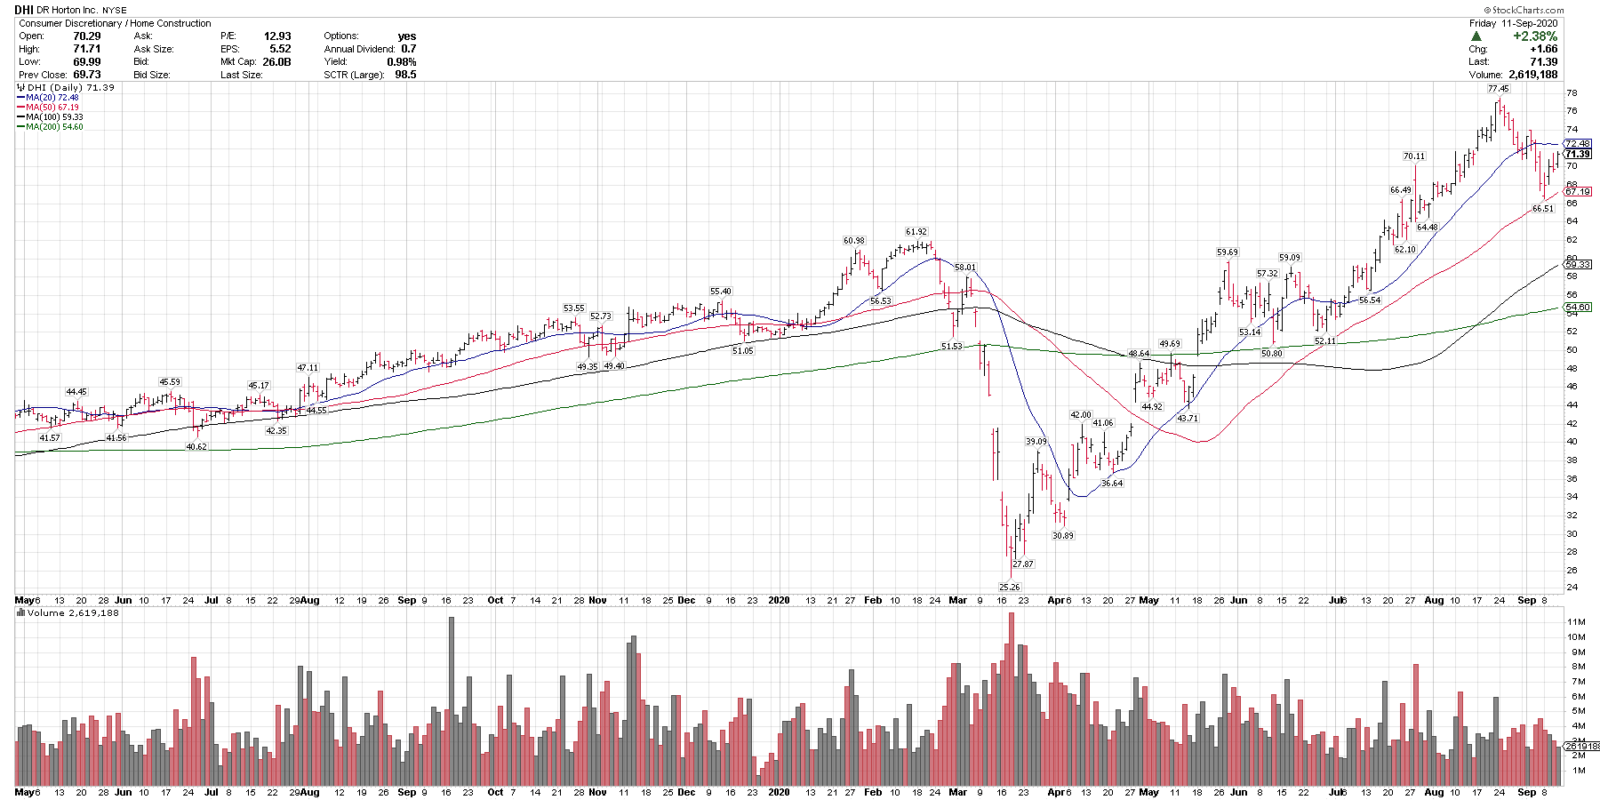
- DHI is in a technical uptrend, above the rising 50, 100 and 200-day moving averages, indicating an uptrend on multiple time frames.
- DHI recently corrected 14.1% off all time highs and held the rising 50-sma test, a bullish signal.
- The rising 50-sma below is a key trend gauge.
- DHI was +4.63% on the week, vs $SPX at -2.51% for the week, showing improving relative strength in a weaker market.
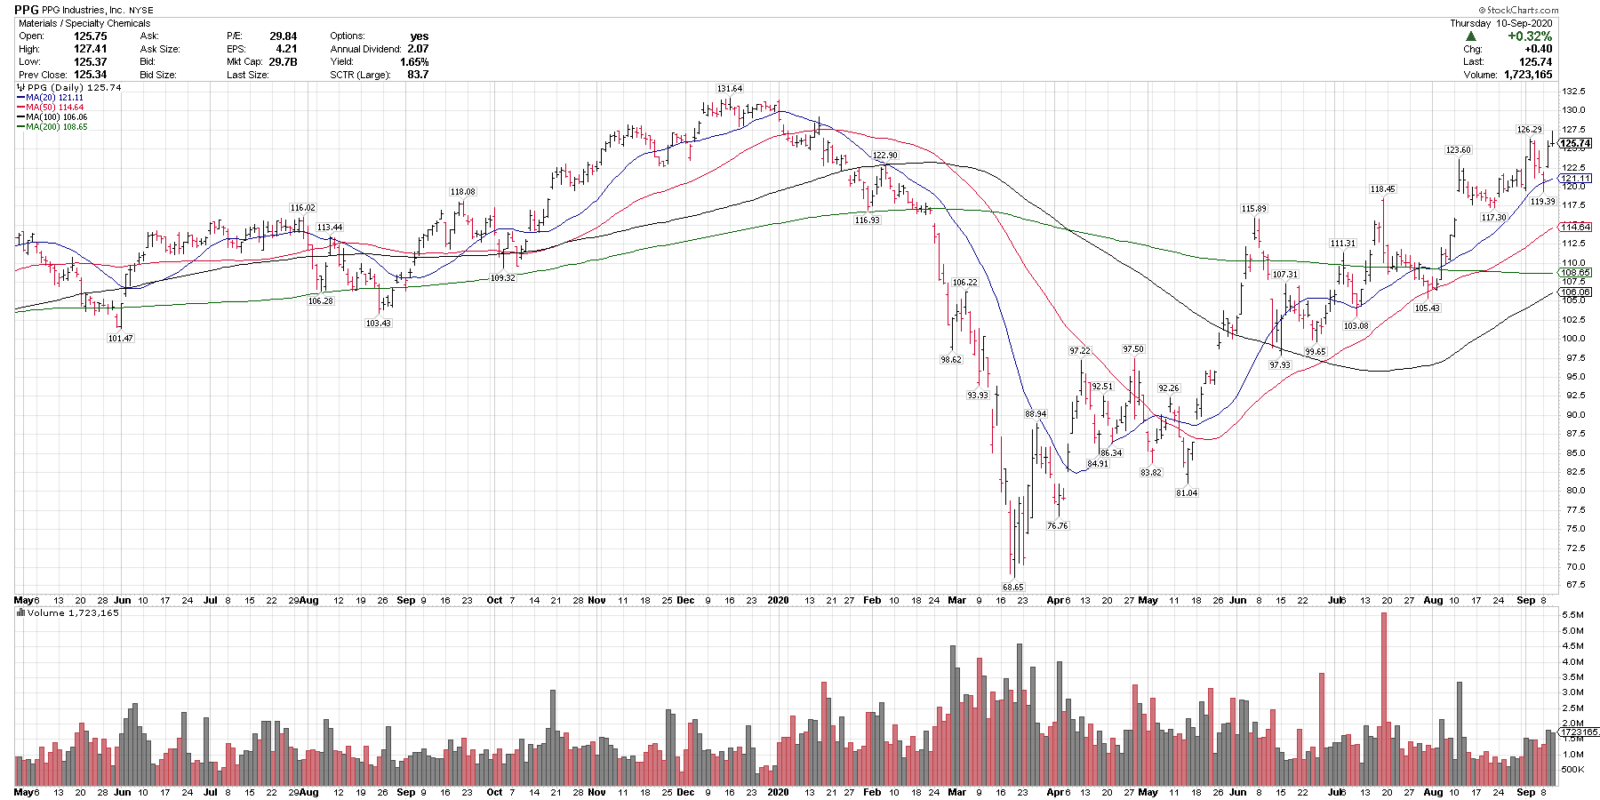
9/11/20
PPG Industries, PPG
Close: 125.74
Stop level: 111.90
PPG is in a lower volatility uptrend, above the rising 20, 50 & 100-sma & testing 8-month highs. The rising 50-sma is a key near-term trend gauge.
 9/10/20
Sea Ltd., SE
Close: 142.03
Pre-market: 143.47
Stop level: 119.72
SE is in a technical uptrend above the rising 50, 100 & 200-sma & recently pulled back 18.1% off all-time highs. The rising 50-sma is a key trend gauge. SE is a high volatility stock with a 6.0% daily range.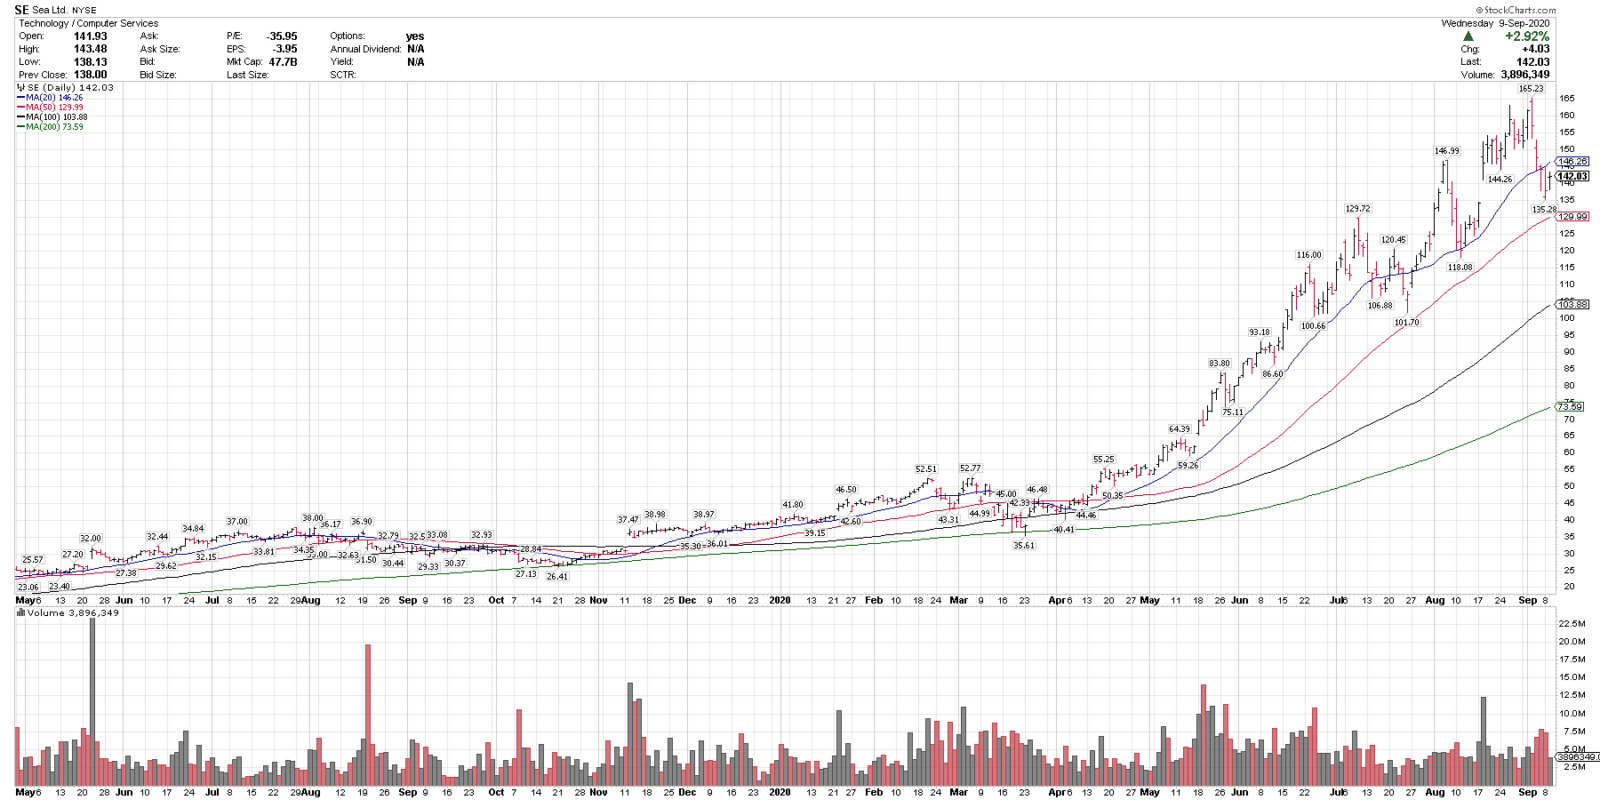 9/09/20
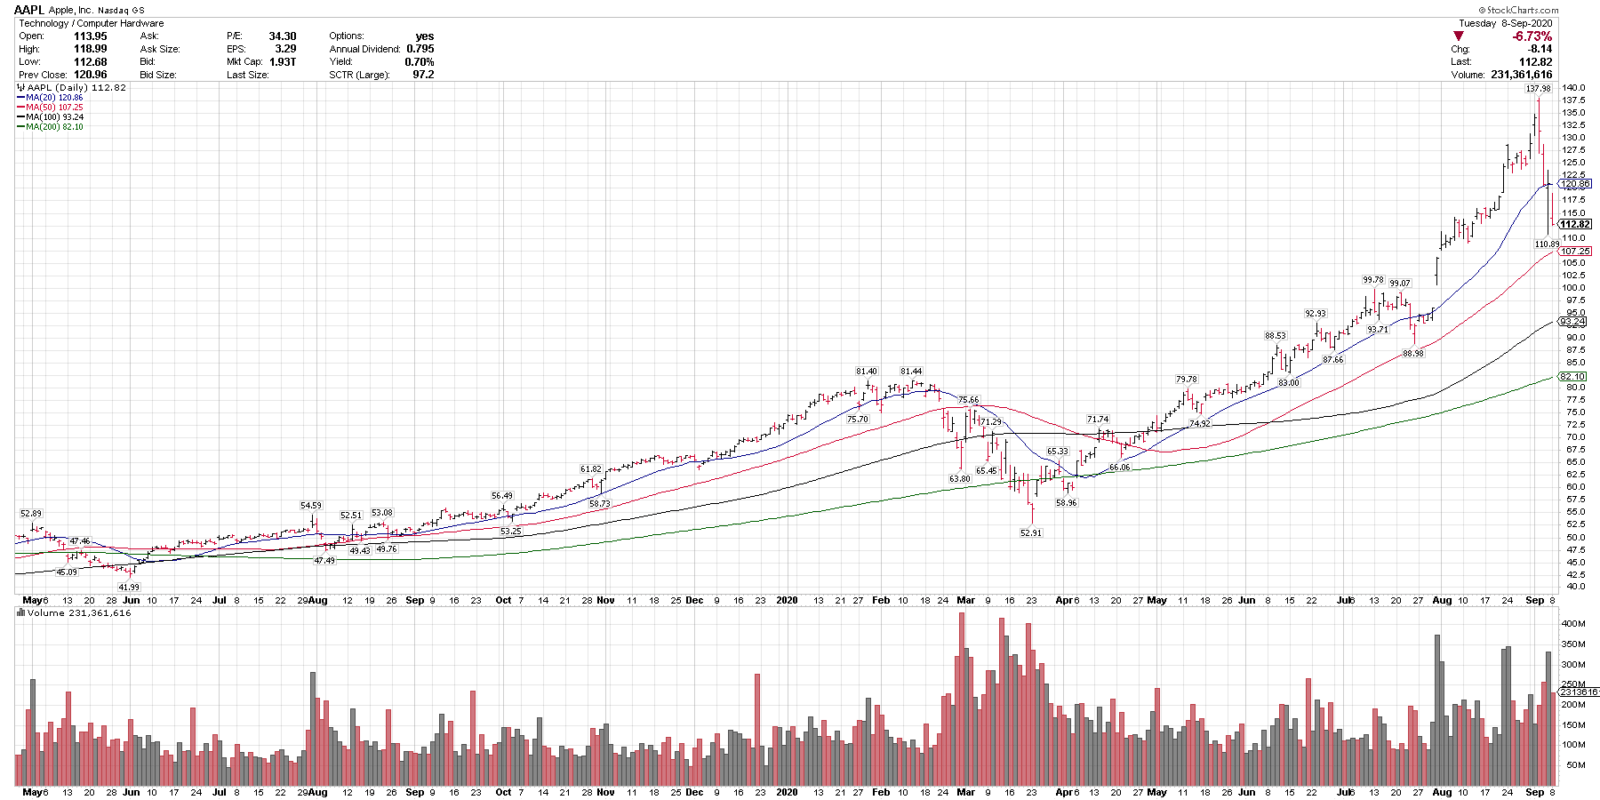
Apple, AAPL
Close: 112.82
Pre-mkt: 116.20
Stop level: 99.28
AAPL is in a technical uptrend above the rising 50, 100 & 200-sma and recently corrected 19.6% off all-time highs. The rising 50-sma is key near term support. $100 is also a key support level.
 9/08/20
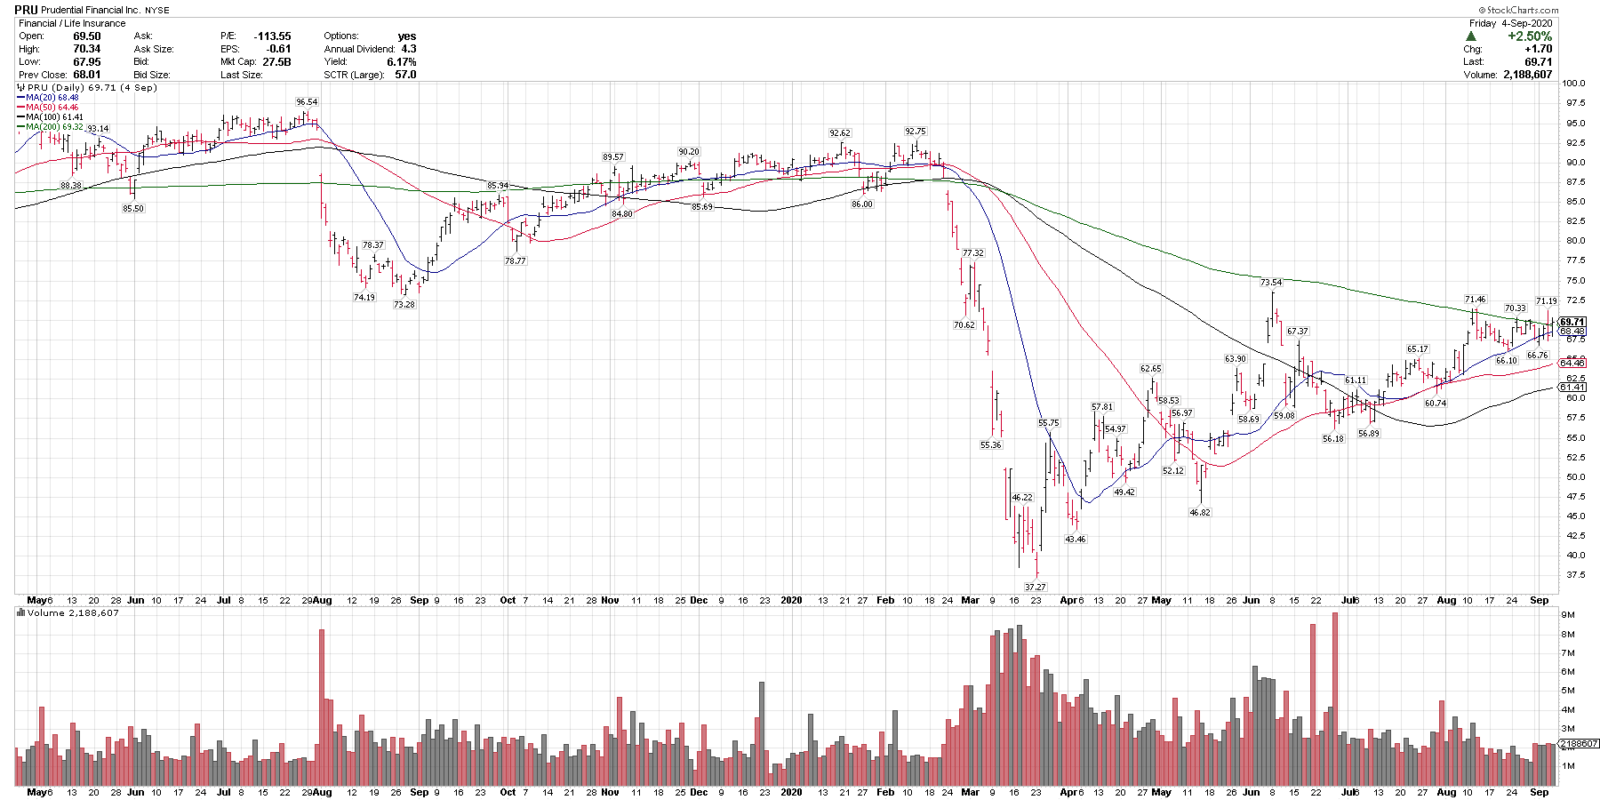
Prudential Financial Inc. PRU
Close: 69.71
Pre-mkt: 69.20
Stop level: 61.34
PRU is in an intermediate term uptrend above the rising 20, 50 & 100-sma and closed over the 200-sma on Friday. $66 and the 50-sma is key near term support.
 9/07/20
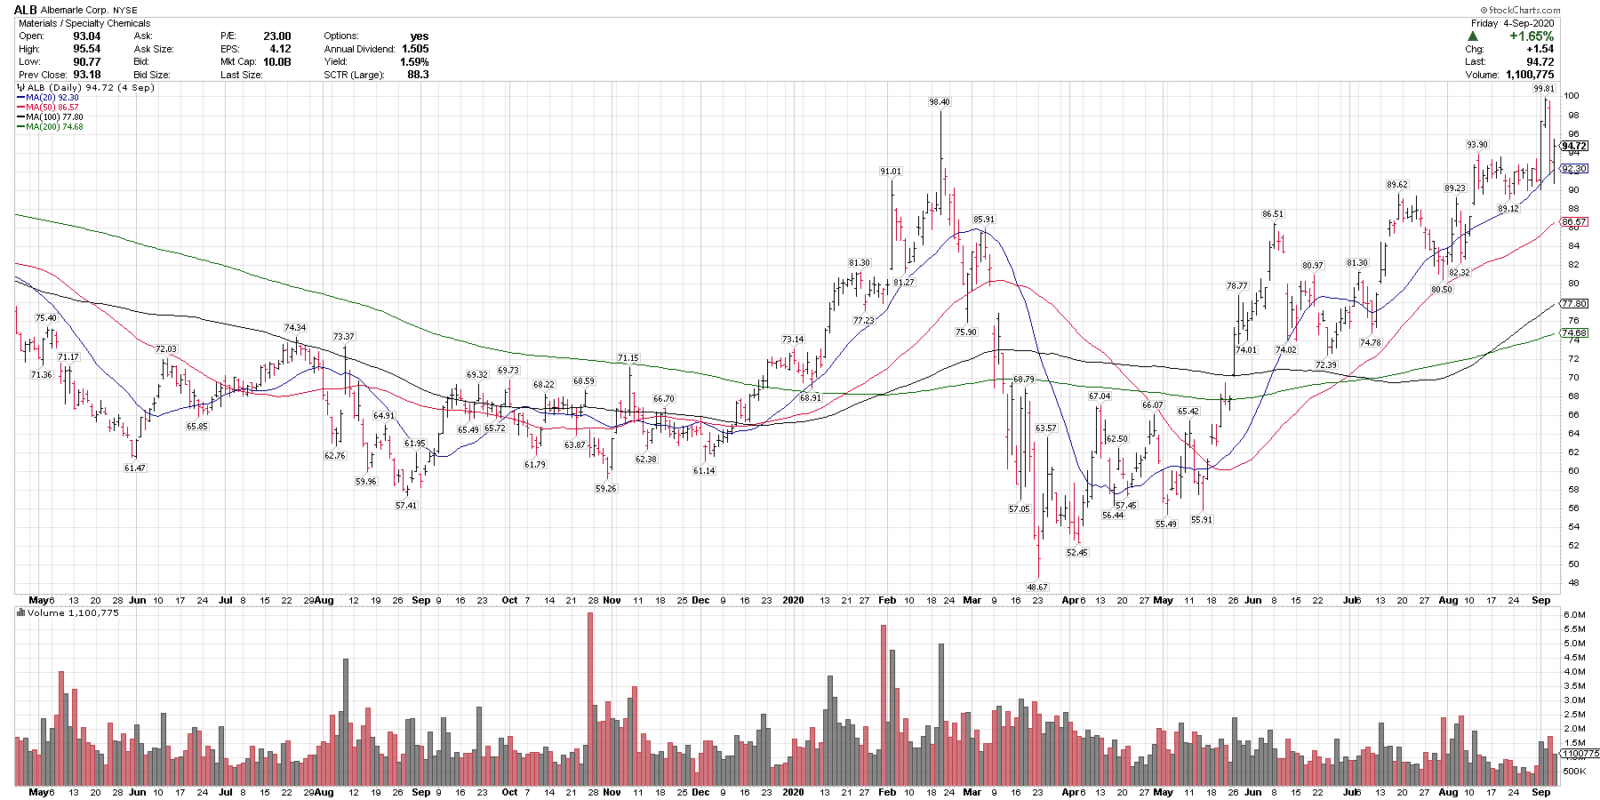
Chart of the Week
Albemarle Inc, ALB
Close: 94.72
Stop level: 83.34
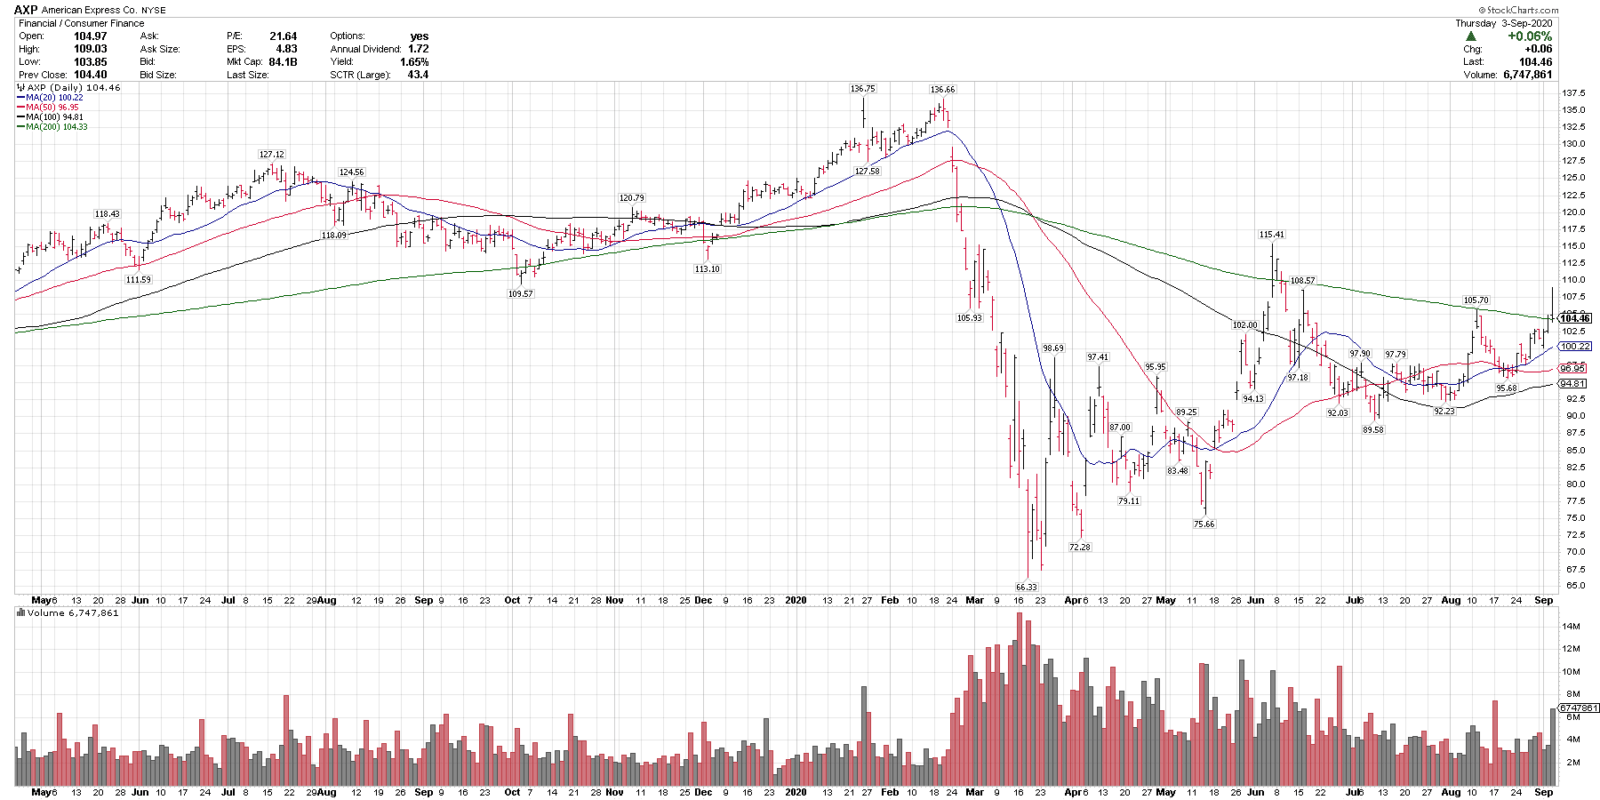
9/04/20
American Express, AXP
Close: 104.46
Pre-mkt: 106.64
Stop level: 93.91
AXP is in an intermediate term uptrend above all key MAs, closed over the 200-sma yesterday and is at the top of a 90-day price base.
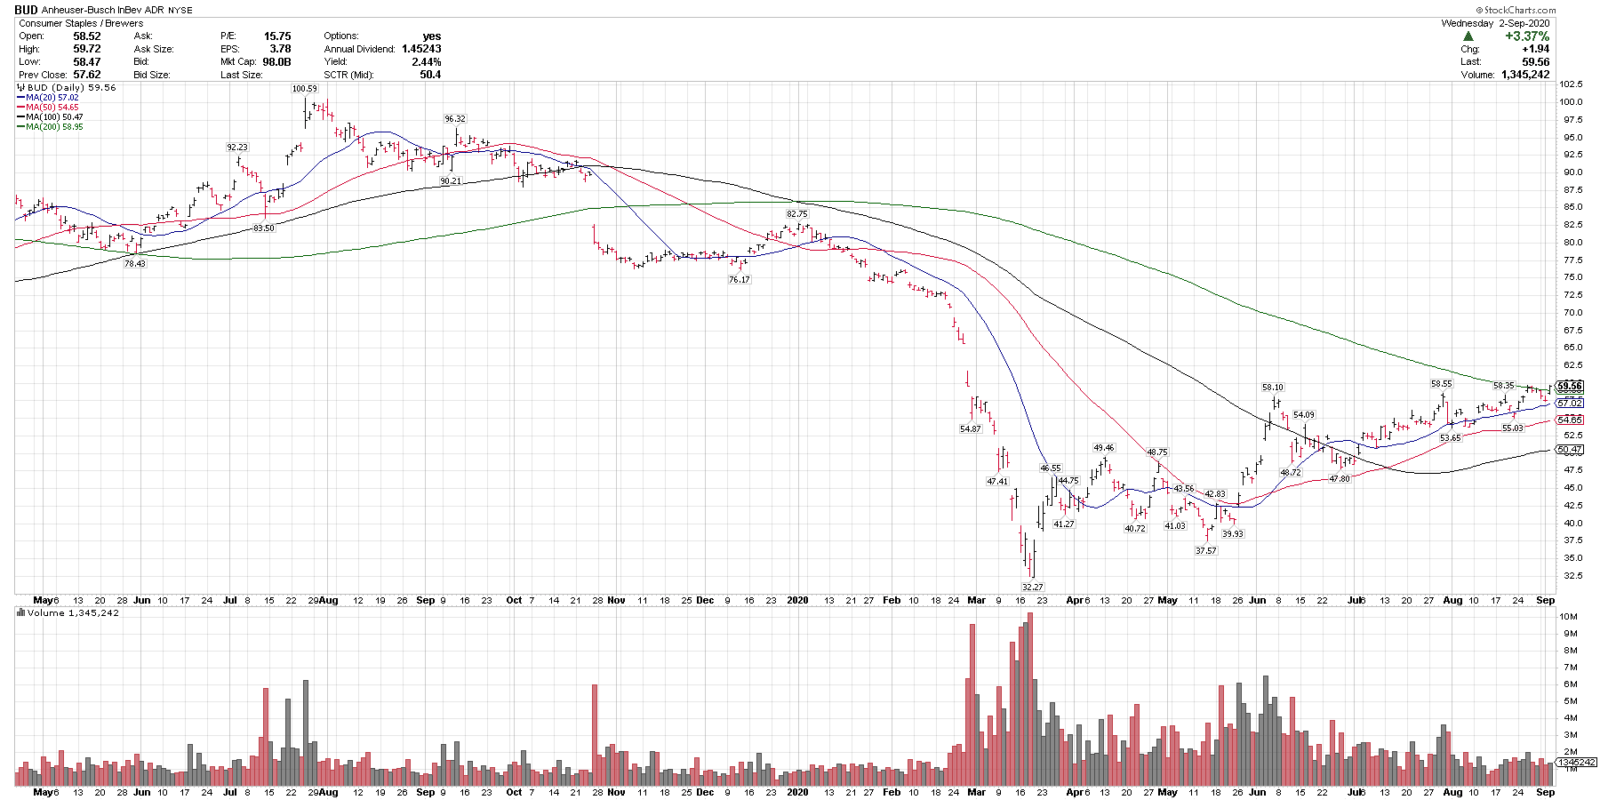
 9/03/20
Anheuser-Busch InBev, BUD
Close: 59.56
Pre-mkt: 59.99
Stop level: 53.60
BUD is in a technical uptrend above the rising 20, 50 & 100-sma, reclaimed the 200-sma yesterday and broke out of a 90-day price base.
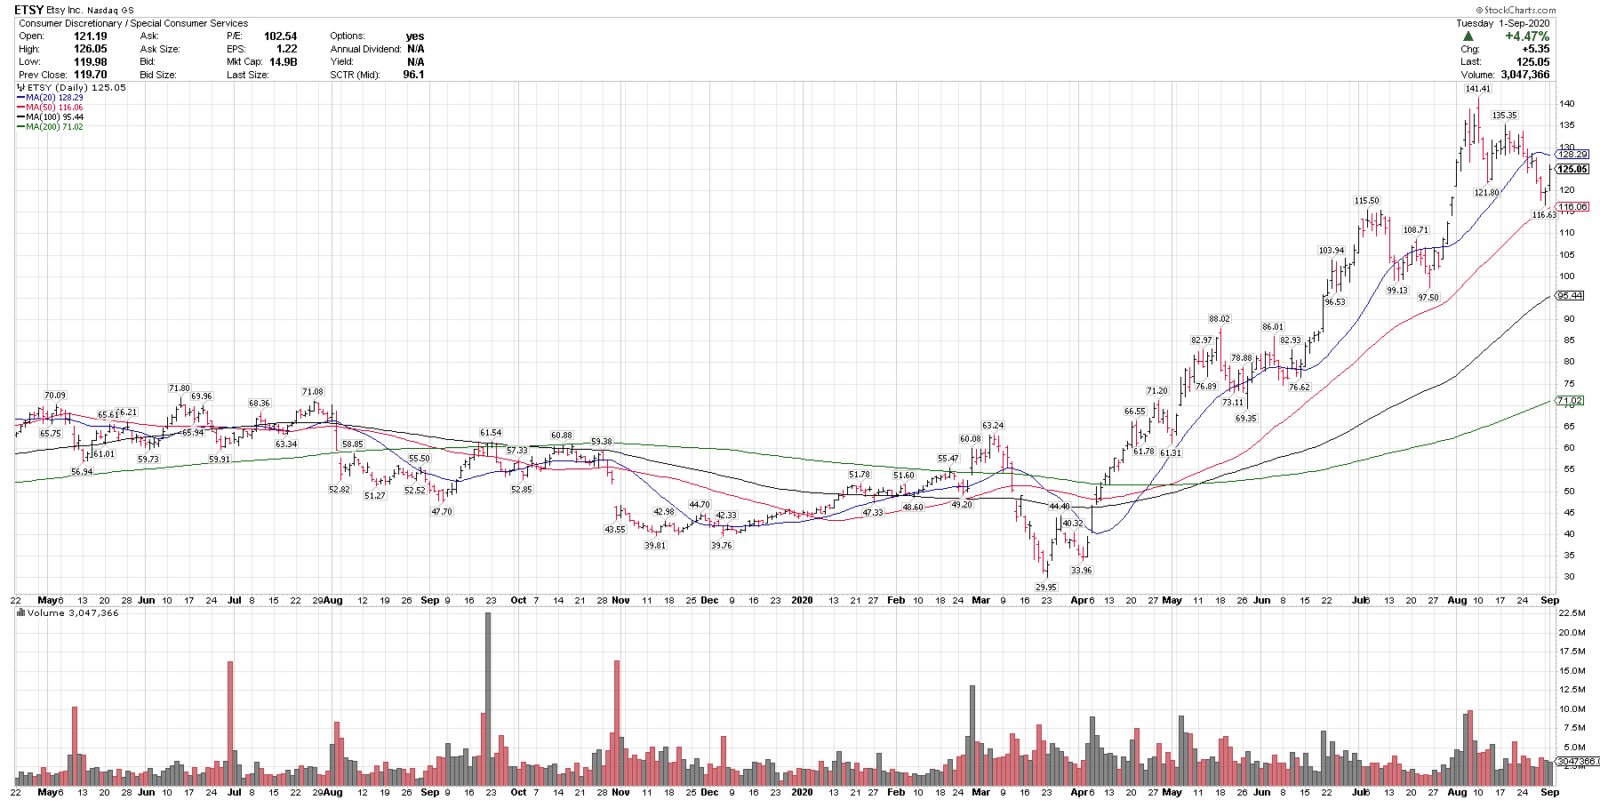
 9/02/20
Etsy, Inc. ETSY
Close (when posted) 125.05
Pre-mkt: 127.51
Stop level: 109.44
ETSY is in a technical uptrend above the rising 50, 100 & 200-sma. It recently pulled back 17.5% from all time highs and held the rising 50-sma, which is a key trend gauge here.
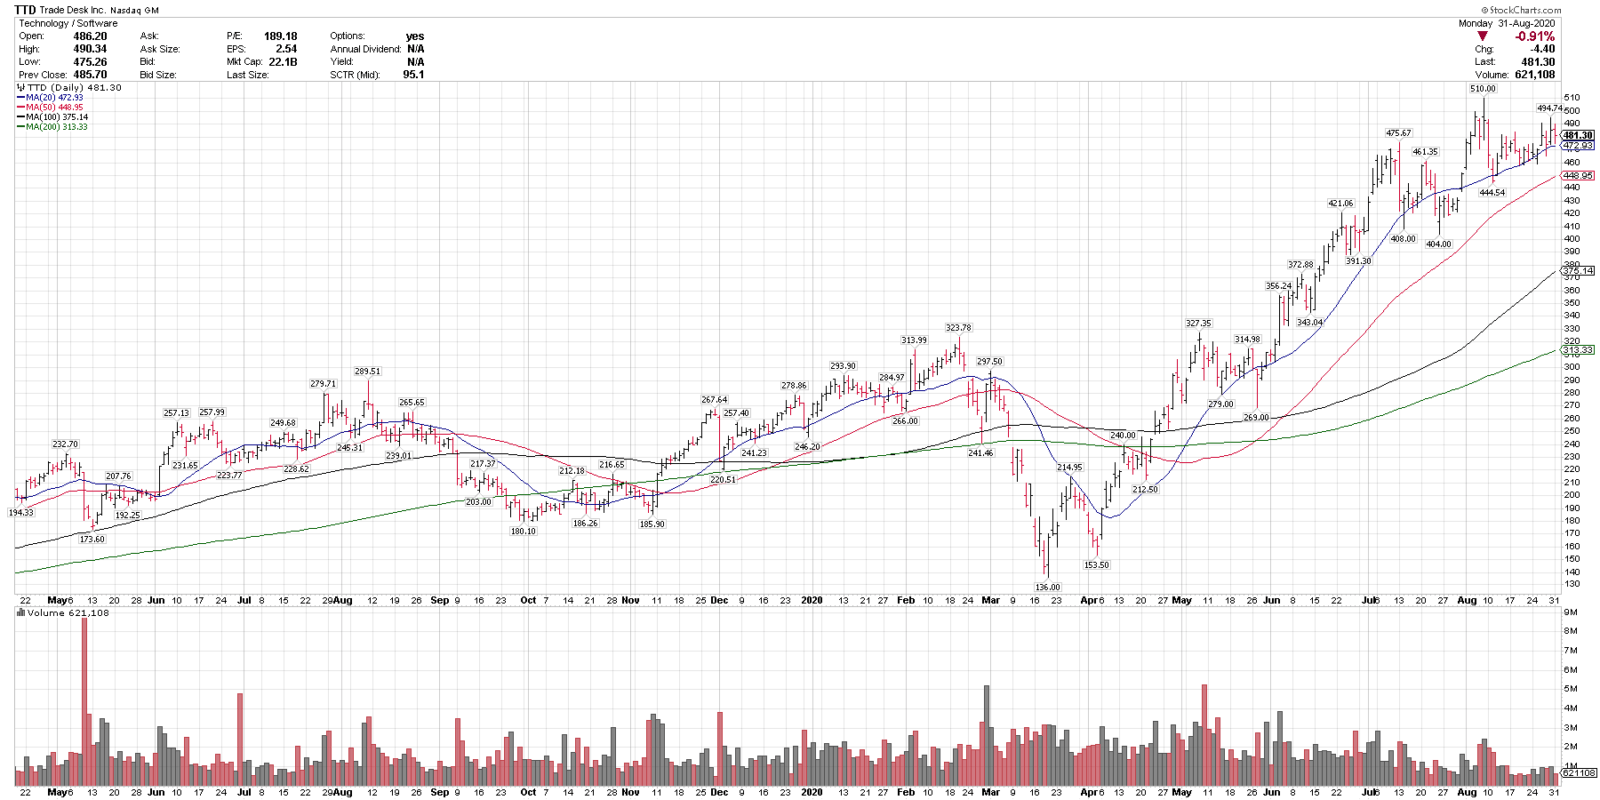
 9/01/20
Trade Desk Inc., TTD
Close: 481.30
Pre-mkt: 484.51
Stop level: 423.54
TTD is in a technical uptrend above all key rising MAs and recently completed a 12.8% pullback from all-time highs. The rising 50-sma is a key near term trend gauge. Also on this week’s Top 25 list.
 AUGUST 2020 “CHART OF THE DAY”8/31/20
Ingersoll Rand, IR
Close: 35.76
Stop level: 31.11
IR is in a technical uptrend above all key rising MAs and recently had a 6.6% pullback into the rising 20-sma.
8/30/20 Blue Chip Daily Chart of the Week:
XME, SPDR S&P Metals and Mining ETF
Close: $25.06
Stop level for position traders and investors: $22.36
please see chart analysis below
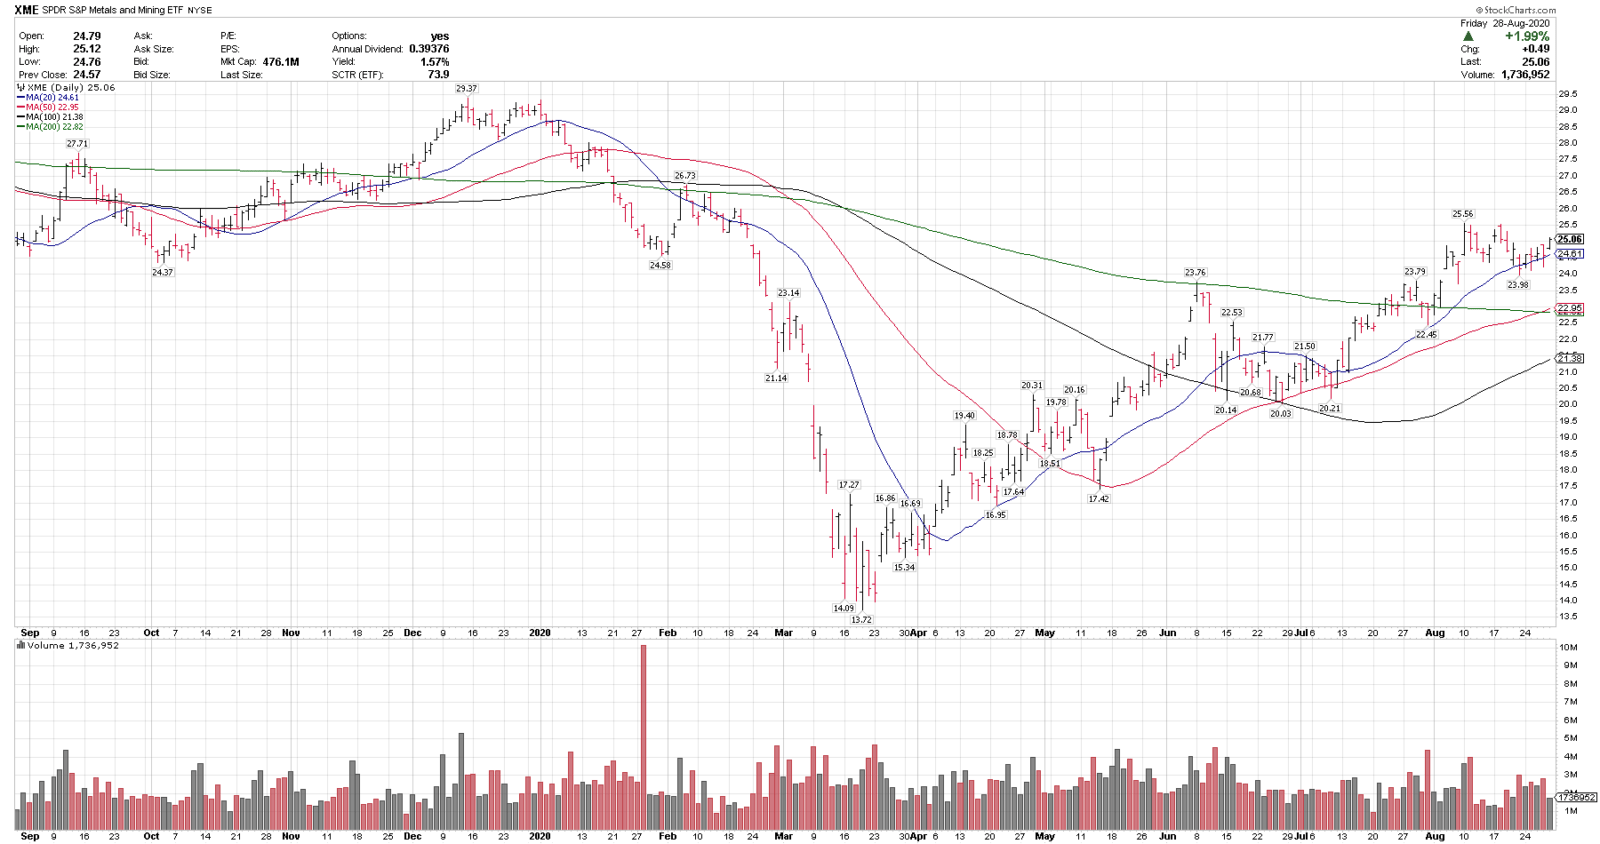
- XME is one of our top technical ideas here and on this week’s Blue Chip Daily Buy List for subscribers, and has been on the Buy list for most of the last few months.
- XME is in a technical uptrend above the rising 20, 50 and 100-day moving averages and is trading above the 200-sma, a signal of a strong uptrend on multiple time-frames.
- It recently broke out above $24, then tested and held that range before moving higher, a positive signal.
- XME recently completed a 50/200-sma cross, another bullish technical signal, indicating that intermediate-term momentum is improving as well.
- XME has held the rising 50-sma since late April, and that can be used as a key trend gauge here as well.
- On a non-technical note, the Fed announced last week that they are targeting higher inflation. If they are successful with this, industrial metals should benefit.
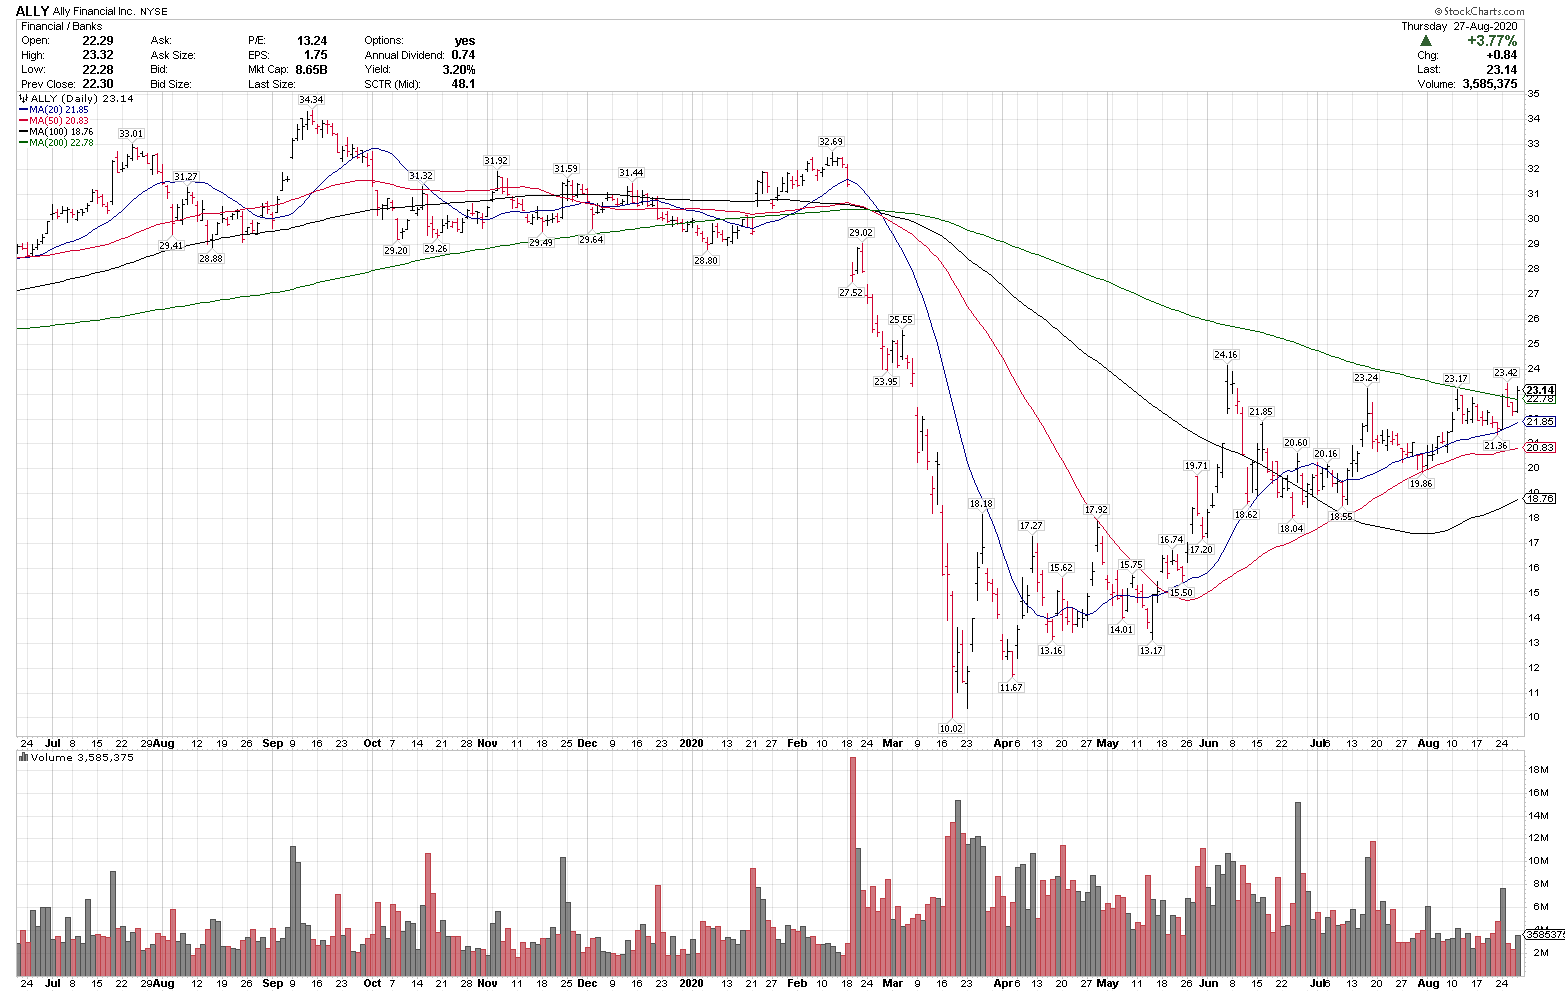
8/28/20
Ally Financial, ALLY
Close: 23.14
Pre-mkt: 23.34
Stop level: 20.36
ALLY is in an intermediate term uptrend above the rising 20, 50 & 100-sma and reclaimed the 200-sma yesterday. It is starting to break out of a 60-day range over $23. The 50-sma is a key trend gauge.
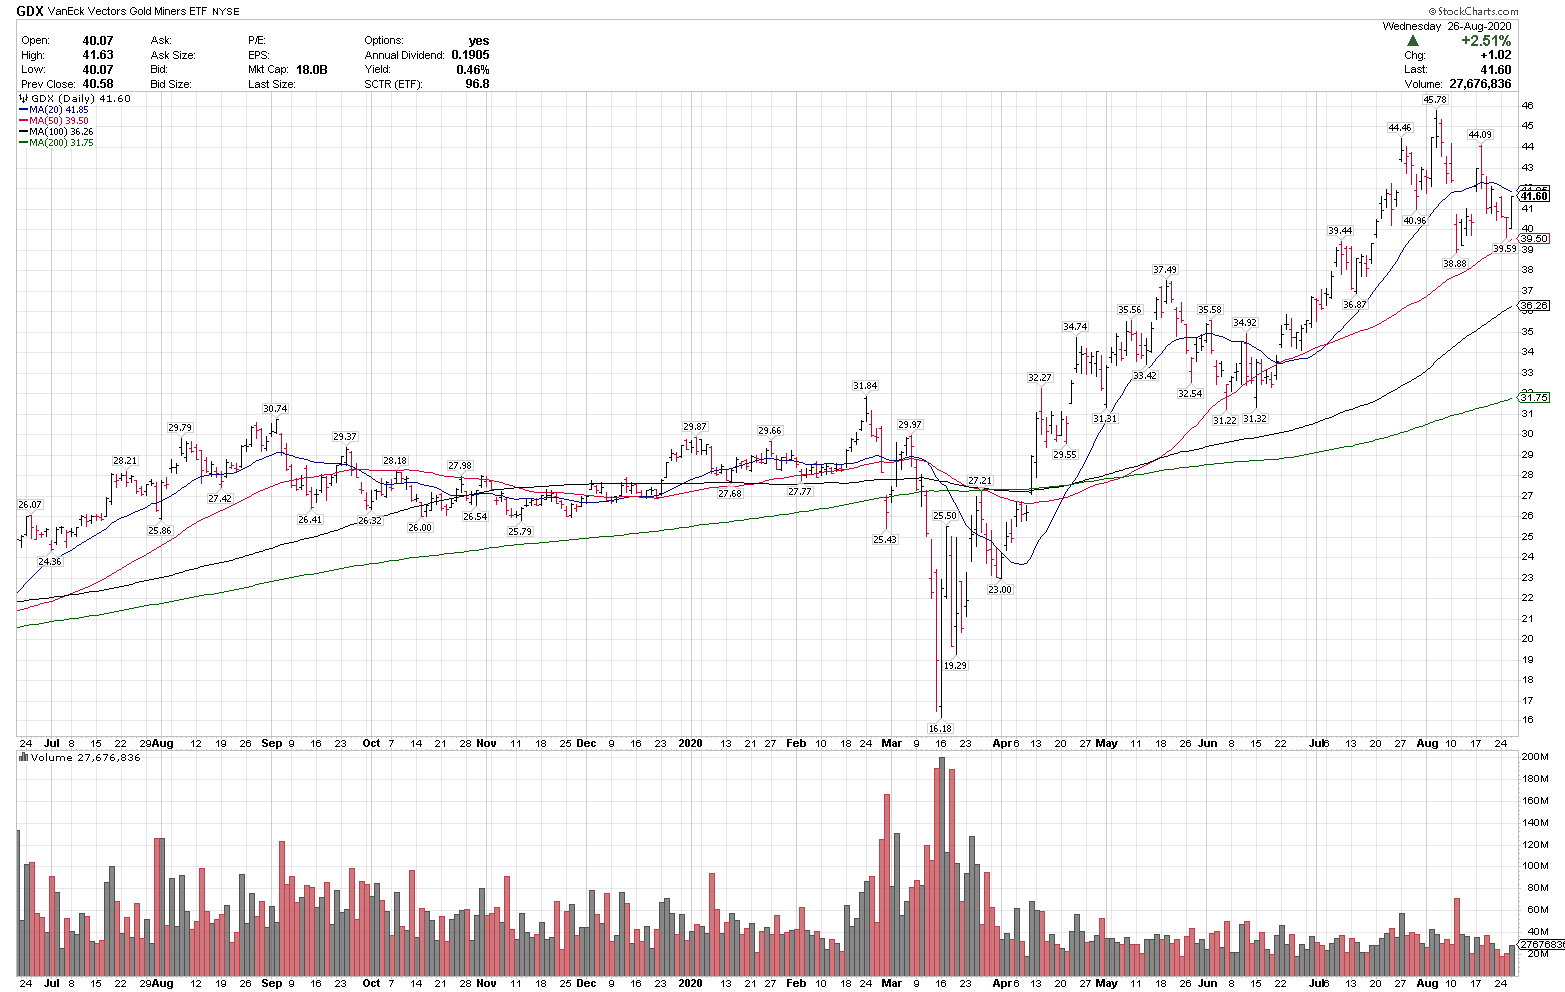
 8/27/20
VanEck Gold Miners ETF, GDX
Close: 41.60
Pre-mkt: 41.21
Stop level: 35.88
*This idea is pending the Fed announcement at 9:10am today.
GDX is in a technical uptrend and recently corrected 15% off 7 1/2 year highs into the rising 50-sma. GDX is a higher volatility chart.
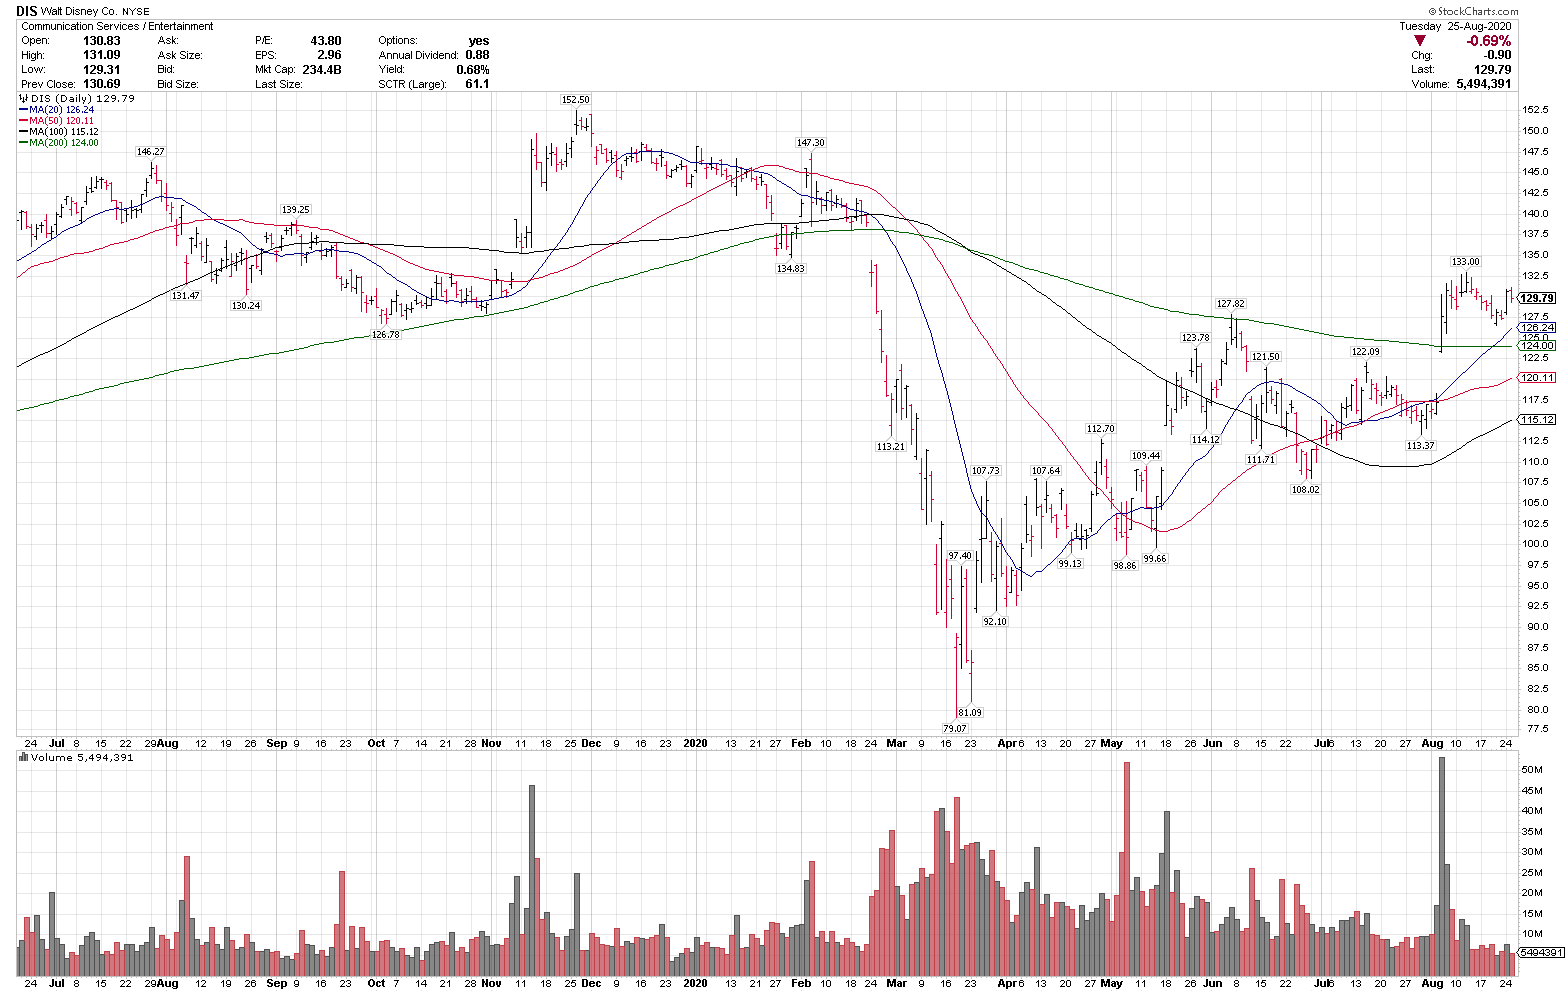
8/26/20
Disney, DIS
Close: 129.79
Pre-mkt: 129.37
Stop level: 116.81
DIS is in a technical uptrend above the rising 20, 50 and 100-sma and have just reclaimed the 200-sma. The rising 50-sma at $120.11 is near-term support on any pullbacks.
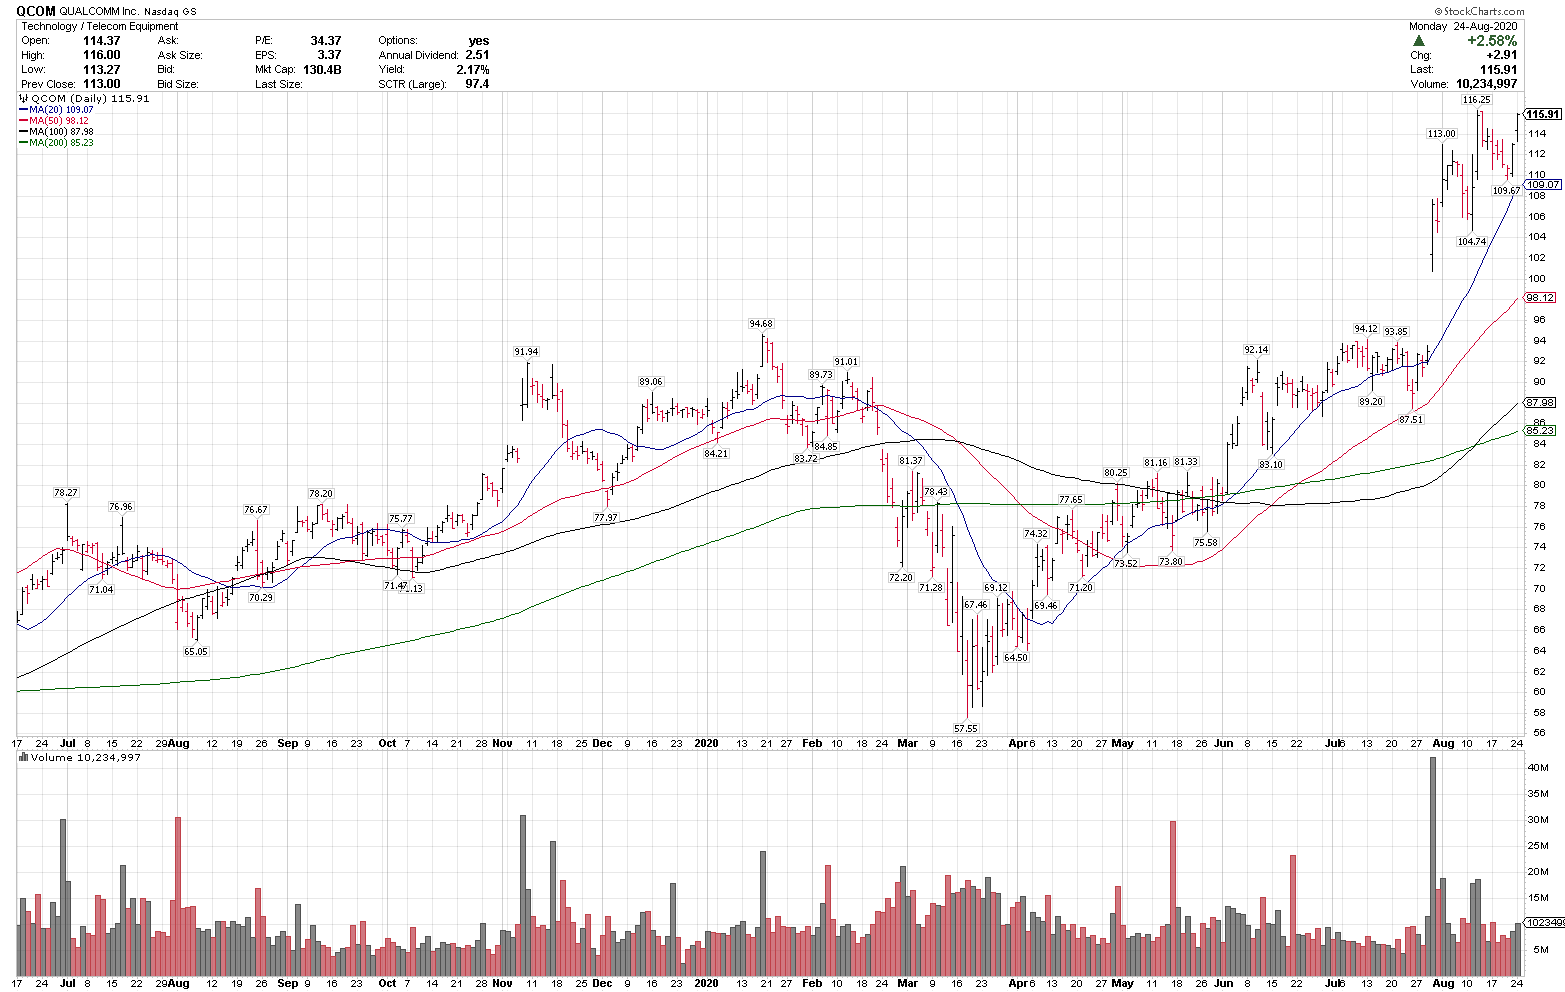
 8/25/20
Qualcomm, QCOM
Close (when posted): 115.91
Stop level: 97.92 (below rising 50-sma)QCOM is in a technical uptrend above all key rising moving averages and recently pulled back into the rising 20-sma after making a new high. QCOM is also on this week’s Top 25 list.
 8/24/20
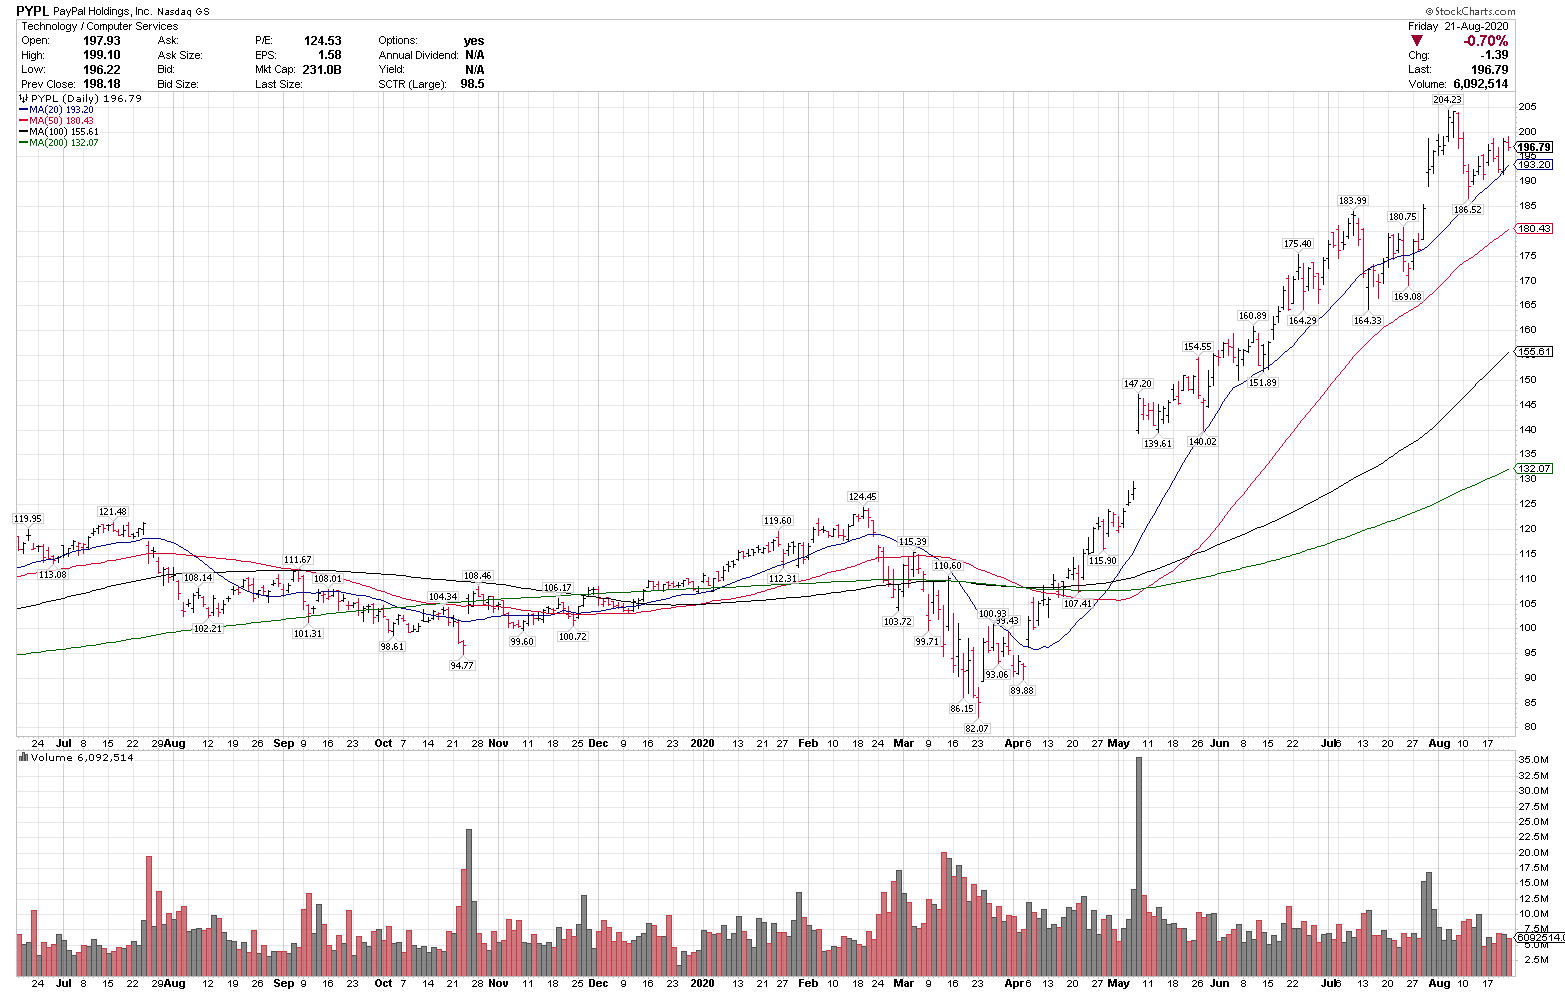
PayPal, PYPL
Close (when posted): 196.79
Pre-market: 200.33
Stop level: 168.27
- PYPL is in a technical uptrend above all key rising moving averages, indicating a strong uptrend on multiple time frames.
- The stock recently corrected 8.6% from all time highs and held the rising 20-day moving average, a strong technical signal.
- On any pullbacks, over $185 is a key support level.
8/21/20
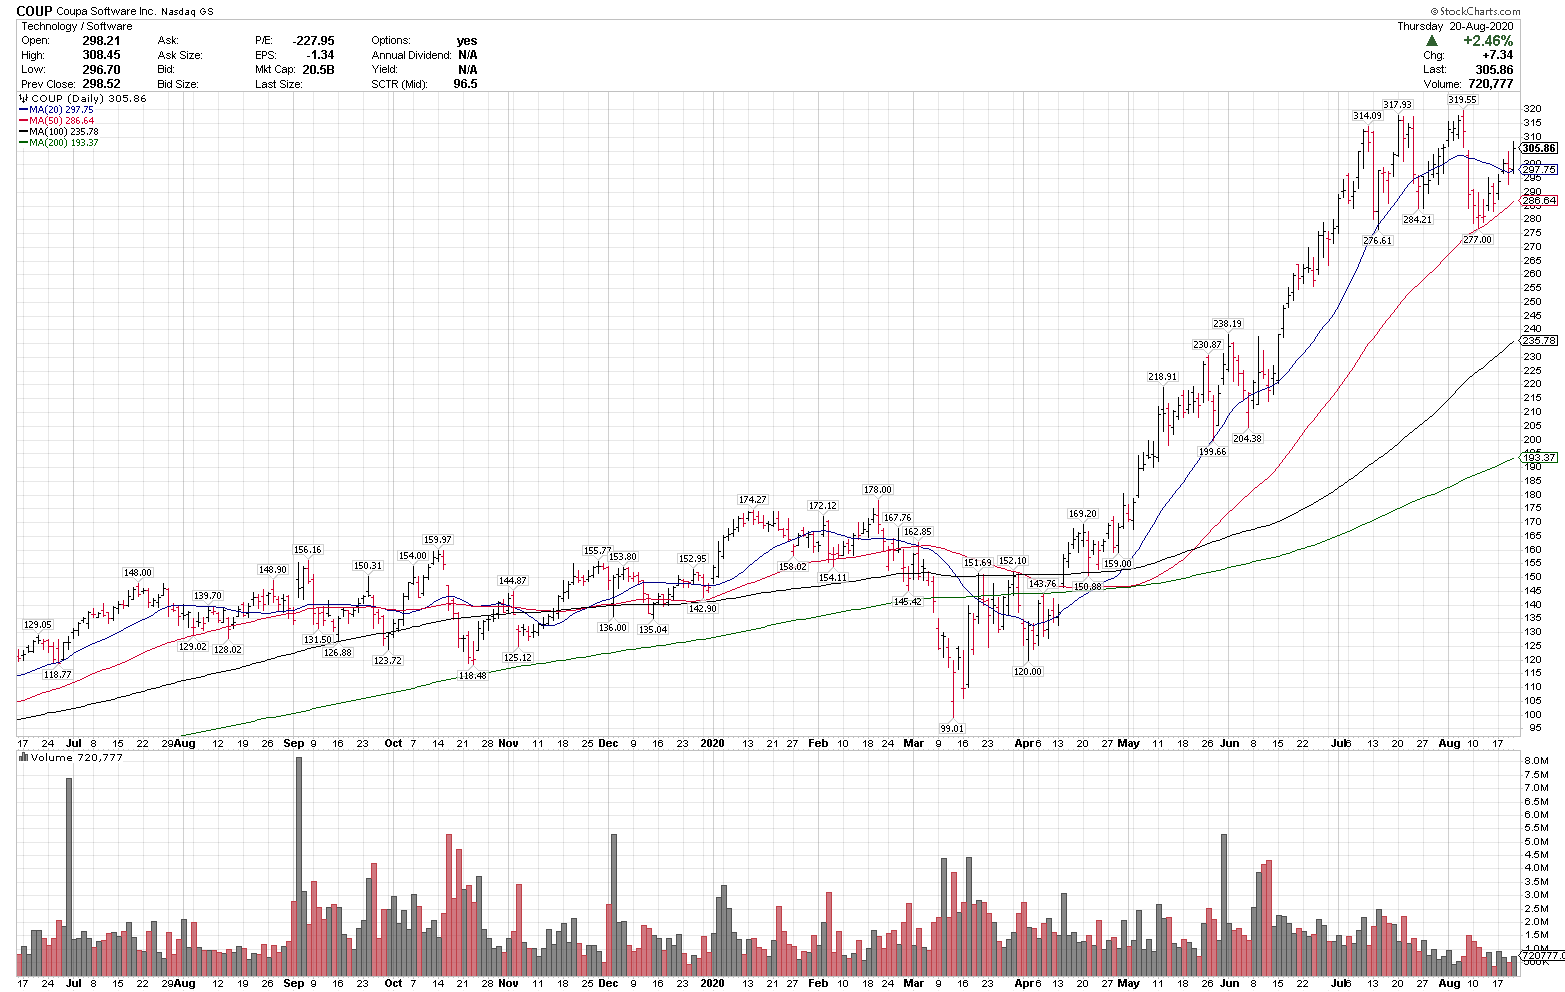
Coupa Software, COUP
Close: 305.86
Pre-mkt: 304.00
Stop level: 267.43
COUP is in a technical uptrend above all key rising MA’s and recently completed a 13.3% pullback off all-time highs into the rising 50-sma. $275 is a key support level on any pullbacks.
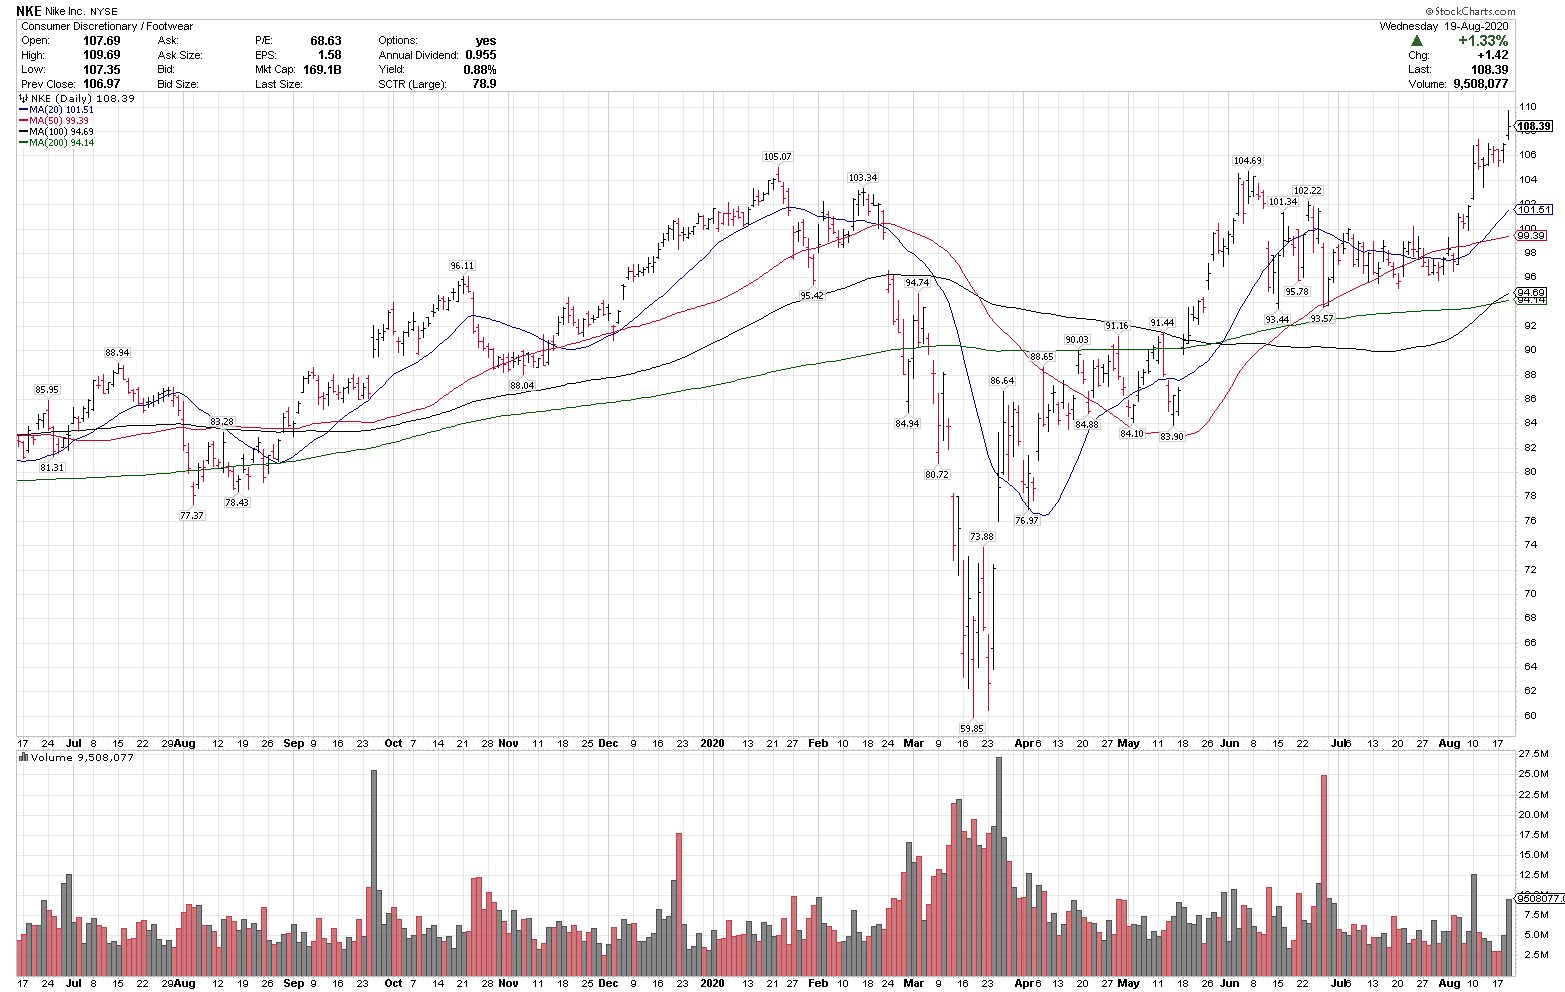
8/20/20
Nike, NKE
Close: 108.39
Pre-market: 107.85
Stop level: 93.82
NKE is in a technical uptrend above all key rising MAs and broke out to a new all-time high yesterday. 100-104 is key near term support on any market or stock pullbacks.
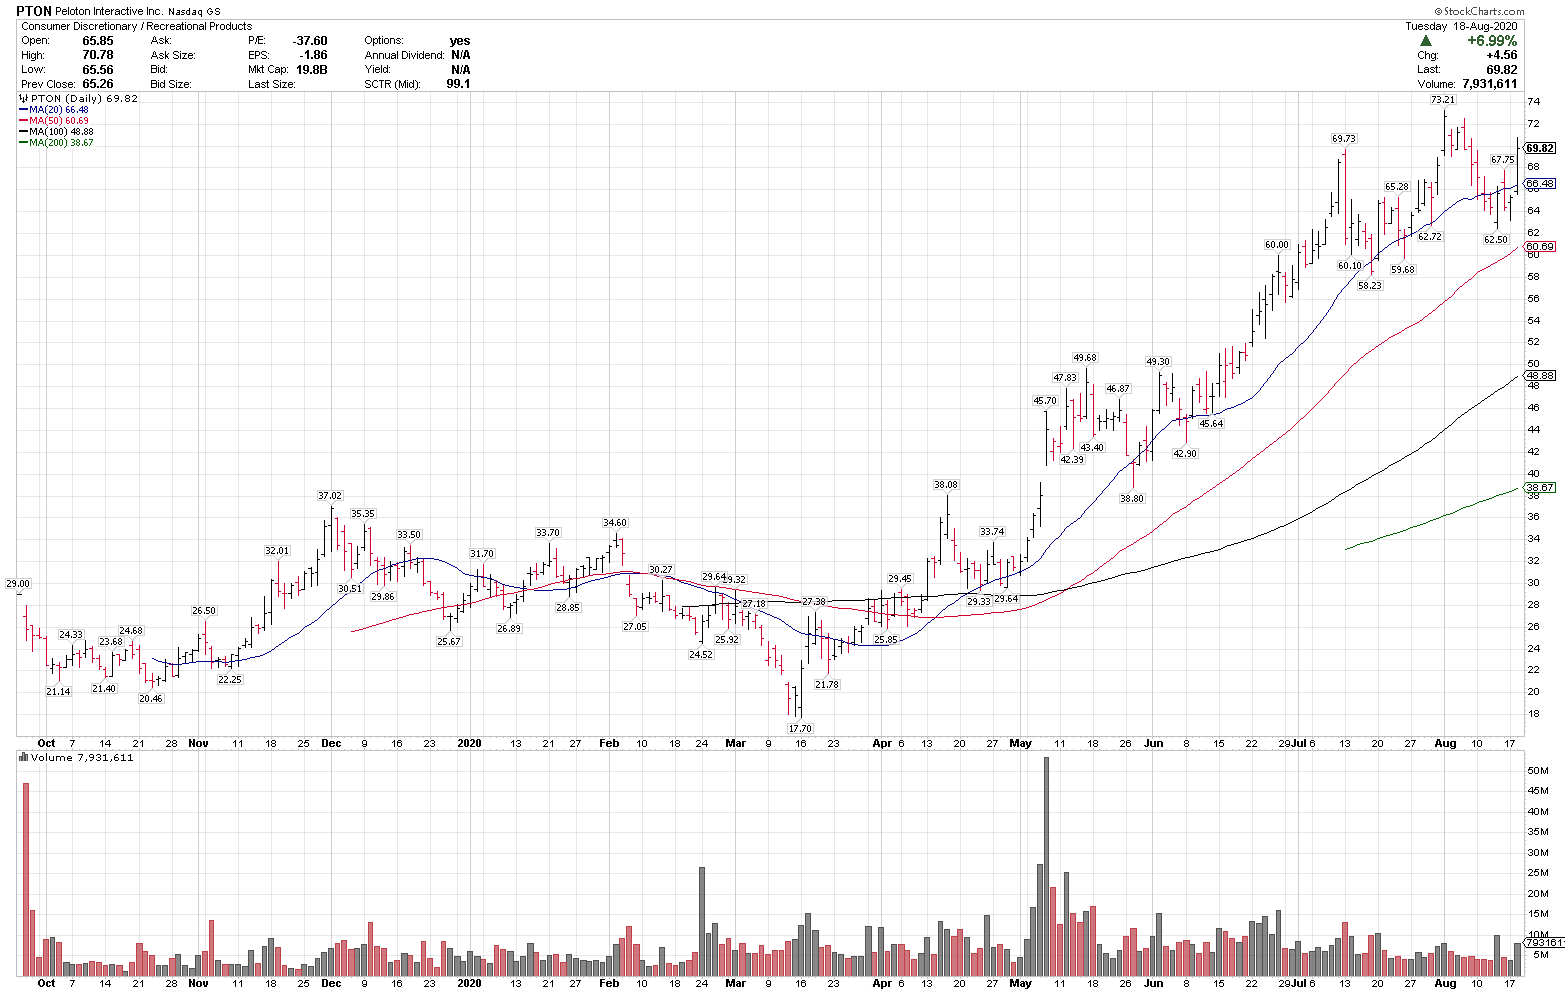
 8/19/20
Peloton, PTON
Close: 69.82
Pre-mkt: 69.06
Stop level: 15% (58.70)
PTON is in a technical uptrend above all key-rising MAs & recently had a 14.6% pullback off AT highs, over the 50-sma. PTON is a higher beta stock, pulling back pre-market & could be volatile over 62.50.
 8/18/20
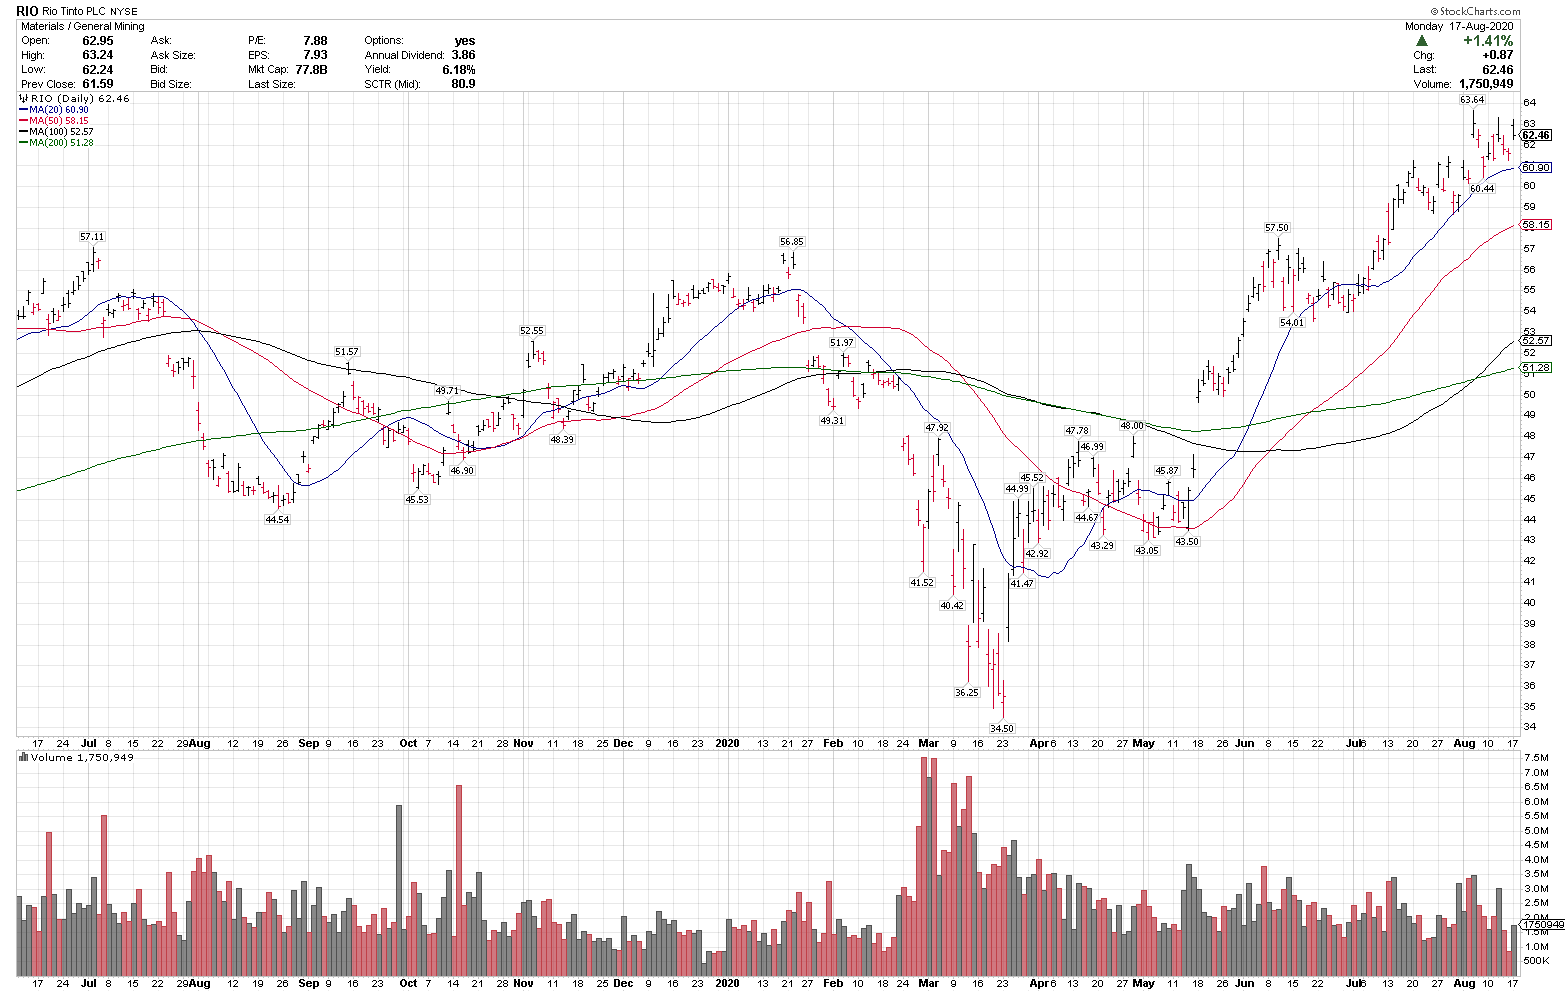
Rio Tinto PLC, RIO
Close: 62.46
Pre-mkt: 63.32
Stop level: 12% (55.72)RIO is in a technical uptrend above all key rising MAs and recently broke out to a 12-year high. The rising 50-sma is a key near-term trend gauge.
 8/17/20
Viacom, VIAC
Close: 27.46
Pre-mkt: 27.60
Stop level: 23.36
VIAC is in a technical uptrend above the rising 20, 50 & 100-sma and cleared the 200-sma on Friday. 24 & 25.50 are key support levels.
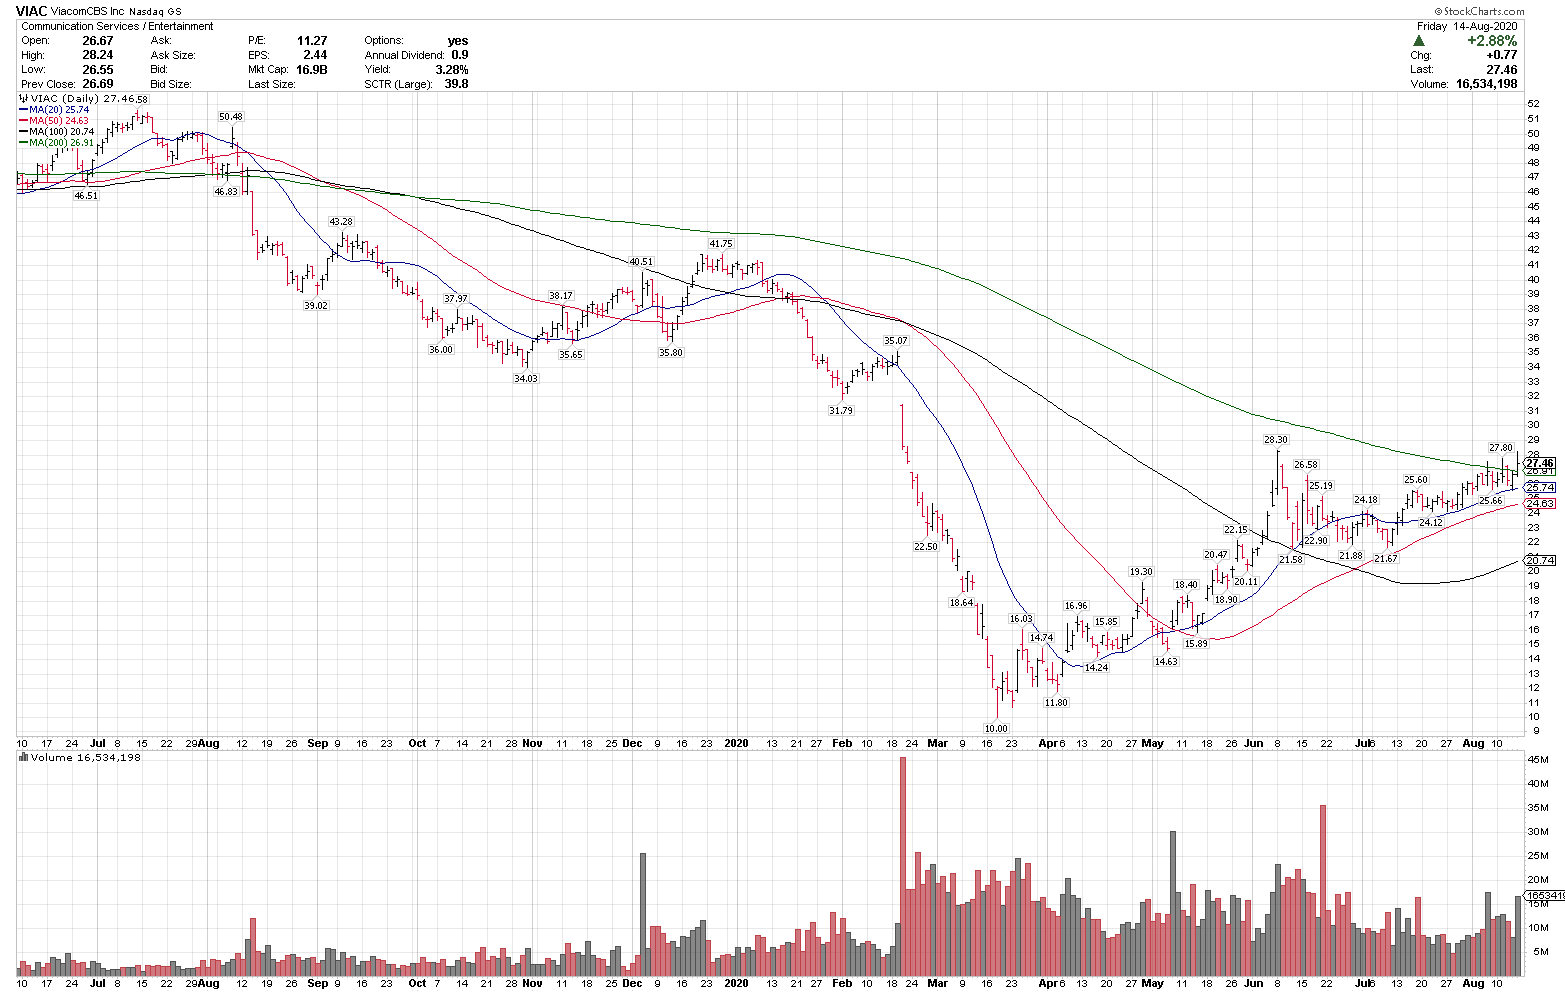 8/14/20
Twilio, TWLO
Close: 243.99
Pre-mkt: 245.00
Stop level: 206.84TWLO is in a technical uptrend above all key rising MAs and recently pulled back 16.8% off all-time highs into the rising 50-sma. TWLO is a higher volatility stock.
8/13/20
Activision, ATVI
Close: 81.71
Pre-Market: 81.54
Stop: 71.88
ATVI is in a technical uptrend above the rising 50, 100 & 200-sma, with a rising 20-sma as well. ATVI recently completed a 10.2% pullback off AT highs into the rising 50-sma. The stop is below the 100-sma, a key trend gauge.
 8/12/20
Nokia, NOK
Close: 4.96
Pre-market: 5.03
Stop level: 4.19
NOK is in a technical uptrend above all key MAs, a rising 20, 50 and 100-sma and the 200-sma is turning up. NOK just had a 5% pullback from the recent breakout. 4.50-4.60 is key near term support.
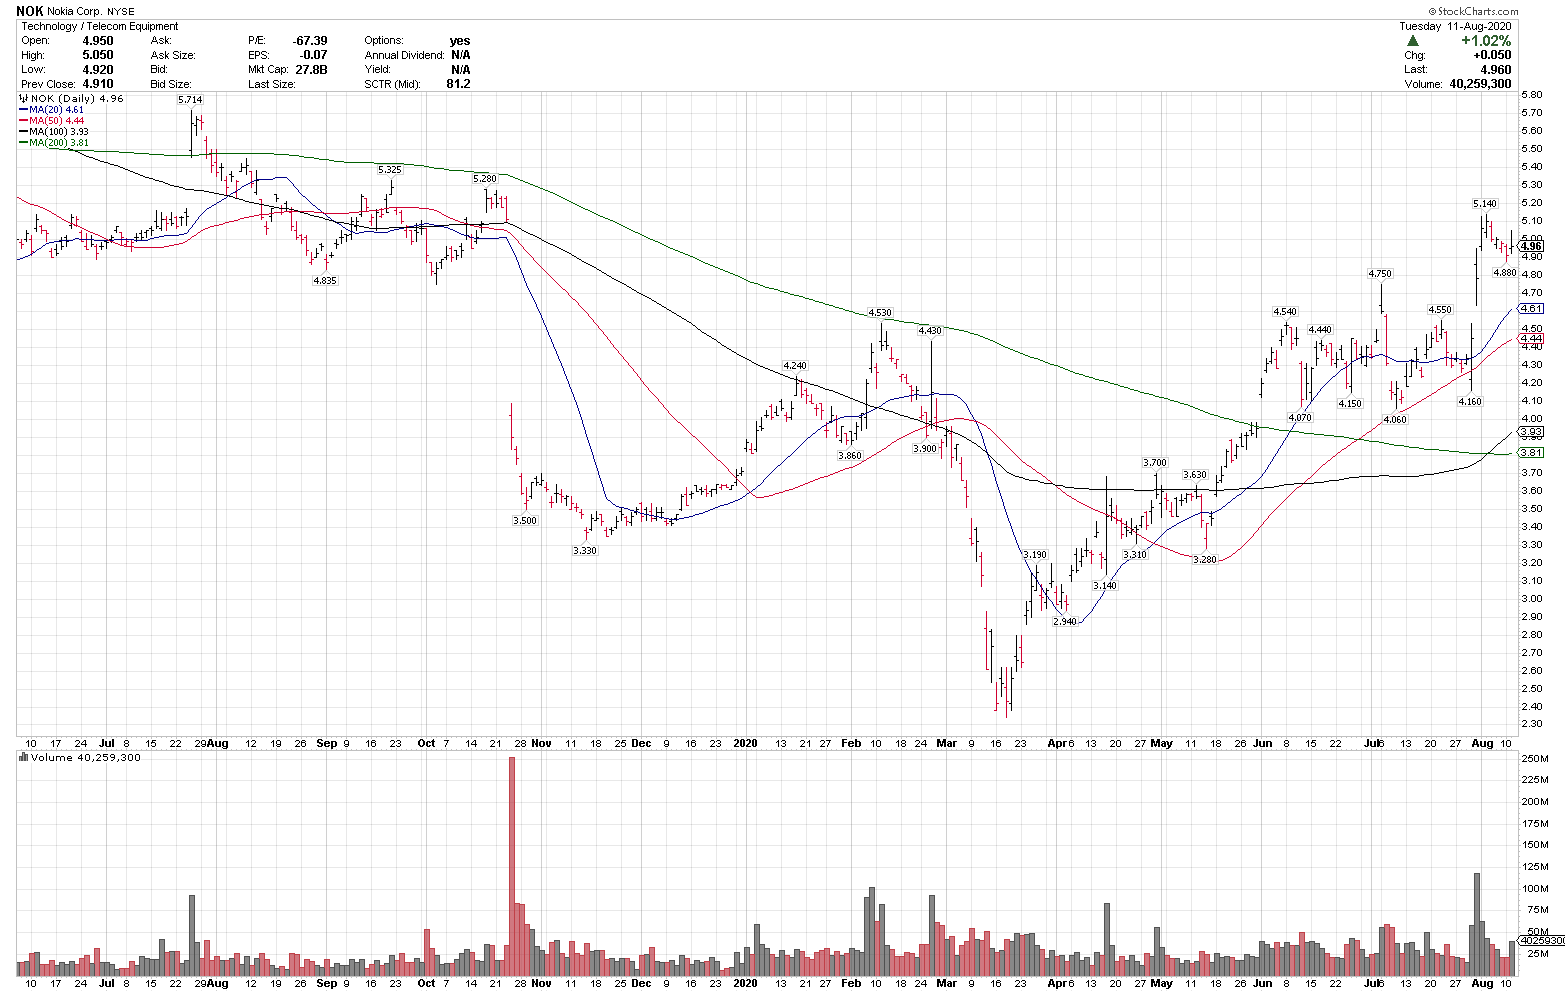
8/11/20
Halliburton, HAL
Close: 15.61
Pre-market: 15.92
Stop level: 13.37
HAL is in an uptrend of higher highs & higher lows, above the rising 20, 50 and 100-sma and breaking out above the 200-sma & 60-day highs pre-market. HAL was on Sunday’s 10 Best 200-sma Charts as well.
8/10/20
Boston Scientific, BSX
Close: 38.97
Pre-mkt: 39.30
Stop level: 34.29
Volatility: 2.66%
BSX is starting to breakout of a 4 month range, reclaimed the 200-sma last week and is also above the rising 20, 50 & 100-sma. A close over $40 could signal a breakout higher.
 8/07/20
Chart of the Day
Google, GOOGL
Close: 1504.95
Pre-market: 1501.87Stop level: 1324.45
GOOGL is in a technical uptrend above the rising 50, 100 and 200-sma and recently completed an 8.3% pullback off all-time highs. There is key price support in the 1400-1450 range.
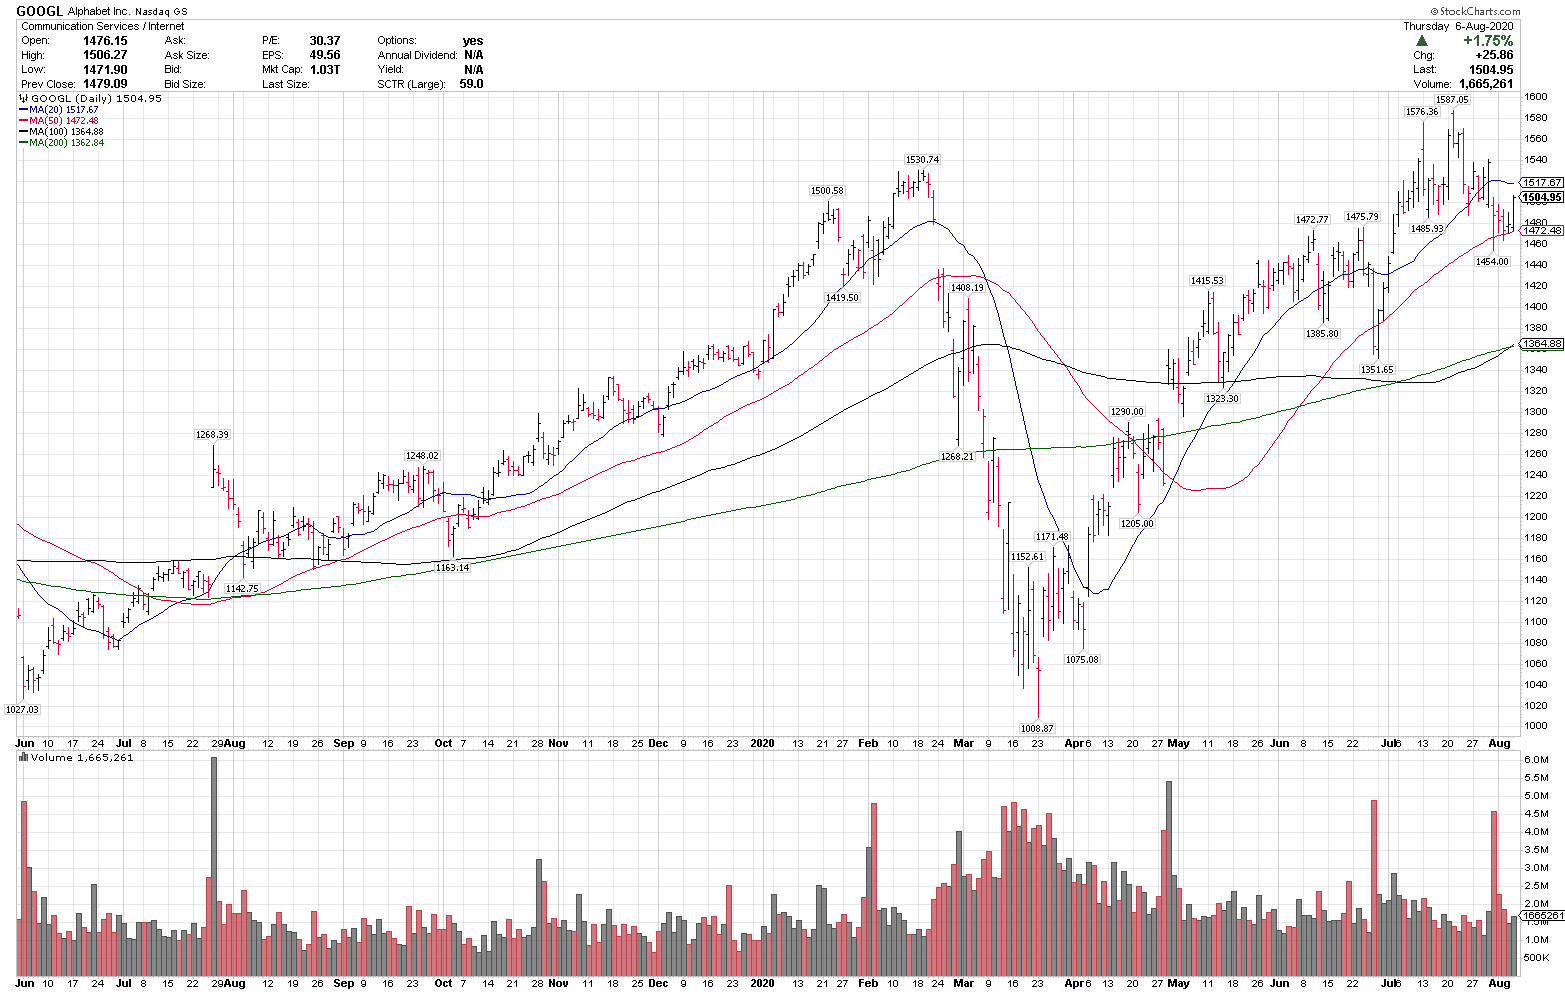 8/07/20
Best Ideas List ( a comparable idea to the Chart of the Day)
Visa, V
Close: 198.77
Pre-market: 197.89
Stop level: 178.89
V is consolidating in a 3 month range in a longer term uptrend and is above all key rising MAs. 185 is near-term support and a move over 202.50 could signal a breakout.
 8/06/20Caterpillar, CAT
Close: 134.97 / Pre-market: 134.70
Stop level: 118.77
CAT is in a primary uptrend above all key rising MAs, and recently had a 7.7% pullback off 6-month highs. The rising 50-sma below is a key near term trend gauge.
8/05/20
Broadcom, AVGO
Close: 328.39
Pre-market: 329.55
Stop level: 284.98
AVGO is in an uptrend above all key rising MAs and broke out above an 8-month range yesterday to new highs. The 50-sma is key on any pullbacks.
8/04/20
Amazon, AMZN
Pre-market: 3098.00
Stop level: 2724.40
AMZN is in a primary uptrend above all key rising MAs & recently pulled back 12.7% off all time highs. 2900-3000 is near term support & the rising 50-sma below at 2798 is a key trend gauge here.
8/03/20
Adobe Systems, ADBE
Close (when posted): 444.32
Stop risk level: 389.64
ADBE is in a technical uptrend above the rising 20, 50, 100 and 200-sma, recently completed a 7.3% pullback and is starting to turn back up.
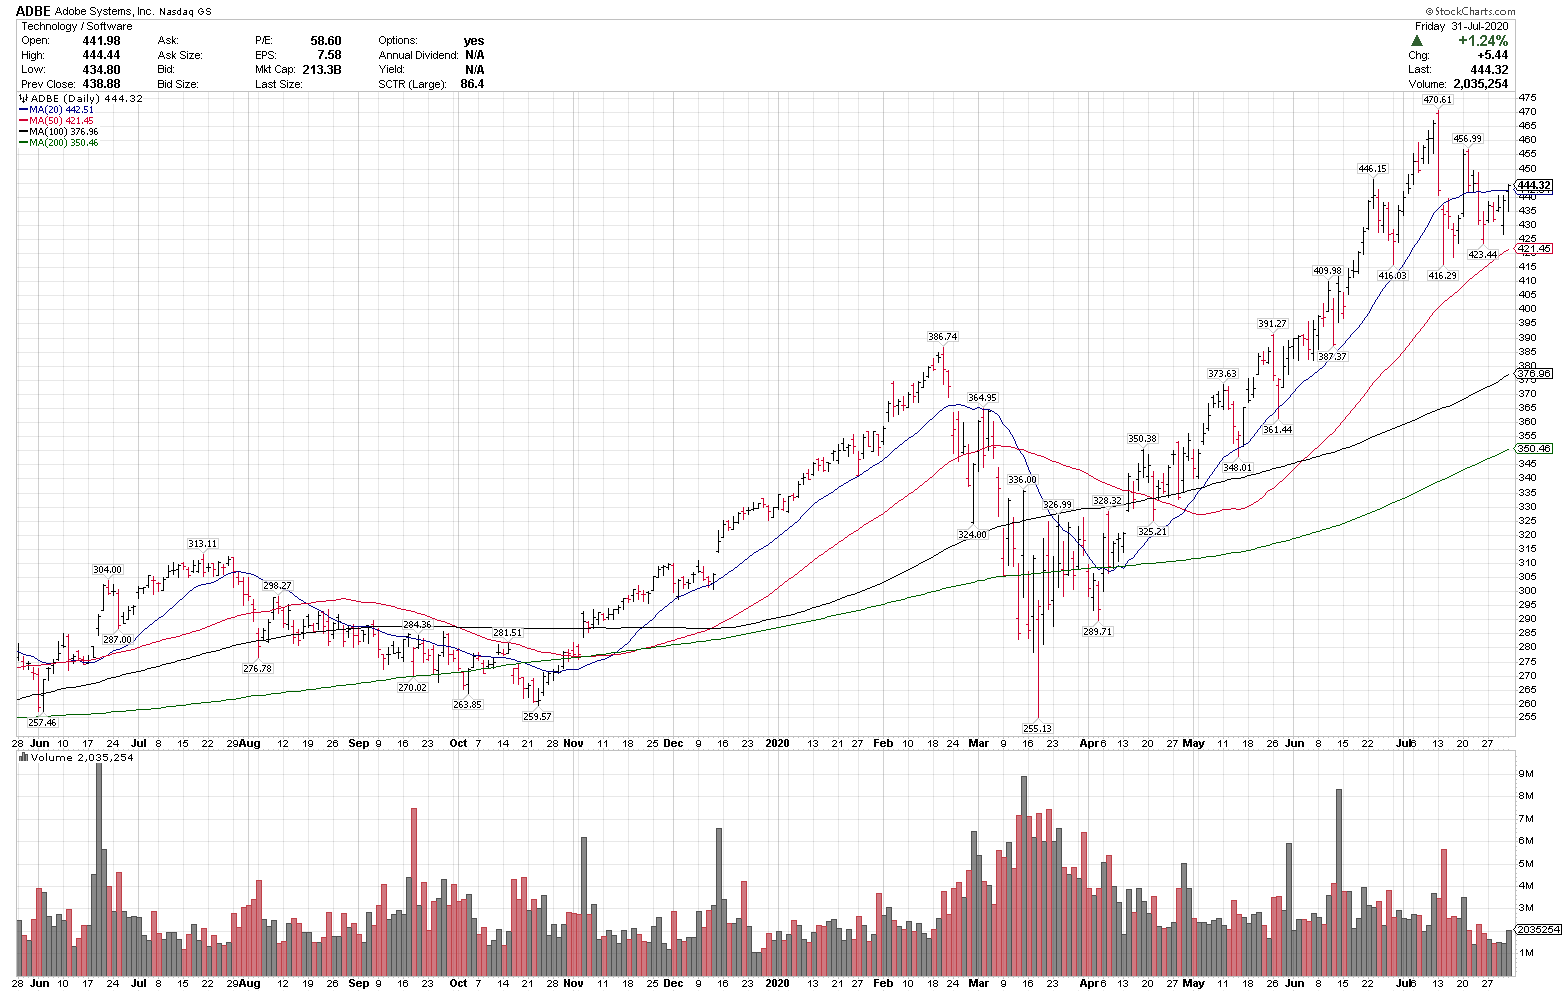
7/31/20
Tesla, TSLA
Close: 1487.49
Pre-market: 1523.14
Stop level: 1264.36
TSLA is in a primary uptrend above all key MAs, has been trading above the rising 20-sma since early April & recently completed a 23.8% pullback off the highs. A higher potential reward/risk stock. TSLA is a volatile stock, but staying over $1350 is key near term.
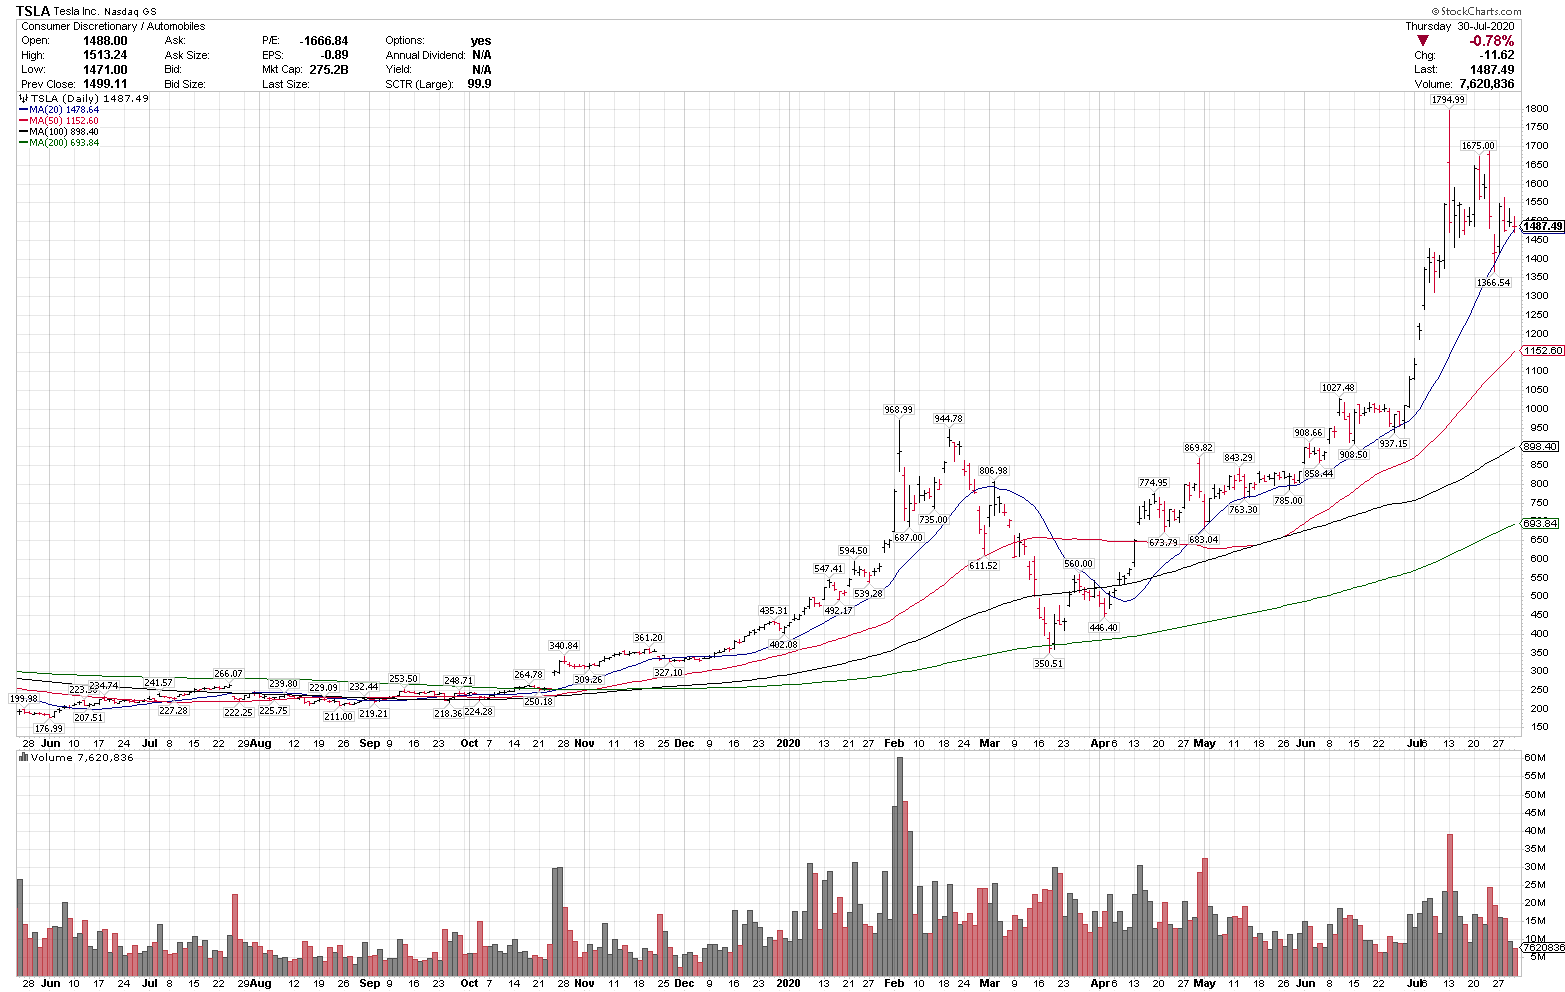
7/30/20
Kraft Heinz Co., KHC
Close: 35.57
Pre-market: 36.15
Stop level: 31.30
KHC is in a technical uptrend above the rising 20, 50, 100 & 200-sma. Price is breaking out near 18-month highs. There could be shorter term volatility after earnings here.
7/29/20
Crowdstrike, CRWD
Close: 105.73
Pre-market: 107.75
Stop level: 89.87 (15%)
CRWD is in a primary uptrend above the rising 50, 100 and 200-sma and recently completed an 18.1% pullback into the 50-sma. A volatile stock in a volatile market, but staying over $97 is key.
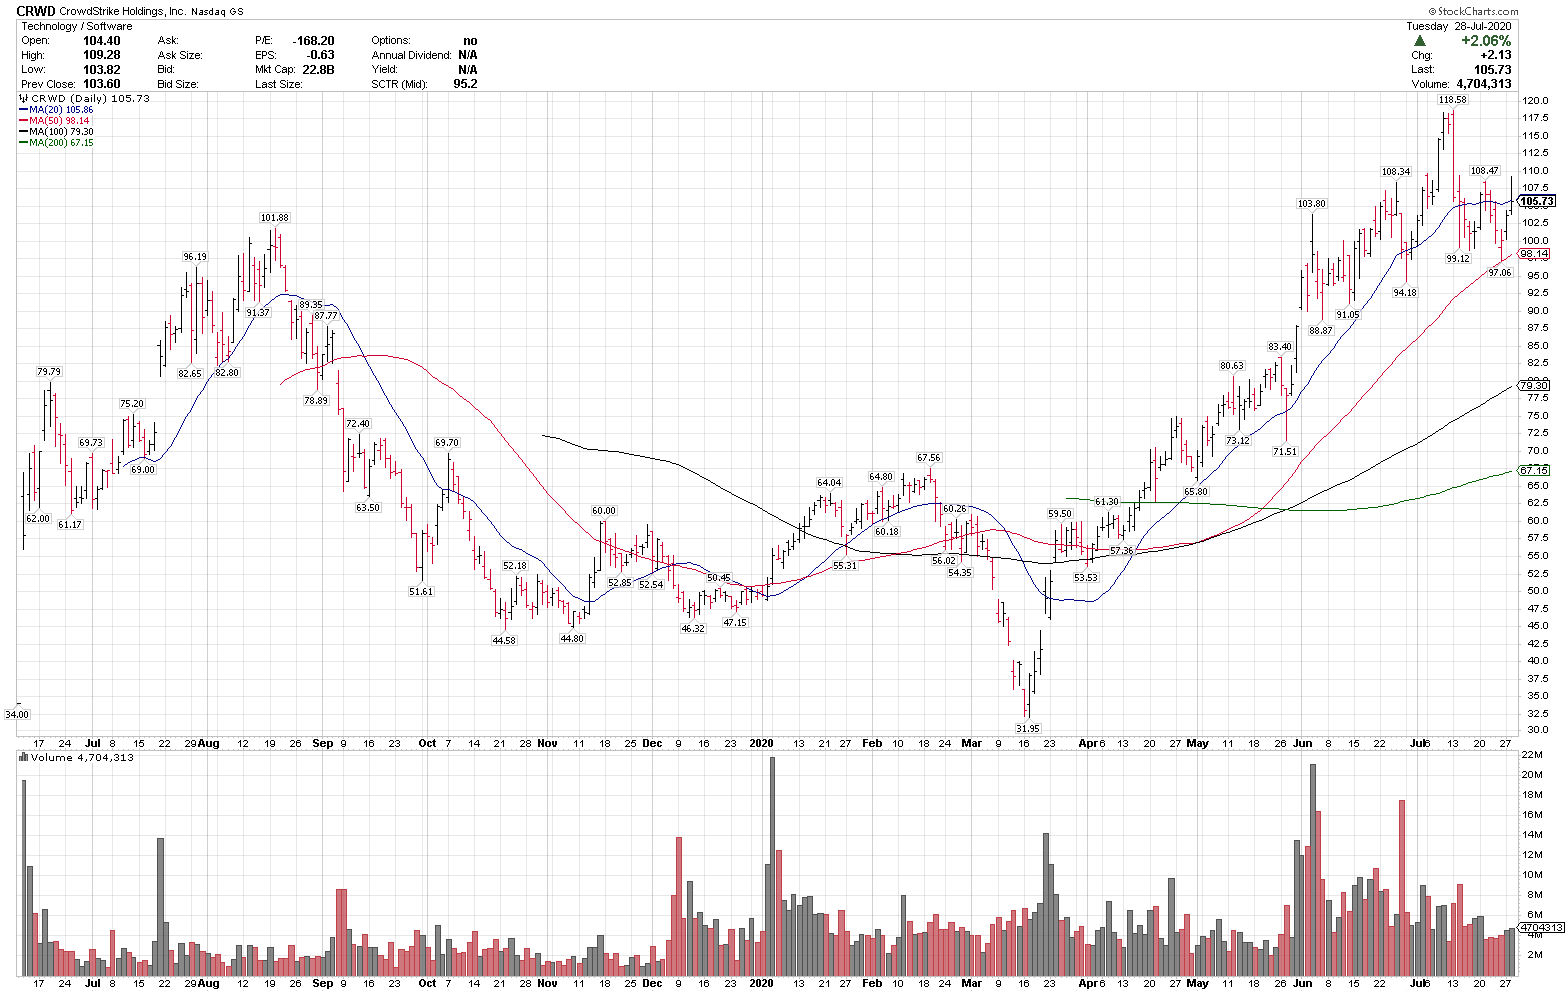
7/28/20
Netflix, NFLX
Pre-market: 494.20
Stop level: 423.40 (below the 100-sma)
NFLX is in a longer-term uptrend above the rising 50, 100 & 200-sma, and just completed an 18.7% pullback off all-time highs into the rising 50-sma. NFLX was posted on Sunday’s Top 20 list also.
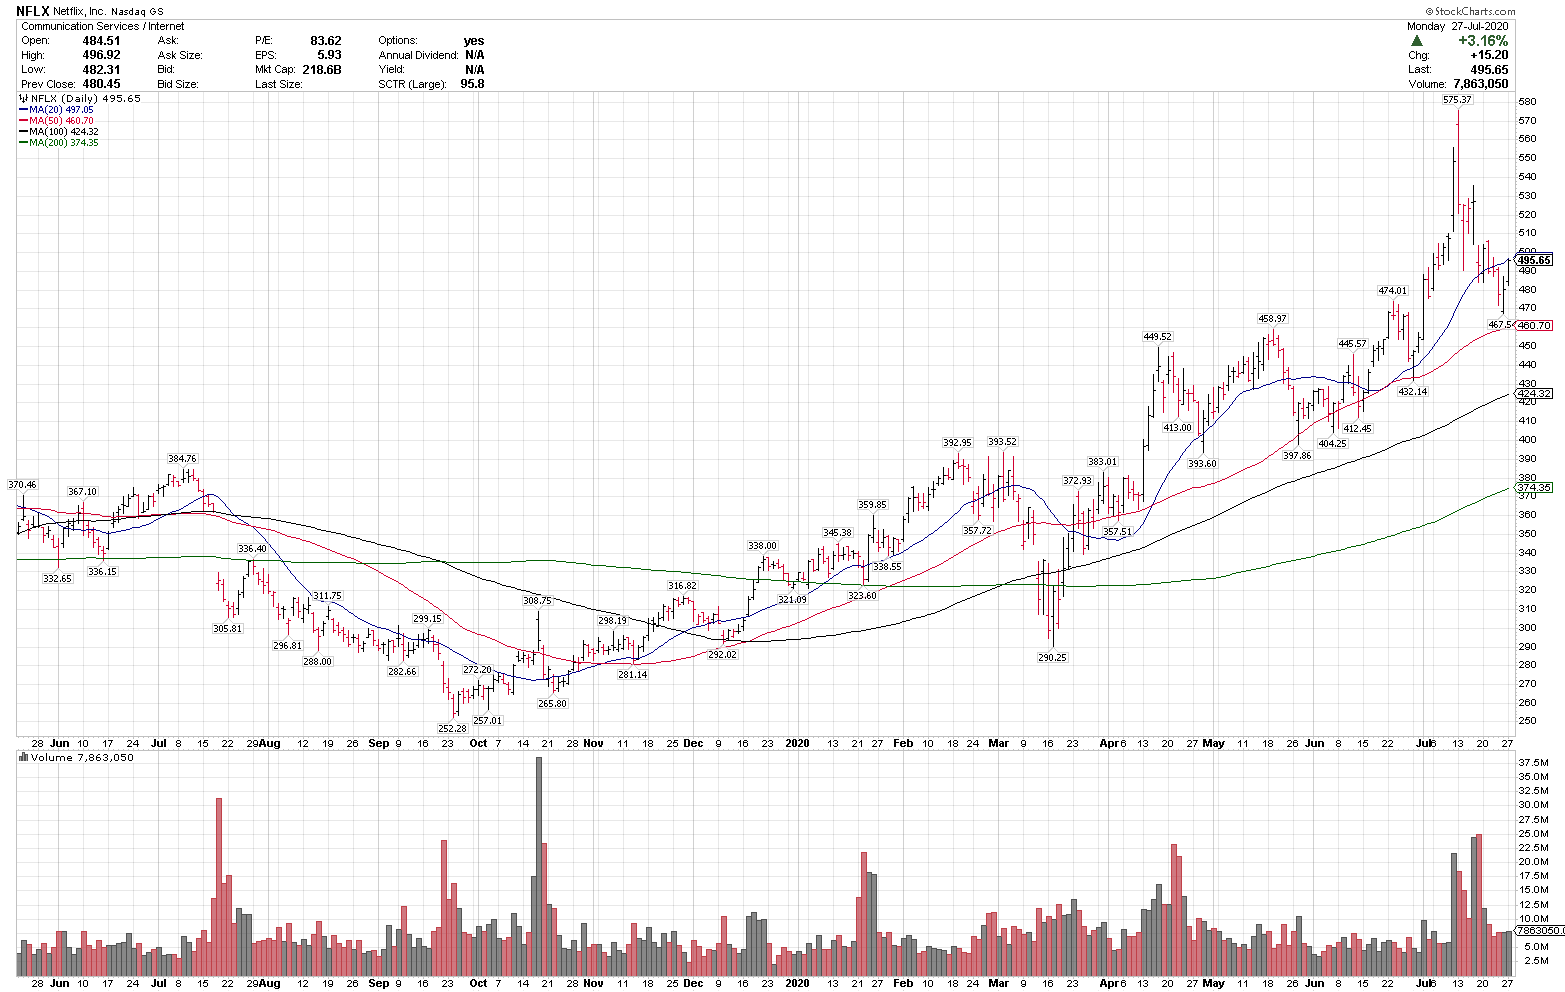
7/27/20
Freeport McMoRan, FCX
Close (when posted): 13.12
Pre-market: 13.35
Stop level: 11.08 (below the 50-sma)
FCX is in a technical uptrend above all key rising MAs and recently pulled back to the 20-sma. Over $14 could signal a new leg higher.
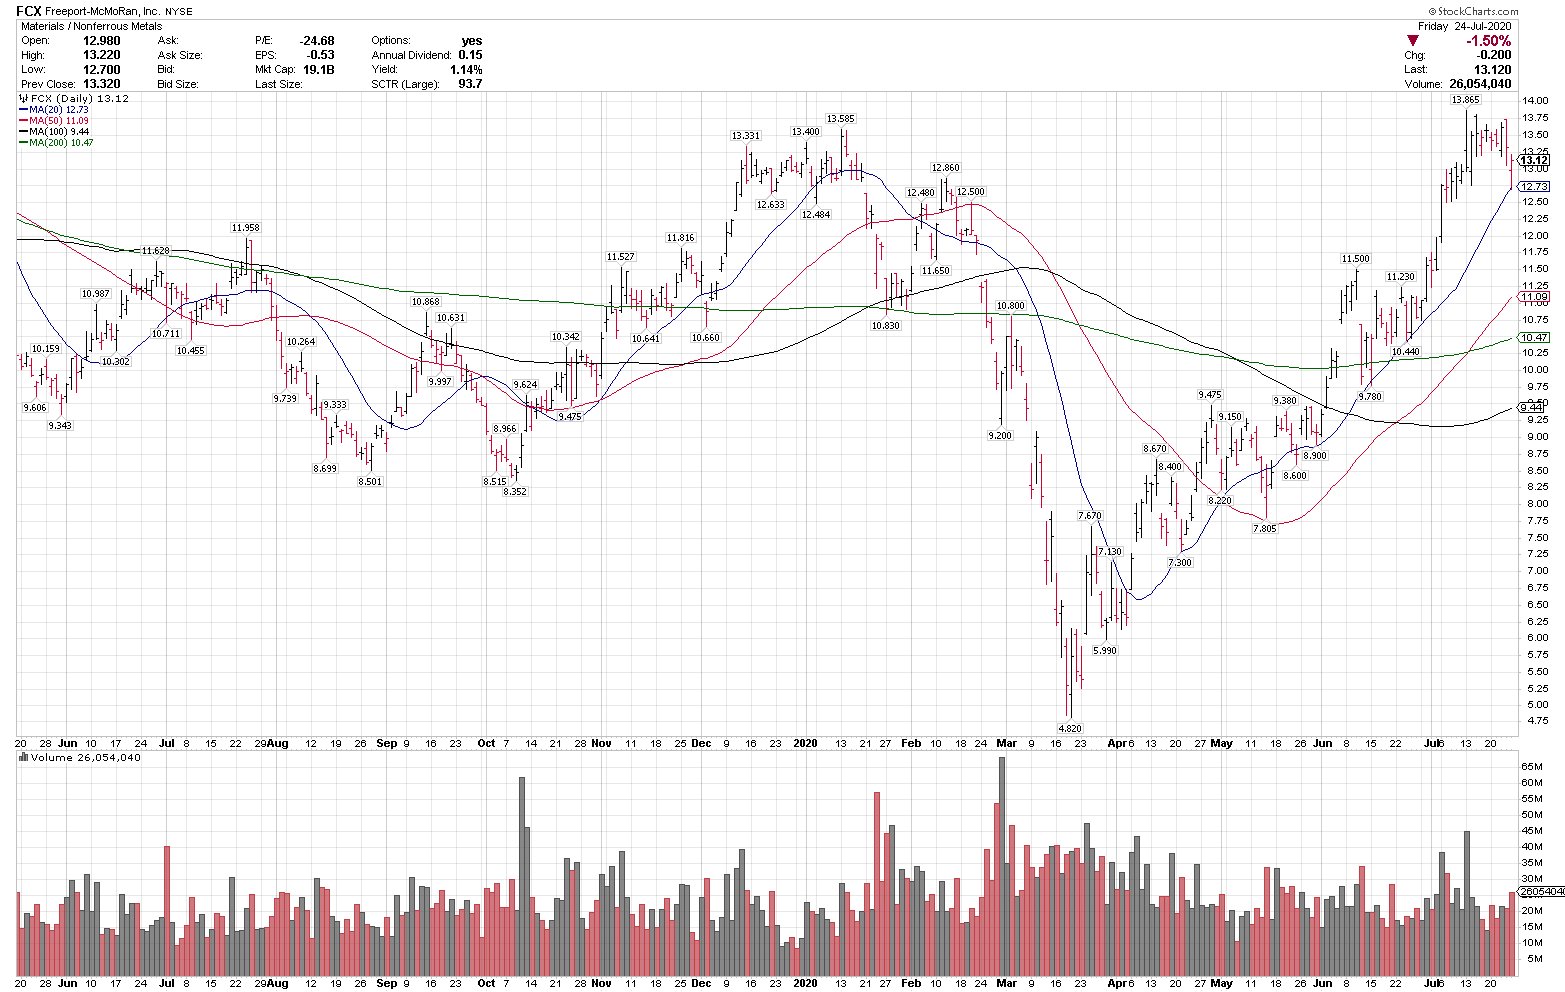
7/24/20
Cisco Systems, CSCO
Pre-market: 47.58
Stop level: 41.72
CSCO is in an uptrend above the rising 20, 50 and 100-sma, trading above a flat 200-sma and recently had a bullish 50/200-sma cross.
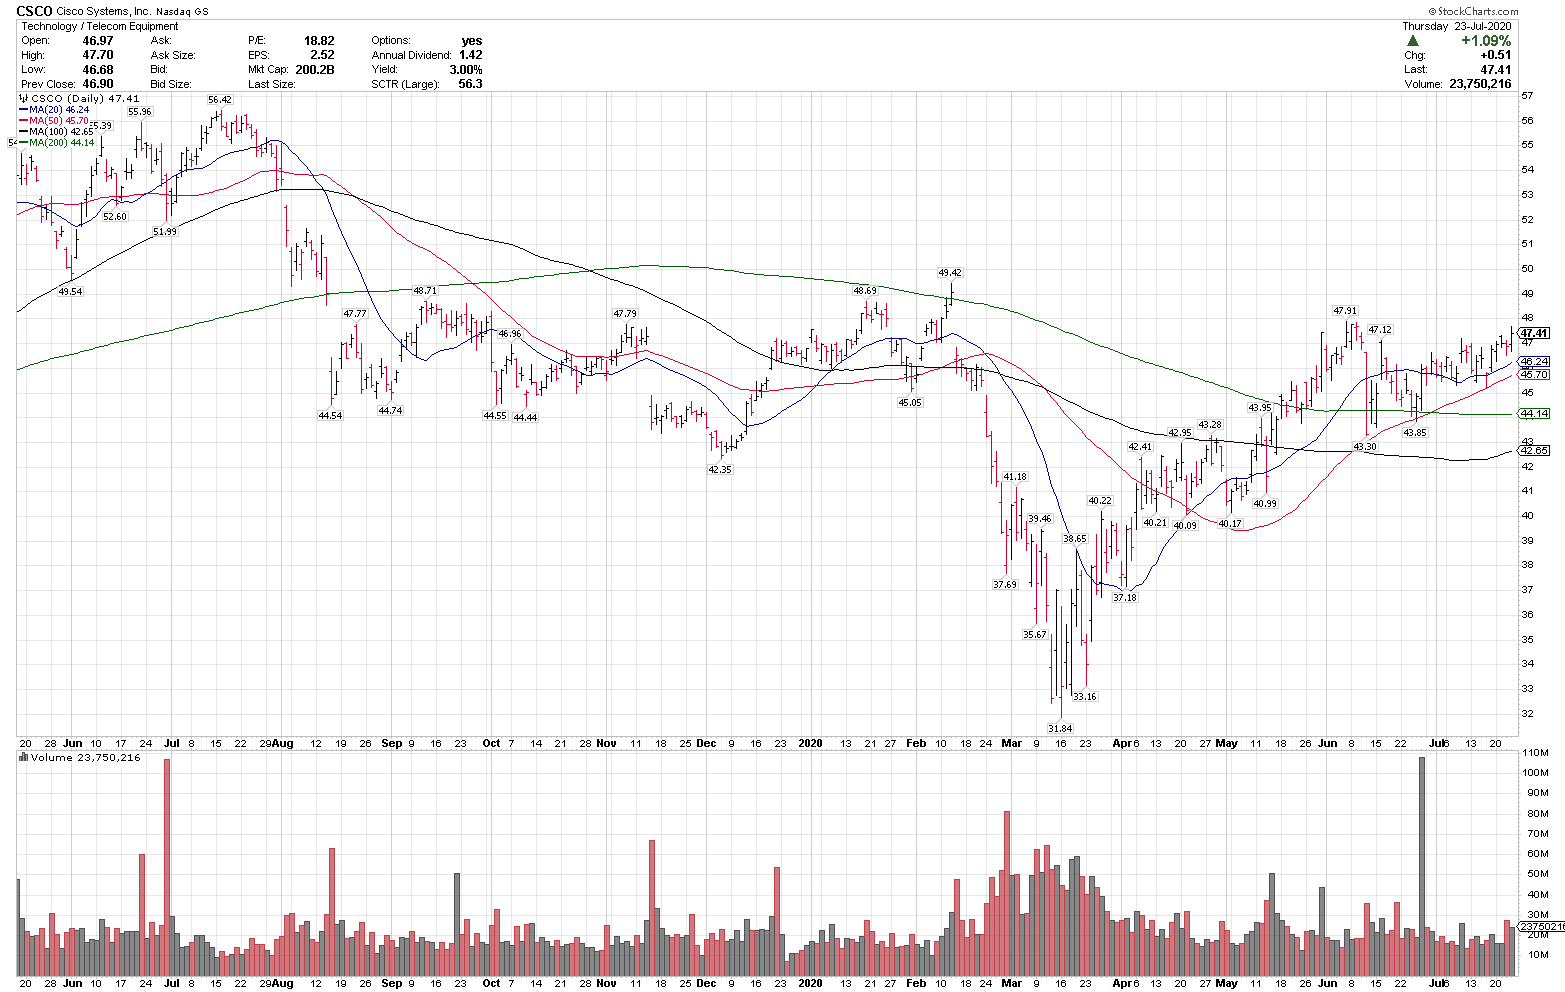
7/23/20
Microsoft, MSFT
Pre-market: 207.90
Stop level: 182.95
MSFT is in a technical uptrend above the rising 50, 100 and 200-sma and recently completed a 6.9% pullback from new highs. $200 and the rising 50-sma are key support levels on any further pullback. MSFT could see some volatility after reporting earnings yesterday, but is one of our top ranked longer term charts.
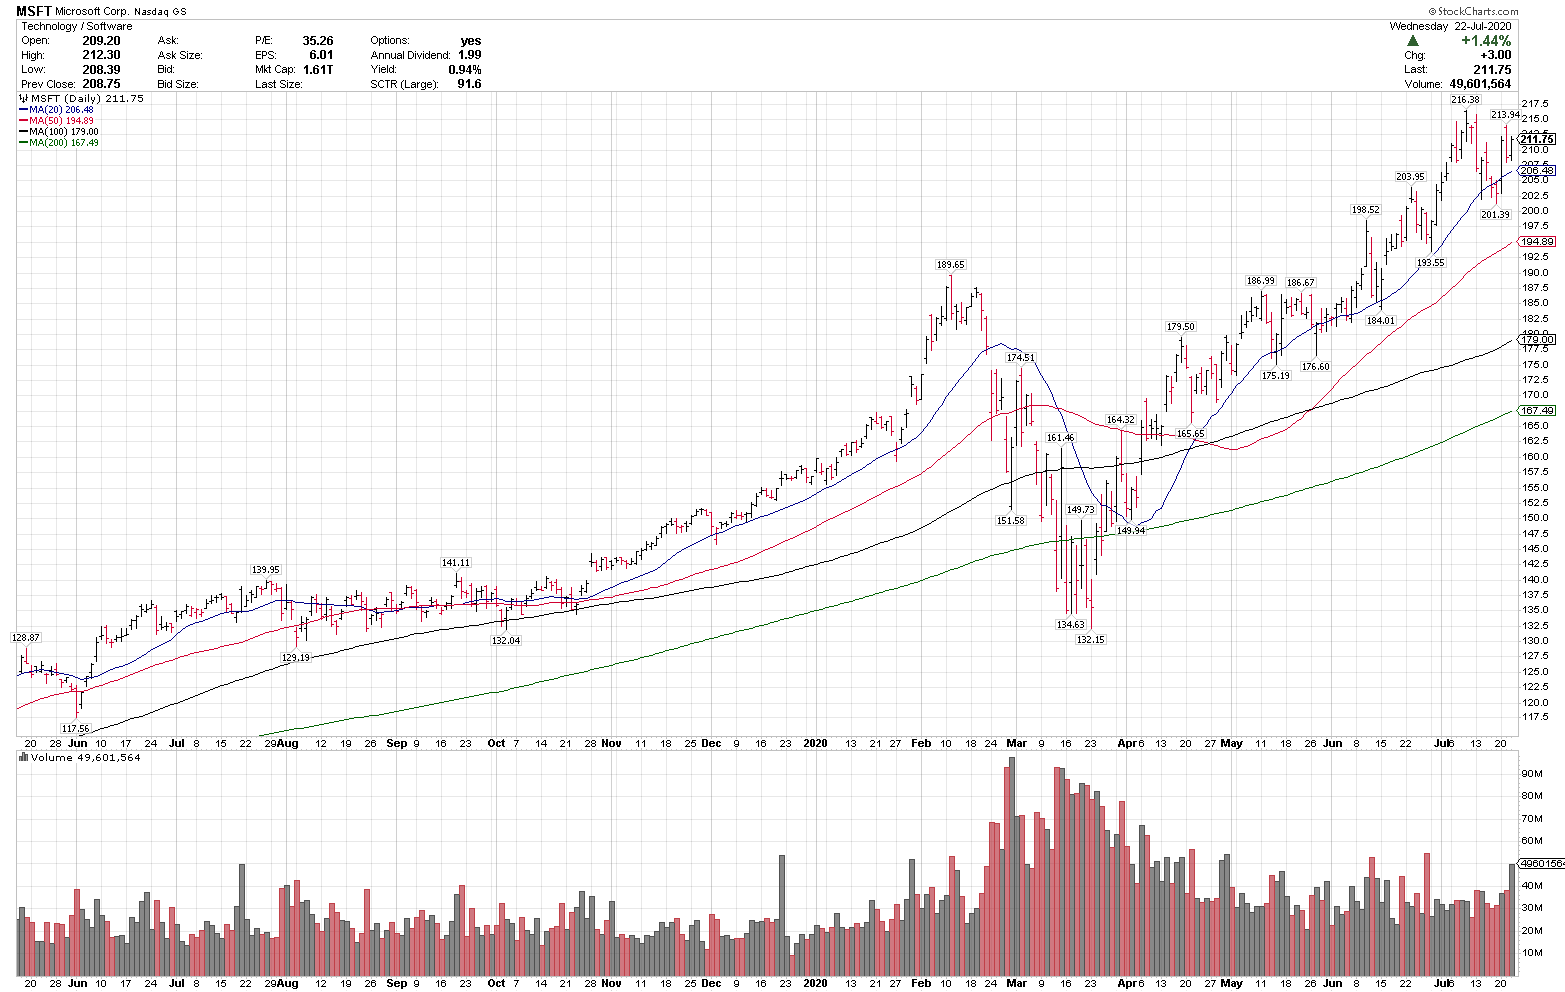
7/22/20
Vulcan Materials, VMC
Close/Pre-market: 126.96
Stop level: 111.72
VMC is in an intermediate-term uptrend above the rising 20, 50 and 100-sma and reclaimed the 200-sma yesterday. The rising 50-sma is key on any pullbacks.
7/21/20
Cloudflare, NET
Close: 38.37
Pre-market: 39.00
Stop level: 32.44 (under the 50-sma)
NET is in a technical uptrend above all key rising MAs and recently completed an 18.8% pullback. NET is a higher volatility cloud name and is on the Weekly Top 20 list.
7/20/20
PayPal, PYPL
Close: 173.92
Pre-mkt: 175.82
Stop level: 153.44
PYPL is in a technical uptrend above all key rising MA’s and recently had a 10.6% pullback off the high. The rising 50-sma below is a key trend gauge.
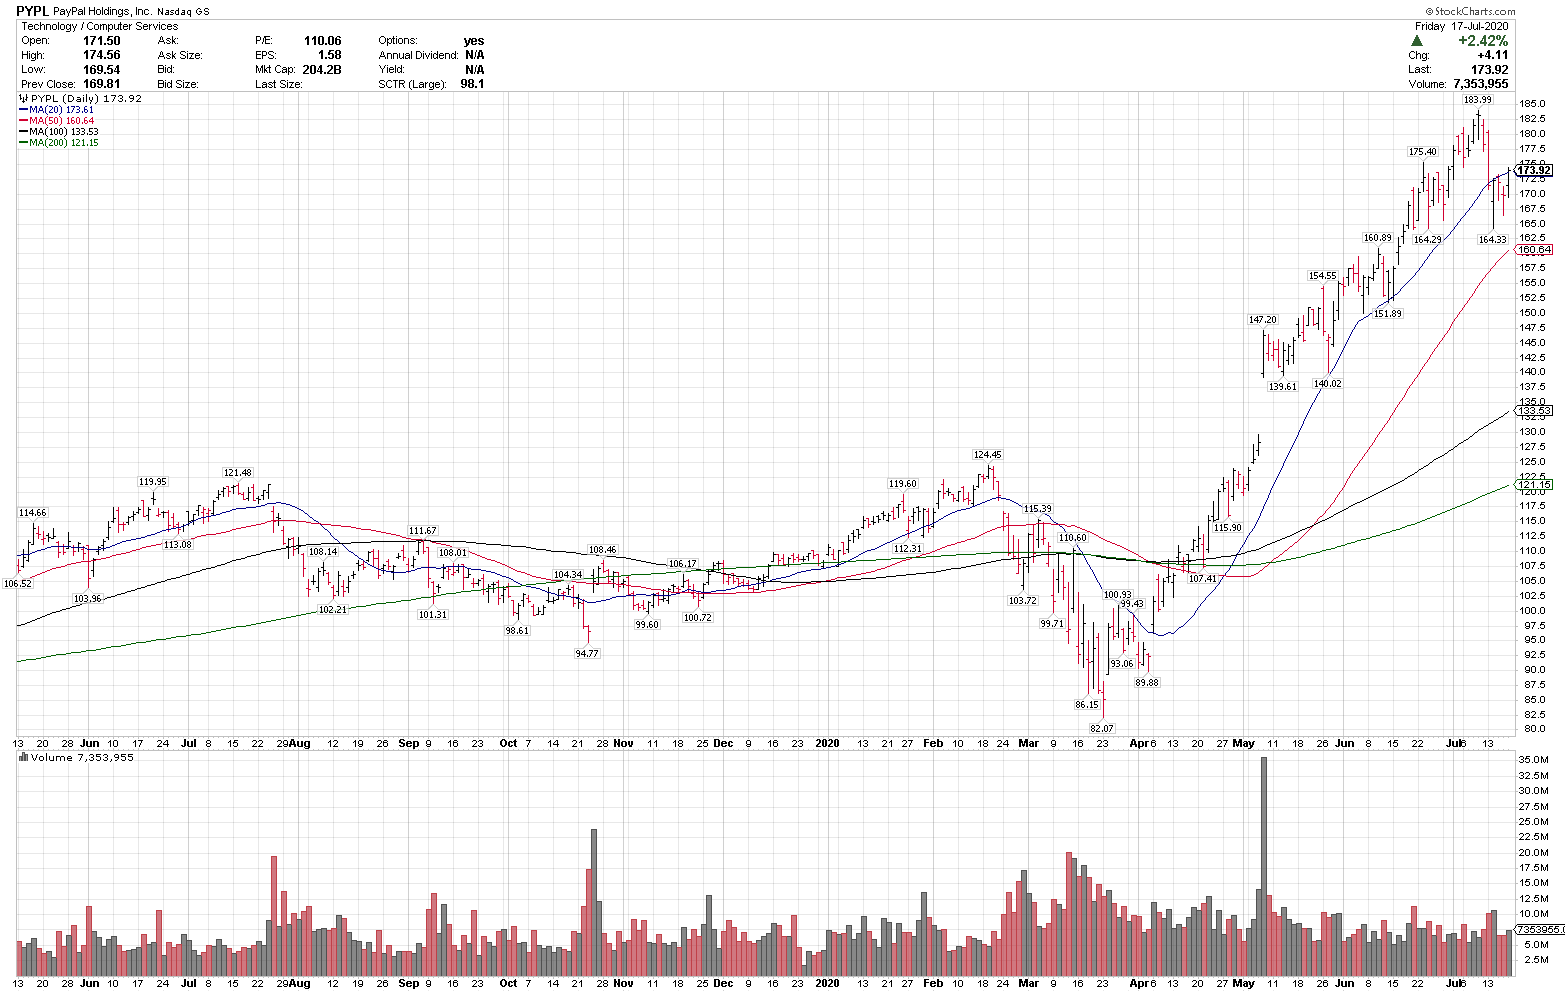
7/17/20
Pinterest, PINS
Close: 24.65
Pre-market: 24.99
Stop level: 20.94
PINS is in a technical uptrend, with a series of higher highs and higher lows, above the rising 20 & 50-sma. PINS recently had a bullish 50/200 sma cross and completed a 14.6% pullback.
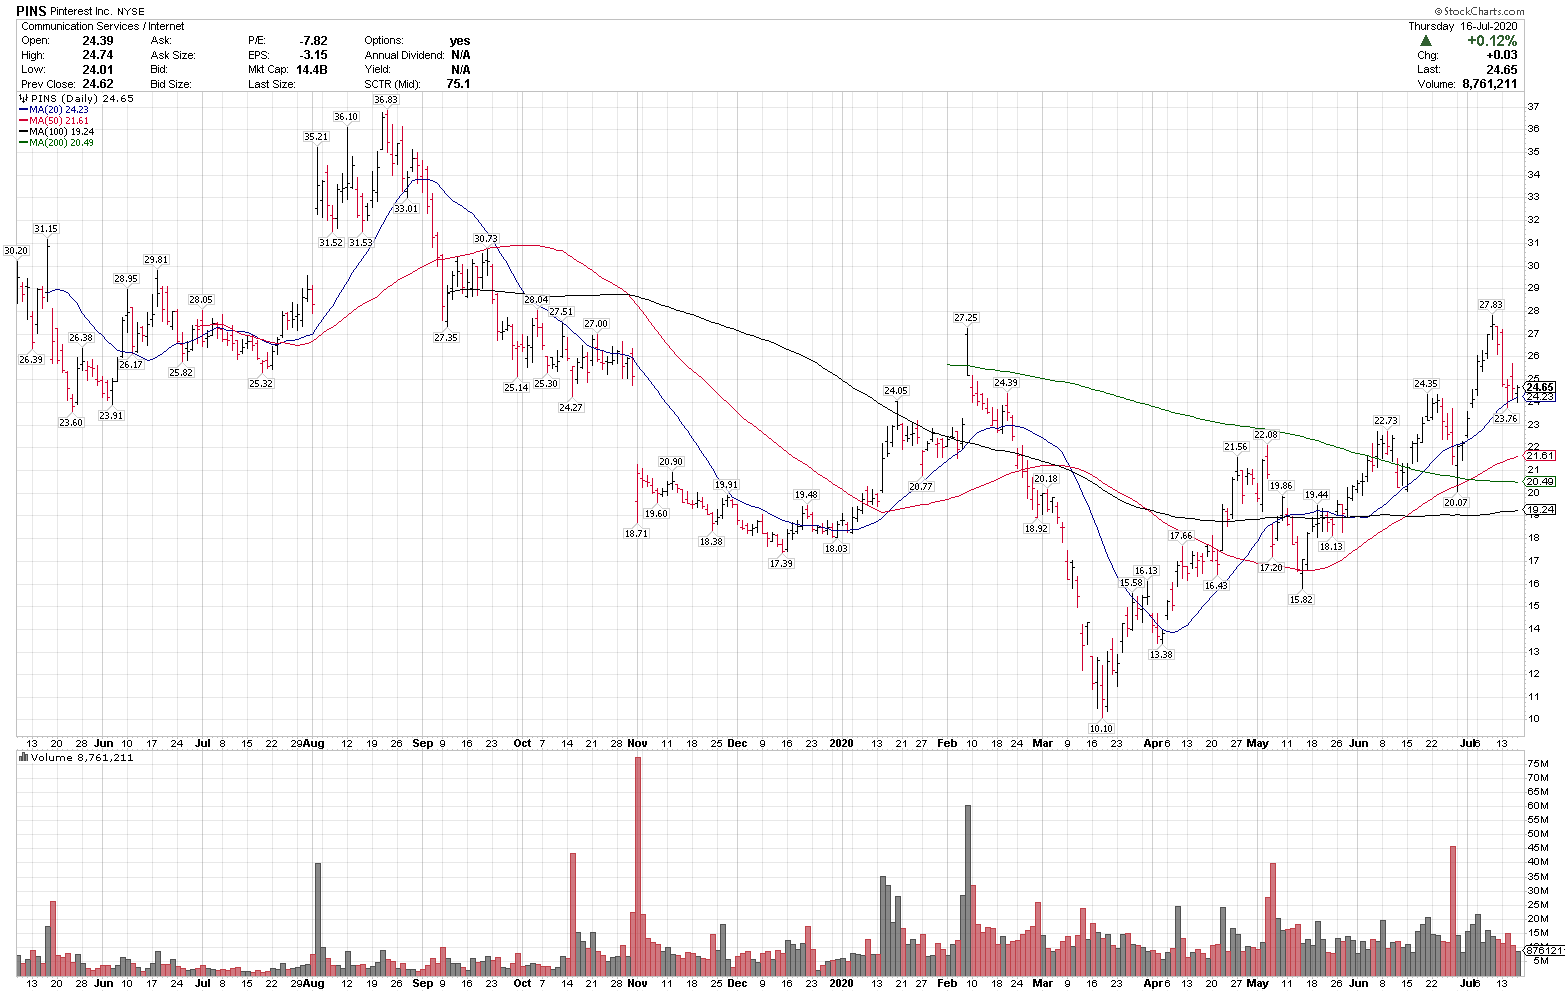
7/16/20
Eli Lilly & Co., LLY
Close/pre-market: 165.45
Stop level: 143.94
LLY is in a primary uptrend above all key rising MAs and recently pulled back 5.6% off new highs.
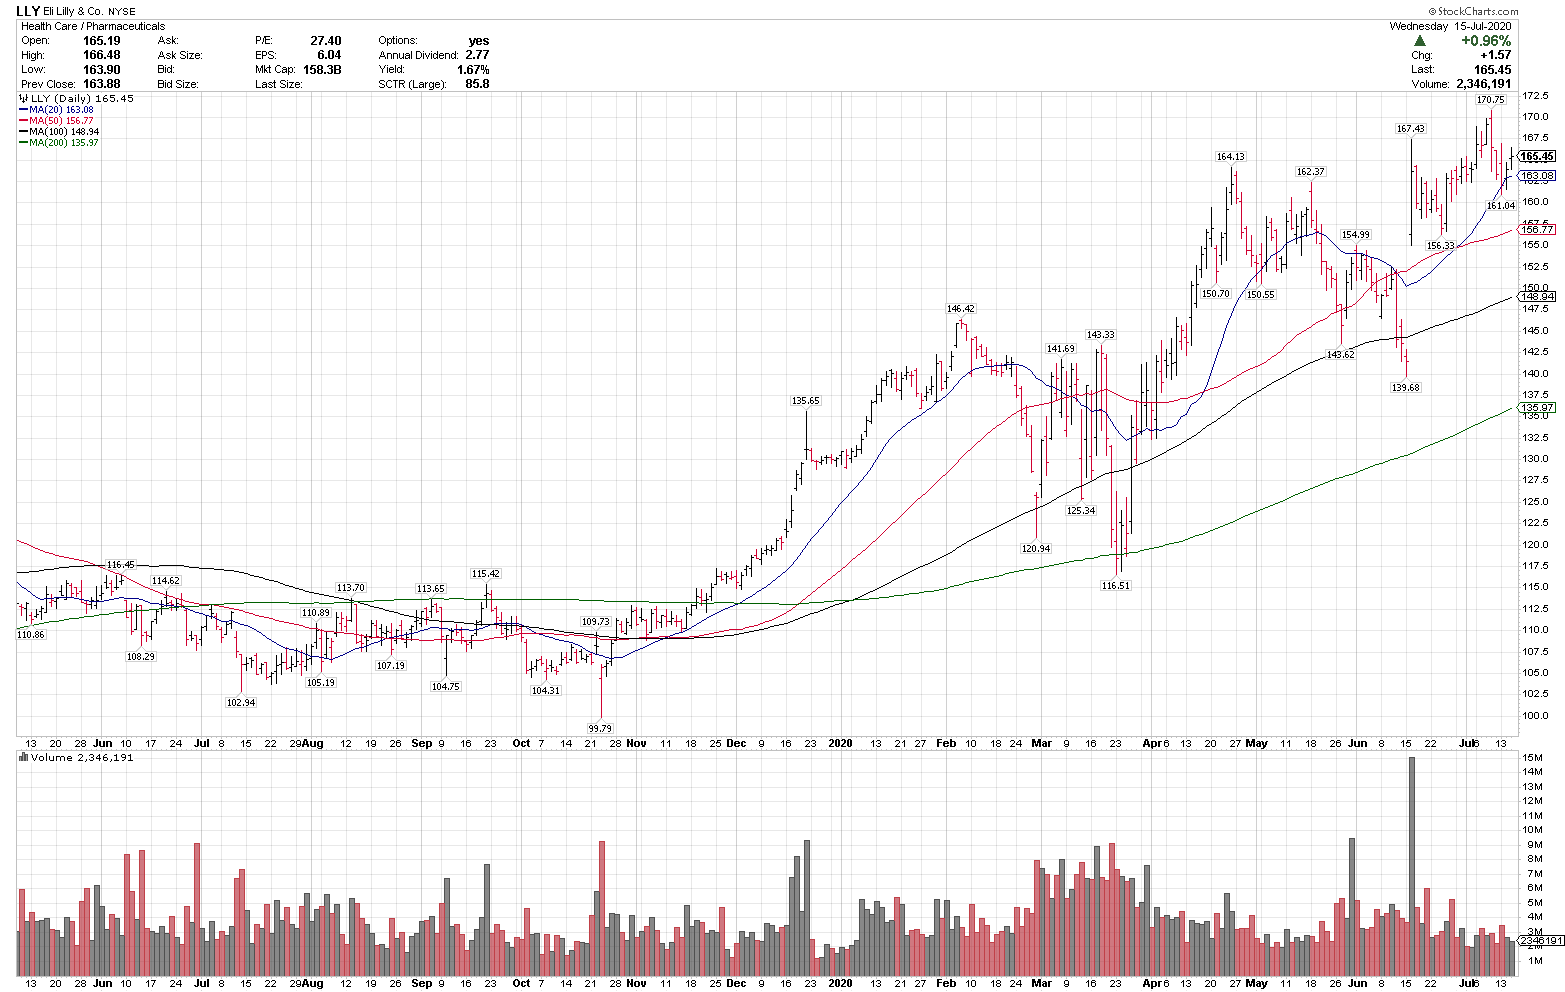
7/15/20
DexCom Inc., DXCM
Close: 410.34
Pre-market: 412.00
Stop level: 15%
DXCM is a top ranked healthcare name in a primary uptrend above all key rising MAs. DXCM recently completed a 14.6% pullback off all time highs.
7/14/20
Facebook, FB
Pre-market: 239.25
Stop level: 209.76
FB is in a primary uptrend above all key rising MAs and tested a new high breakout yesterday. 220-225 is key support on any pullbacks.
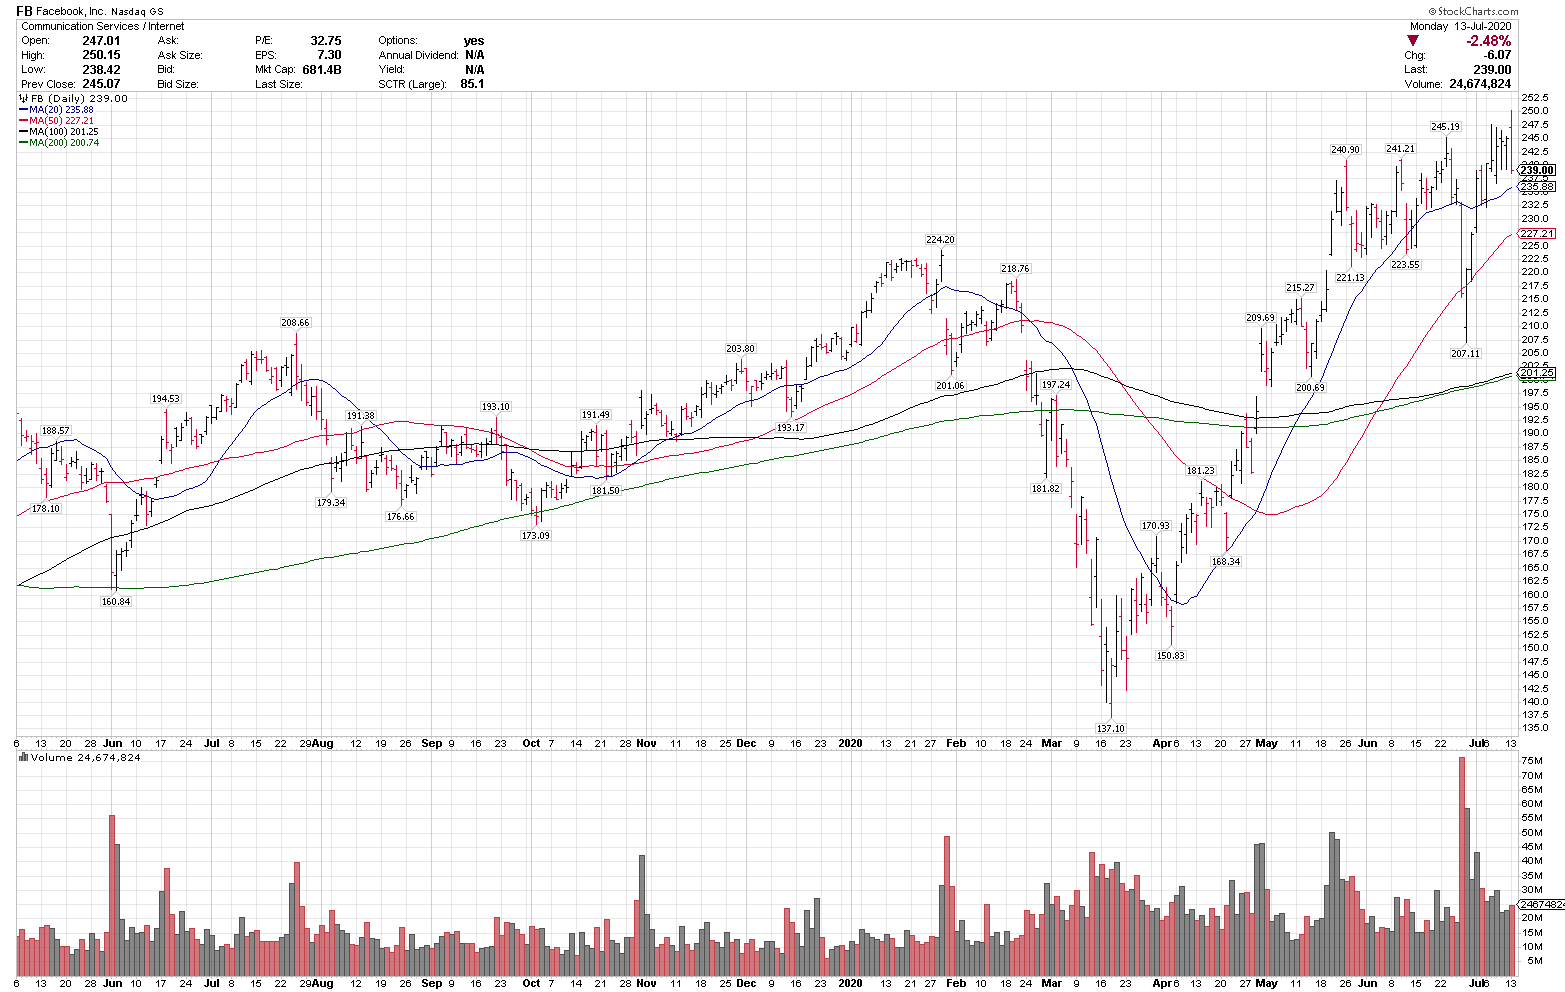
7/13/20
VRTX
Close: 294.65
Pre-mkt: 295.02
Stop level: 258.79 (below the rising 100-sma)
VRTX is in a primary uptrend above all key rising MAs and recently completed a 4.9% pullback off all-time highs. VRTX is on this week’s Top 20 list.
7/10/20
Match Group, MTCH
Pre-market: 96.32
Stop level: 81.87
MTCH is in a primary uptrend above all key rising MAs and recently completed a 15% pullback off all-time highs. 88-90 is key support on any pullbacks.
7/09/20
Advanced Micro Devices, AMD
Pre-market: 53.46
Stop level: 46.94
AMD has been consolidating over the last few weeks after a breakout attempt, and may continue to do so here, but could offer good potential reward vs risk at this level. $48 and $50 are key on any pullbacks.
7/08/20
Ciena, $CIEN
Close: 55.90
Stop level: 49.19
$CIEN is in a primary uptrend above all rising MAs and recently made a new 52-week+ high. It could consolidate over the $53 range but is setting up well here. The rising 50-sma is a key trend gauge.
7/07/20
DR Horton, DHI
Pre-market: 55.52
Stop level: 48.85
DHI is in a primary uptrend above the rising 50 and 200-sma and recently completed an 11% pullback. The rising 50-sma is key in the intermediate trend.

7/05/20
Chart of the Week
Alibaba, BABA
Close: 223.60
Stop: 196.46
BABA is in a primary uptrend, above the rising 20, 50 and 200-day moving averages.
– The rising moving averages indicate a strong uptrend on multiple time frames.
– The stock recently consolidated 8.3% and moved higher off the rising 50-dma, a sign of an intermediate term uptrend as well.
– BABA is on our newly published Top 20 Weekly Best Stock Ideas List this week for our subscribers.
– If BABA can clear 235, it could signal a new leg higher.
– Thursday’s Chart is posted below as markets were closed on Friday, July 3.
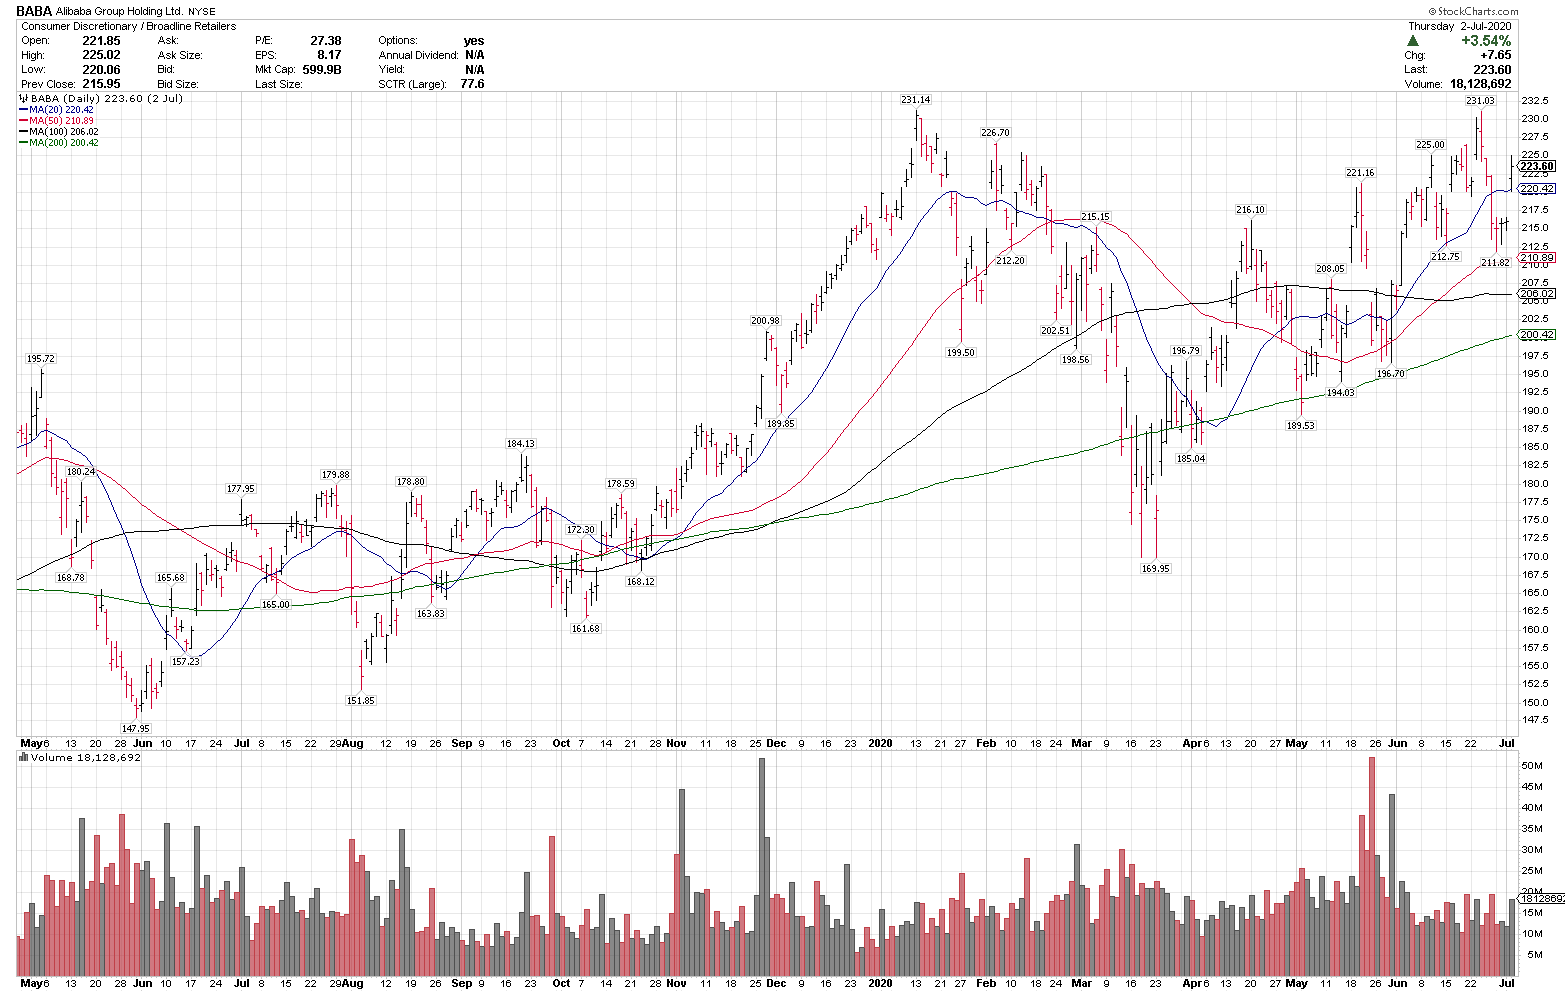
7/02/20
Nvidia, NVDA
Close: 381.20
Pre-market: 383.94
Stop level: 334.68 (below the 50-sma)
NVDA is in a strong uptrend above all key rising MAs, and recently completed a 7% pullback off highs.
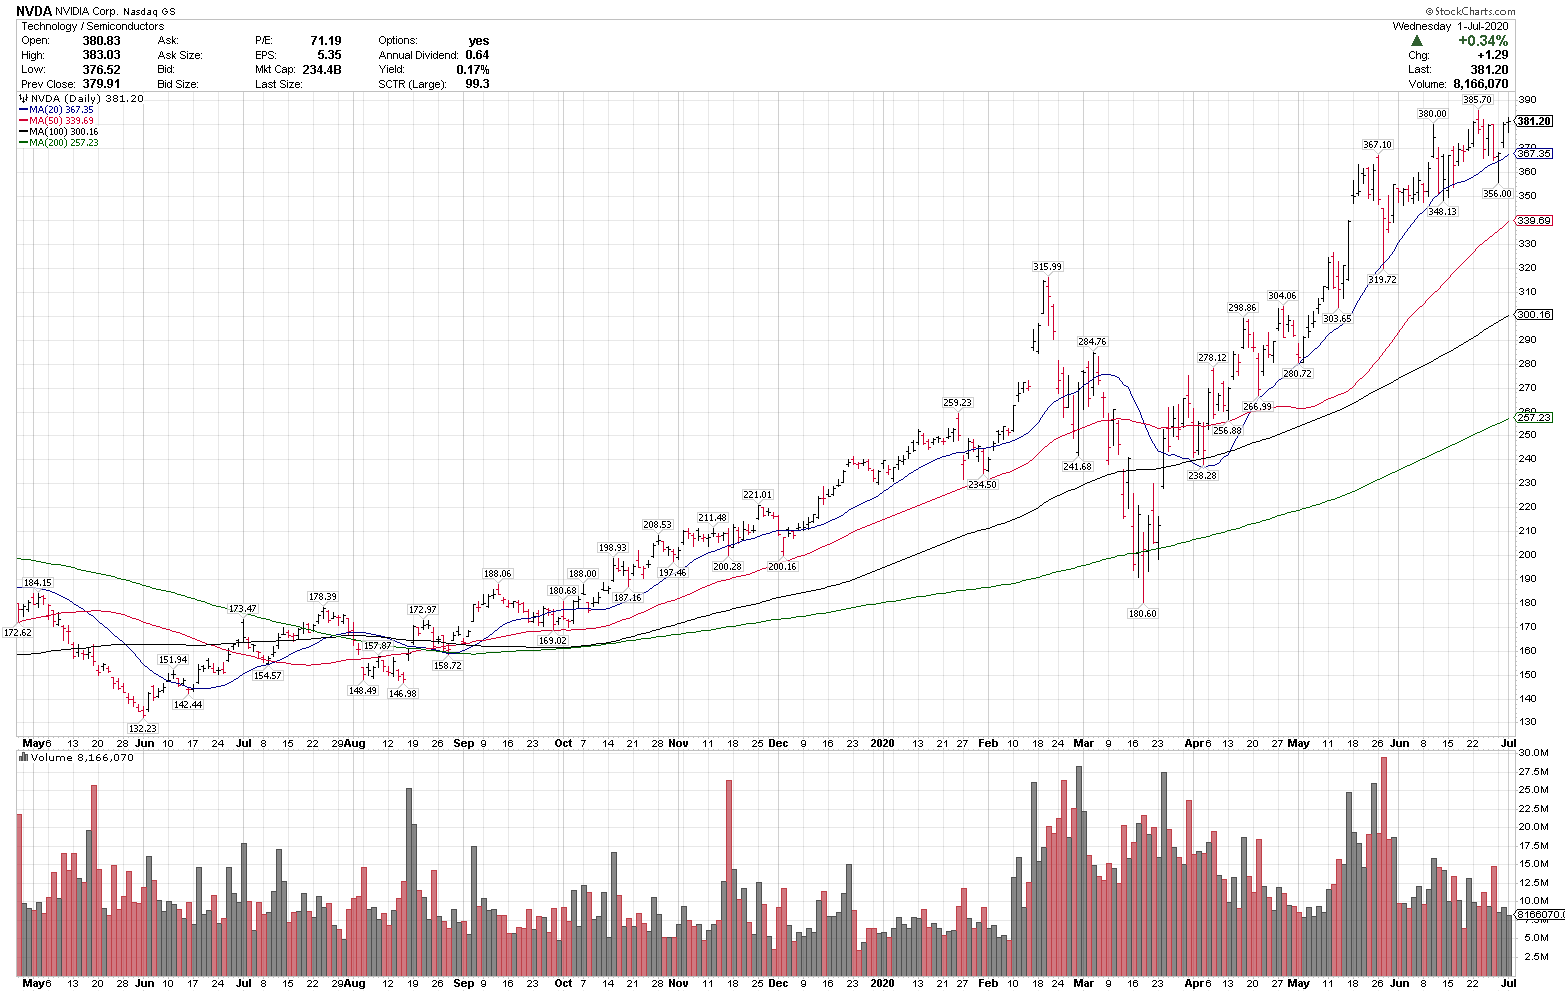
7/01/20
Otis Worldwide, OTIS
Close: 56.86
Stop level: 49.73
OTIS is in an intermediate term uptrend above the rising 50-sma and recent completed a 12.4% pullback. The rising 50-sma is a key trend gauge here.
6/30/20
Lam Research Corp., LRCX
$LRCX
Close: 308.46
Pre-mkt: 311.50
Stop level: 267.44
$LRCX is in a primary uptrend above all key MAs, and a rising 20, 50 and 200-sma. $LRCX recently completed a 7.6% pullback.
6/29/20
AbbVie, ABBV
Close: 96.13
Stop level: 84.59 (12%)
$ABBV is in a primary uptrend above all key MAs, and testing the rising 20-sma.
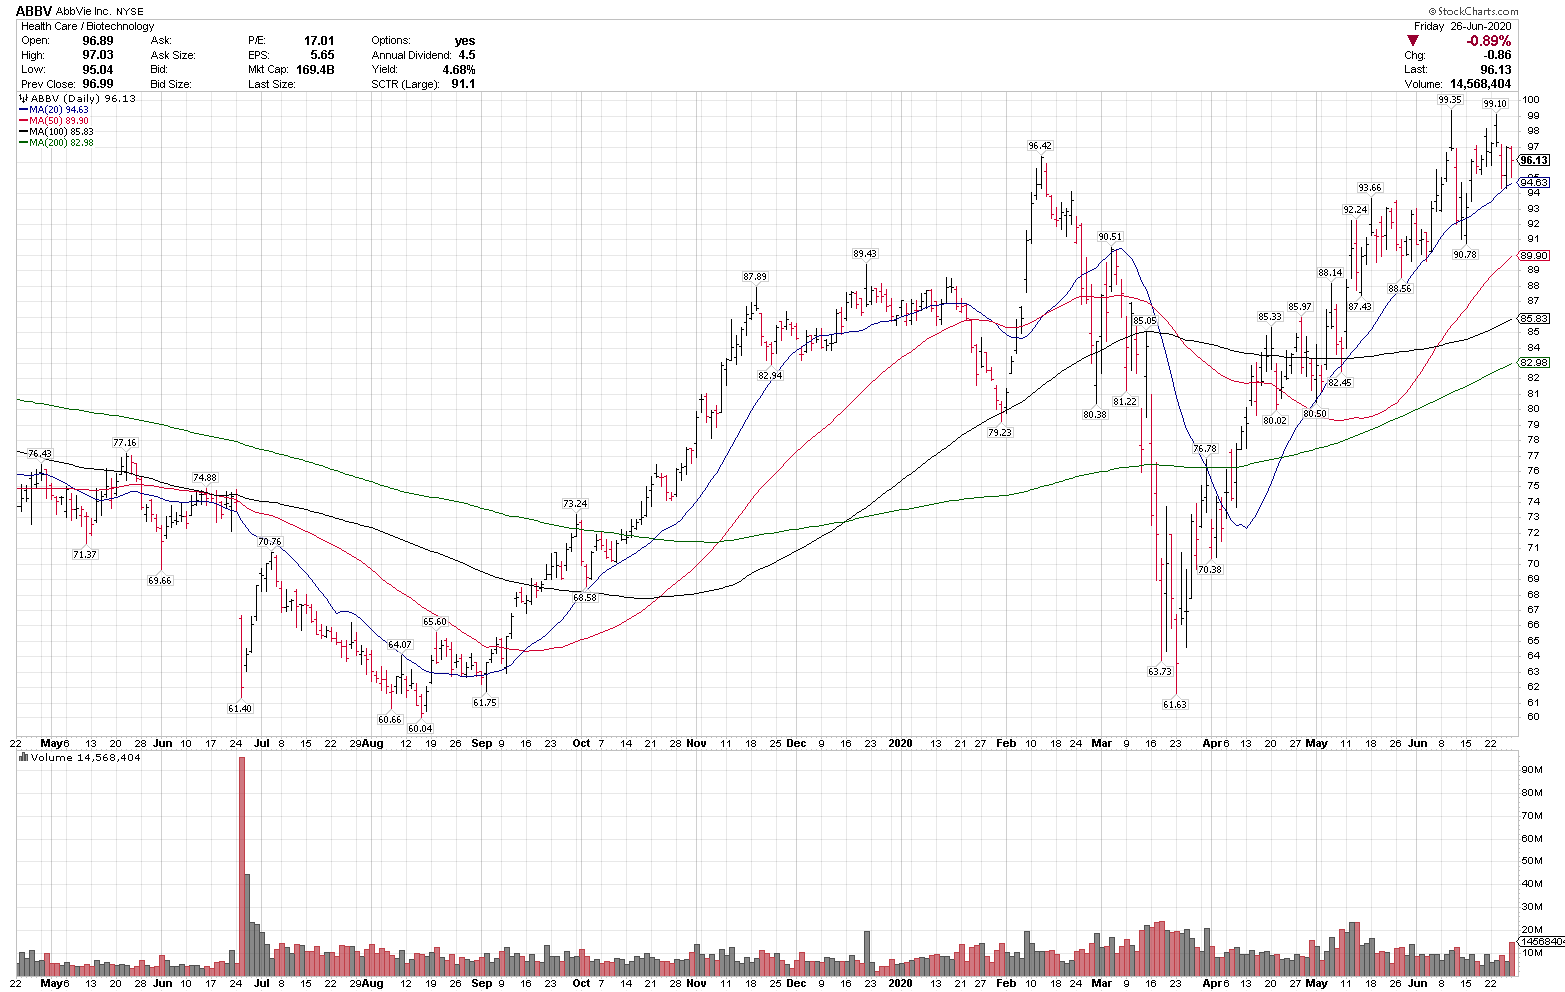
6/26/20
CrowdStrike, CRWD
Close: 105.71
Pre-market: 104.50
Stop level: 88.82
CRWD is in a primary uptrend above all key MAs, and recently completed a 6% pullback off all time highs. It is also breaking out over the $101.88 high base from August. The 20-sma has been a key trend gauge recently.
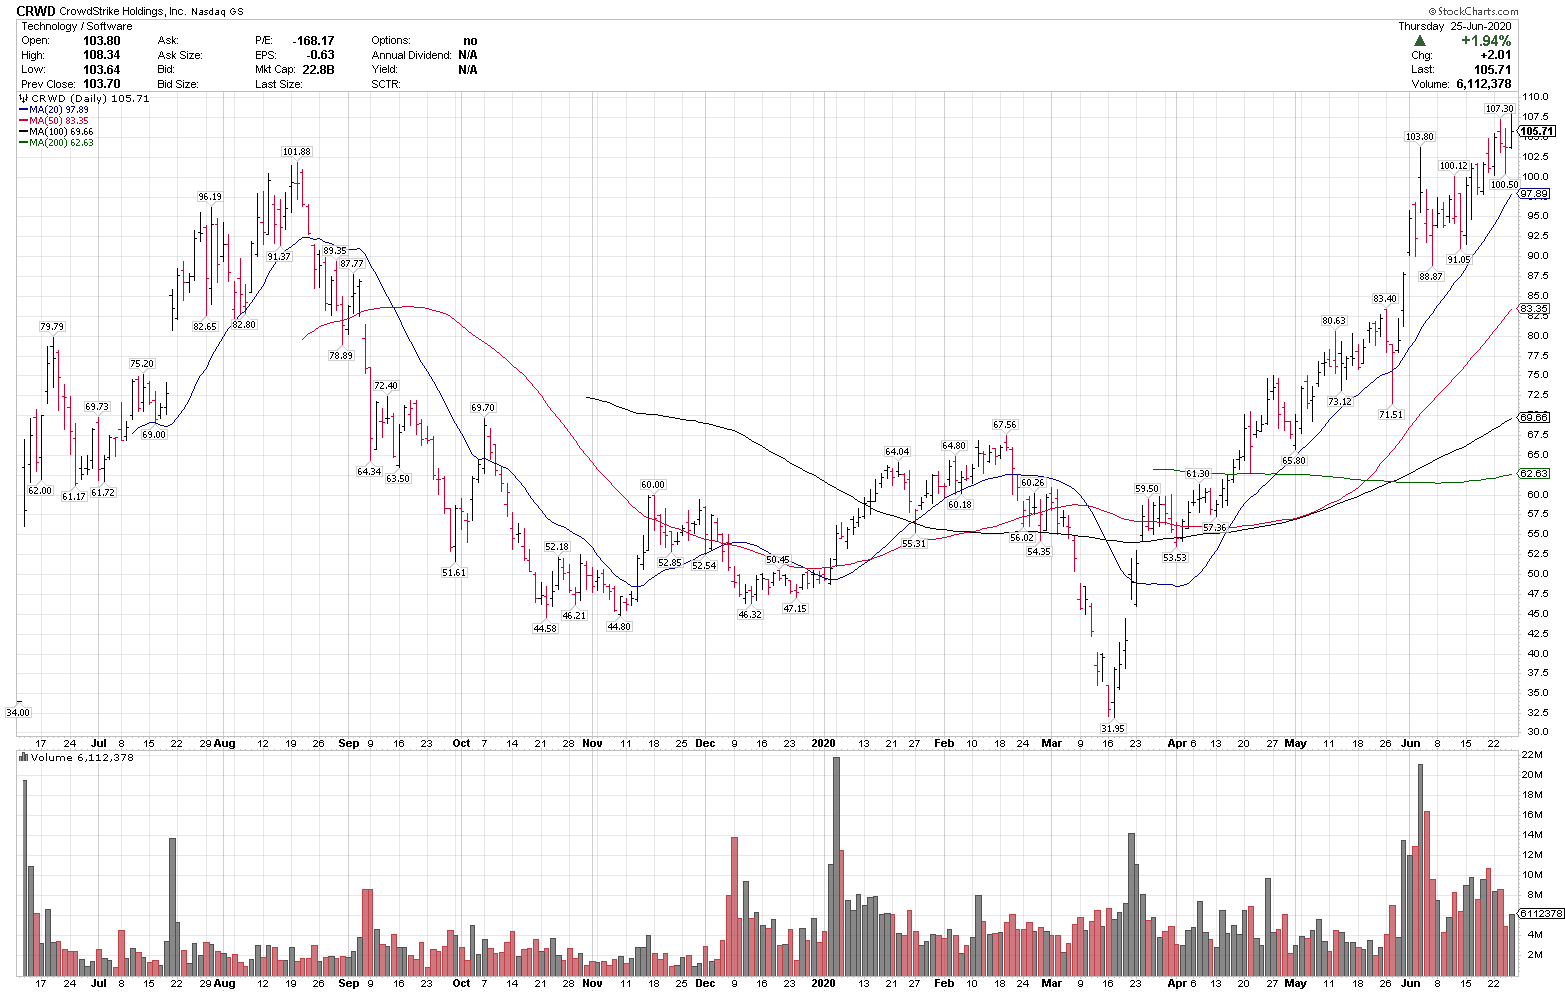
6/25/20
Global X Cloud Computing ETF, CLOU
Close: 21.07
Stop level: 18.54
CLOU is in a primary uptrend above all key MAs, and the group is one of the technically best positioned currently. Staying over the rising 50-sma is key. Top holdings: TWLO, ZM, ZS, COUP, SHOP. Overall market direction could be a factor in most charts.
6/24/20
Google, GOOGL
Close: 1463.98
Pre-mkt: 1458.00
Stop level: 1282.74
GOOGL in a primary uptrend above all rising MAs and recently completed a 5.9% pullback.
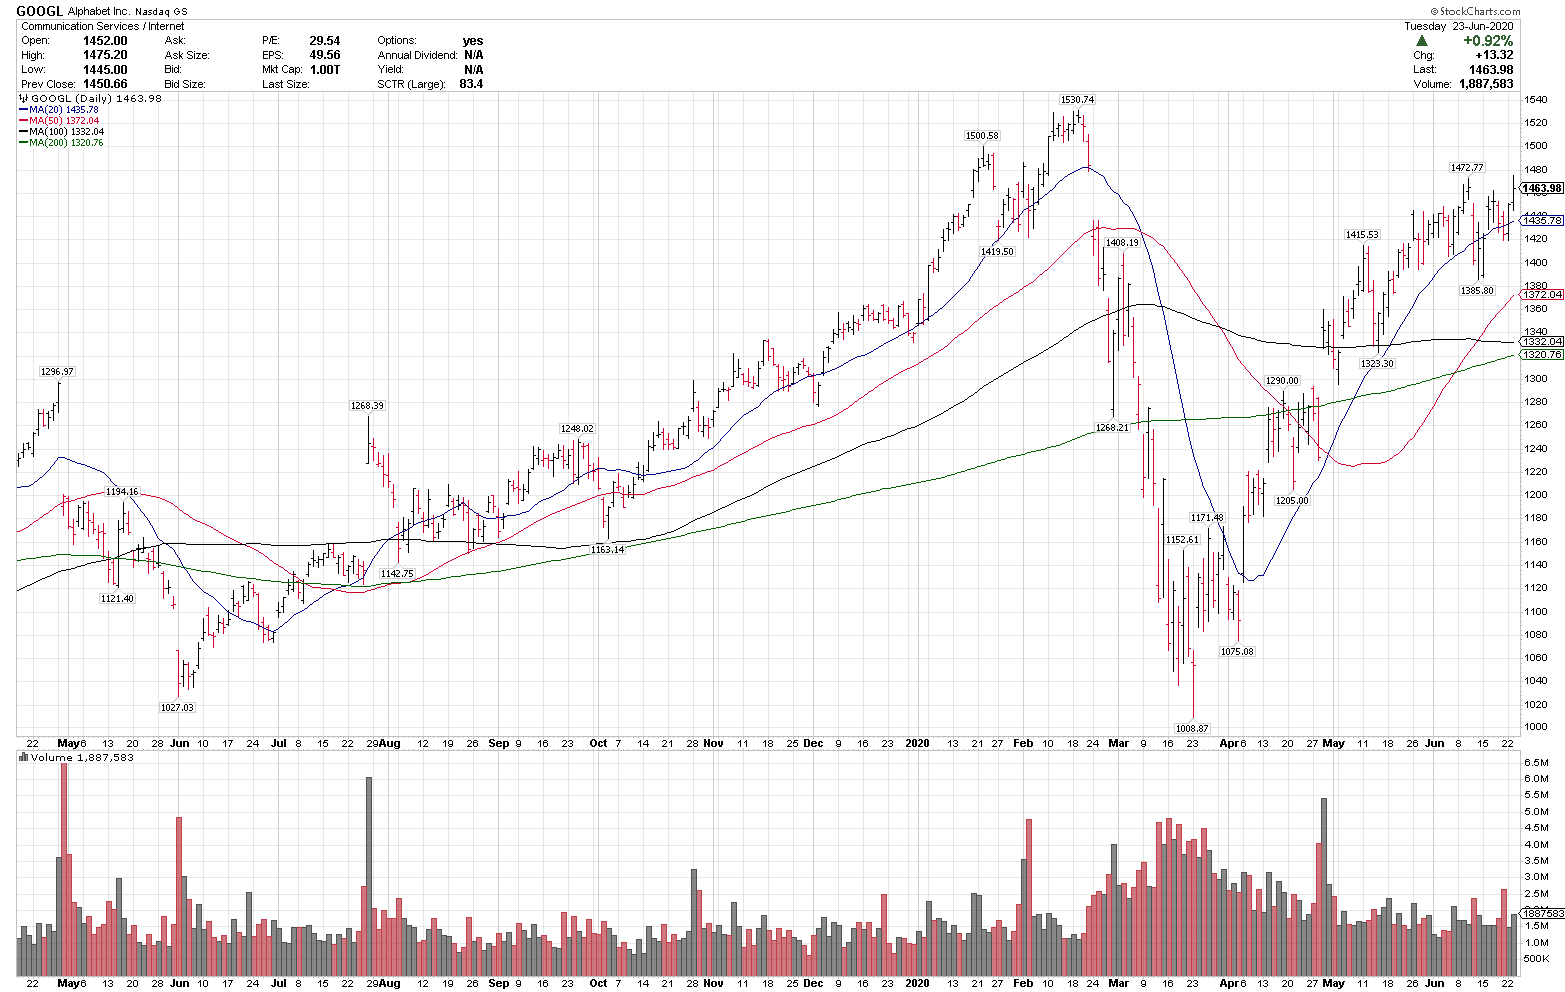
6/23/20
EBAY Inc., EBAY
Close: 49.16
Pre-mkt: 49.46
Stop level: 42.64
EBAY is in a primary uptrend above all key MAs, and recently completed a 10% pullback after breaking out to a new all-time high. The rising 50-sma is a key trend gauge here.
6/22/20
Wheaton Precious Metals, WPM
When posted: 41.92
Pre-market: 42.53
Stop level: 35.88
WPM is in an uptrend above all key MAs and recently completed a 22% pullback off all-time highs.
6/19/20
Skyworks, $SWKS
Close: 129.10
Pre-mkt: 130.45
Stop level: 15%
$SWKS is in a longer-term uptrend above all key rising MAs and no closes below the 20-sma since early April. The rising 50-sma is a key trend gauge on any pullbacks.
6/18/20
Altassian Corp., $TEAM
Close: 176.71
Pre-mkt: 177.25
Stop level: 15%
$TEAM is in a longer-term uptrend above the rising 50, 100 and 200-sma and recently completed a 14.6% pullback into the rising 50-sma.
6/17/20
Morgan Stanley, $MS
Close: 48.56
Pre-mkt: 48.91
Stop level: 15% (below 50-sma)
$MS is in a primary uptrend above the rising 20, 50 and 200-sma and recently completed a 14% pullback into the 200-sma. MS is one of the stronger large cap financial charts here.
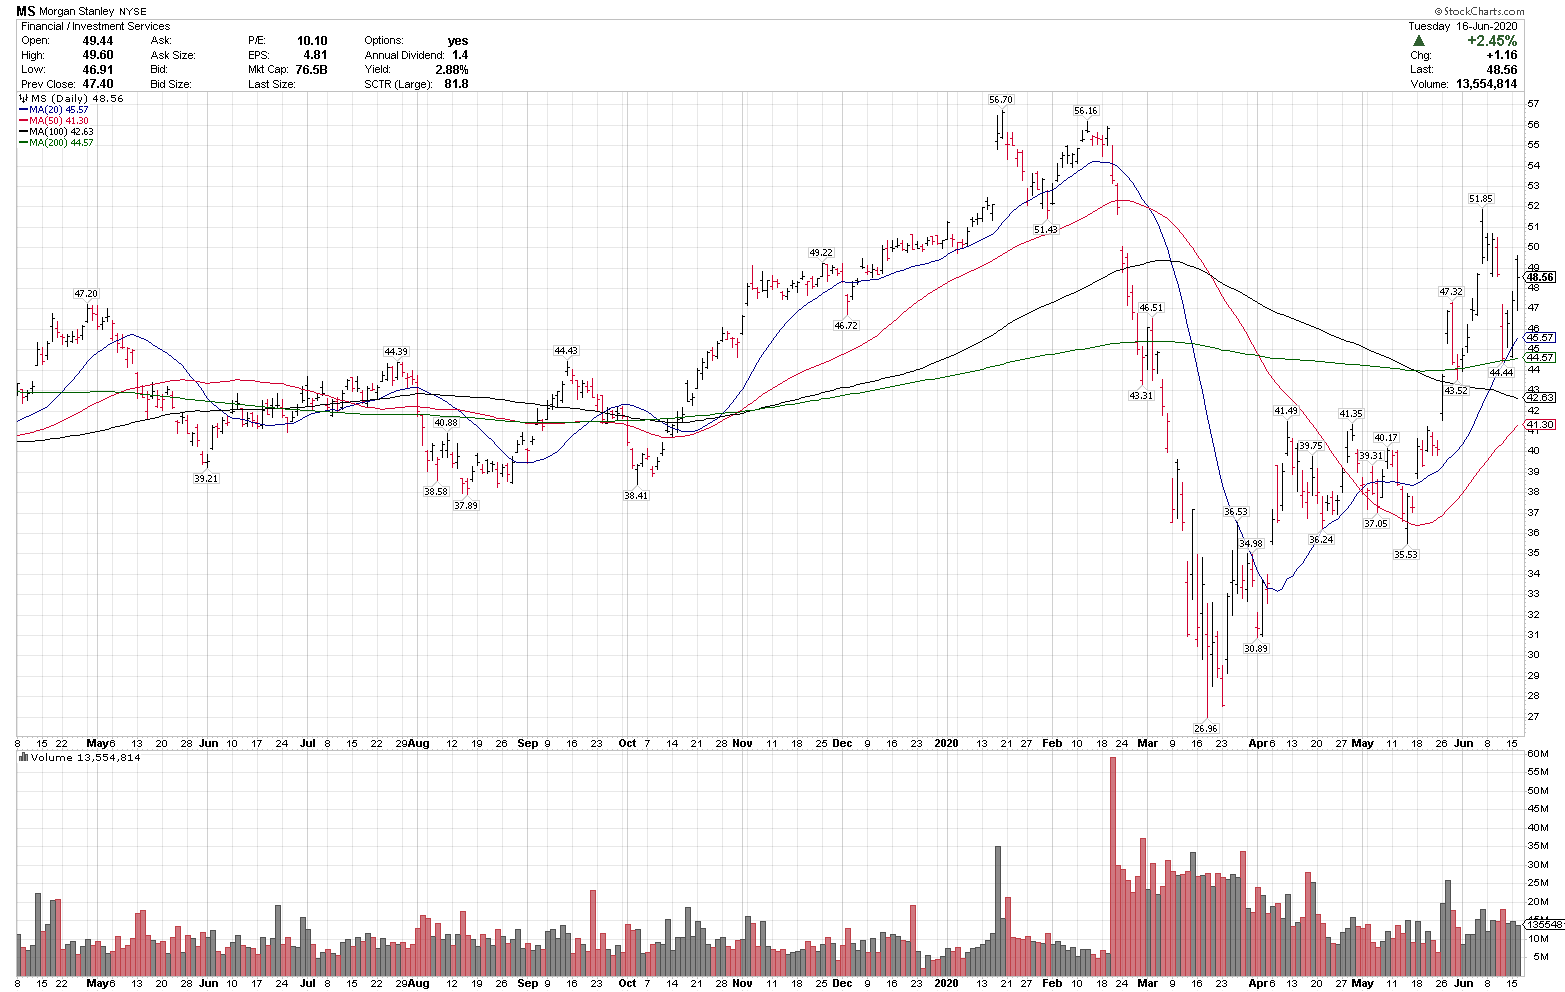
6/16/20
Okta, Inc. $OKTA
Close, when posted: 187.45
Pre-market: 189.00
Stop level: 15%
OKTA is in a longer term uptrend above all key rising MAs, and recently completed a 15.8% pullback off all-time highs. The rising 50-sma at 165.70 is a key trend gauge.
6/15/20
Clorox, $CLX
Pre-mkt: 206.97
Stop level: 184.60
$CLX is in a primary uptrend above all key MAs and has held the rising 50-sma since December – a key trend level.
6/12/20
Activision, ATVI
Close: 71.28
Pre-mkt: 71.63
Stop level: 12%
$ATVI is in a longer-term uptrend above the rising 50, 100, & 200-sma and recently completed a 12% pullback off 52 week highs. Adding it to last night’s watch list as well.
6/11/20
Dollar General, DG
Close: 190.13
Pre-mkt: 189.42
Stop level: 12%
$DG is in a longer-term uptrend above all rising MAs. 175 is a key level on any pullbacks.
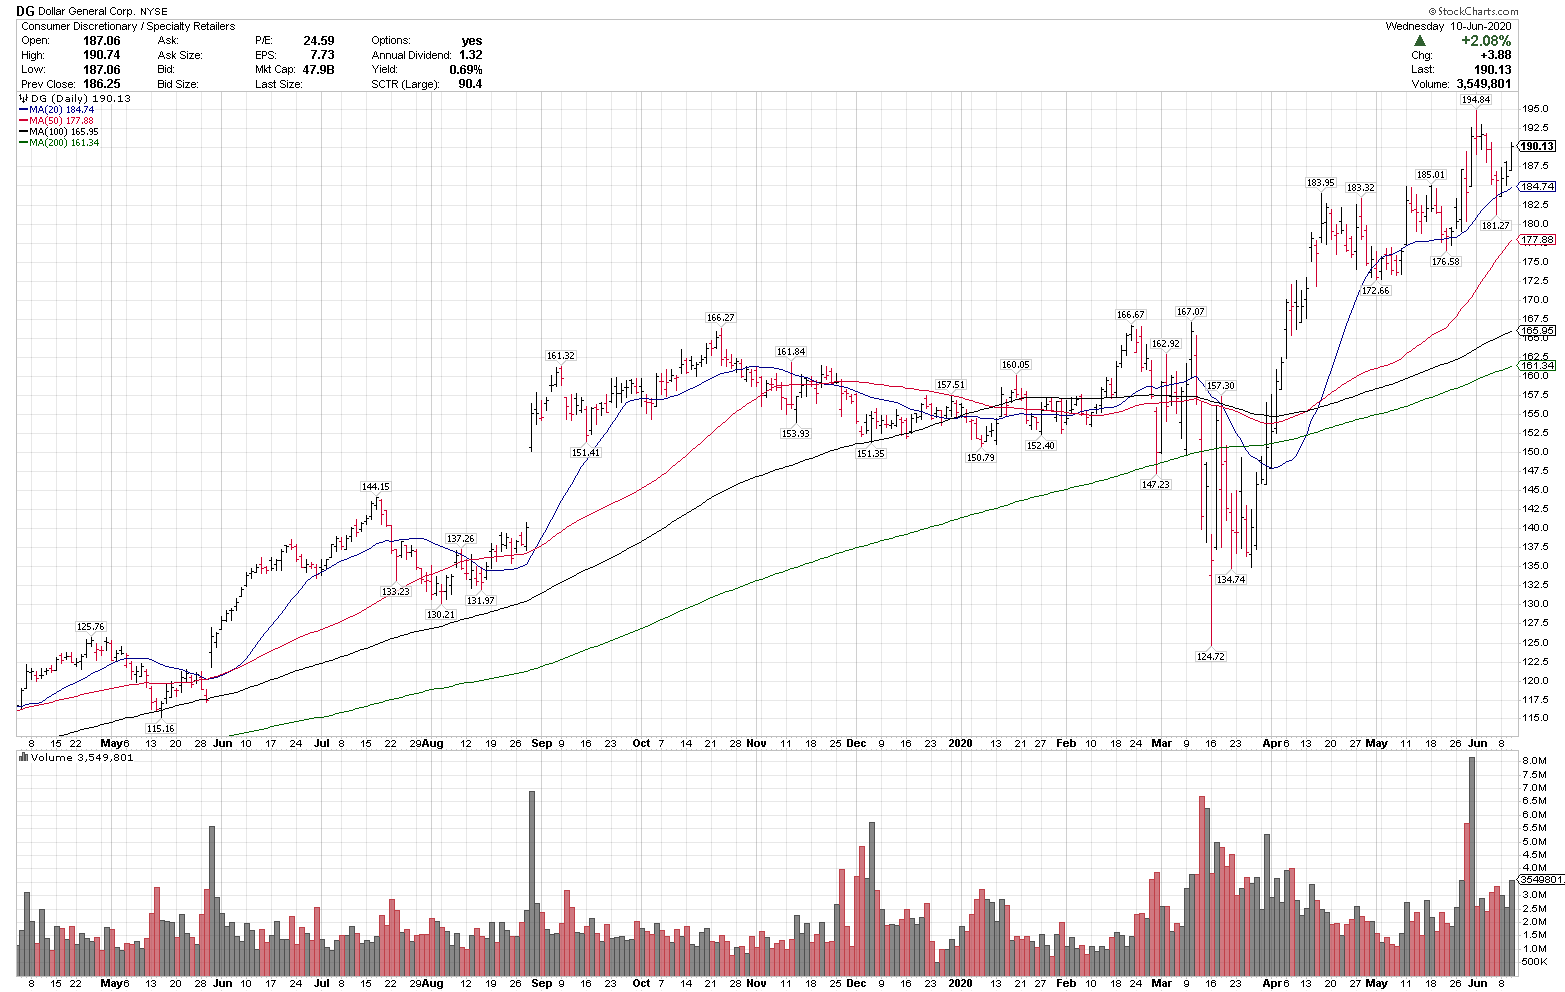
6/10/20
Netflix, $NFLX
Close: 434.05
Pre-mkt: 436.94
Stop level: 12%
$NFLX is in a primary uptrend above all key MAs, and a rising 50, 100 and 200sma. $NFLX completed a 13% pullback after all time highs.
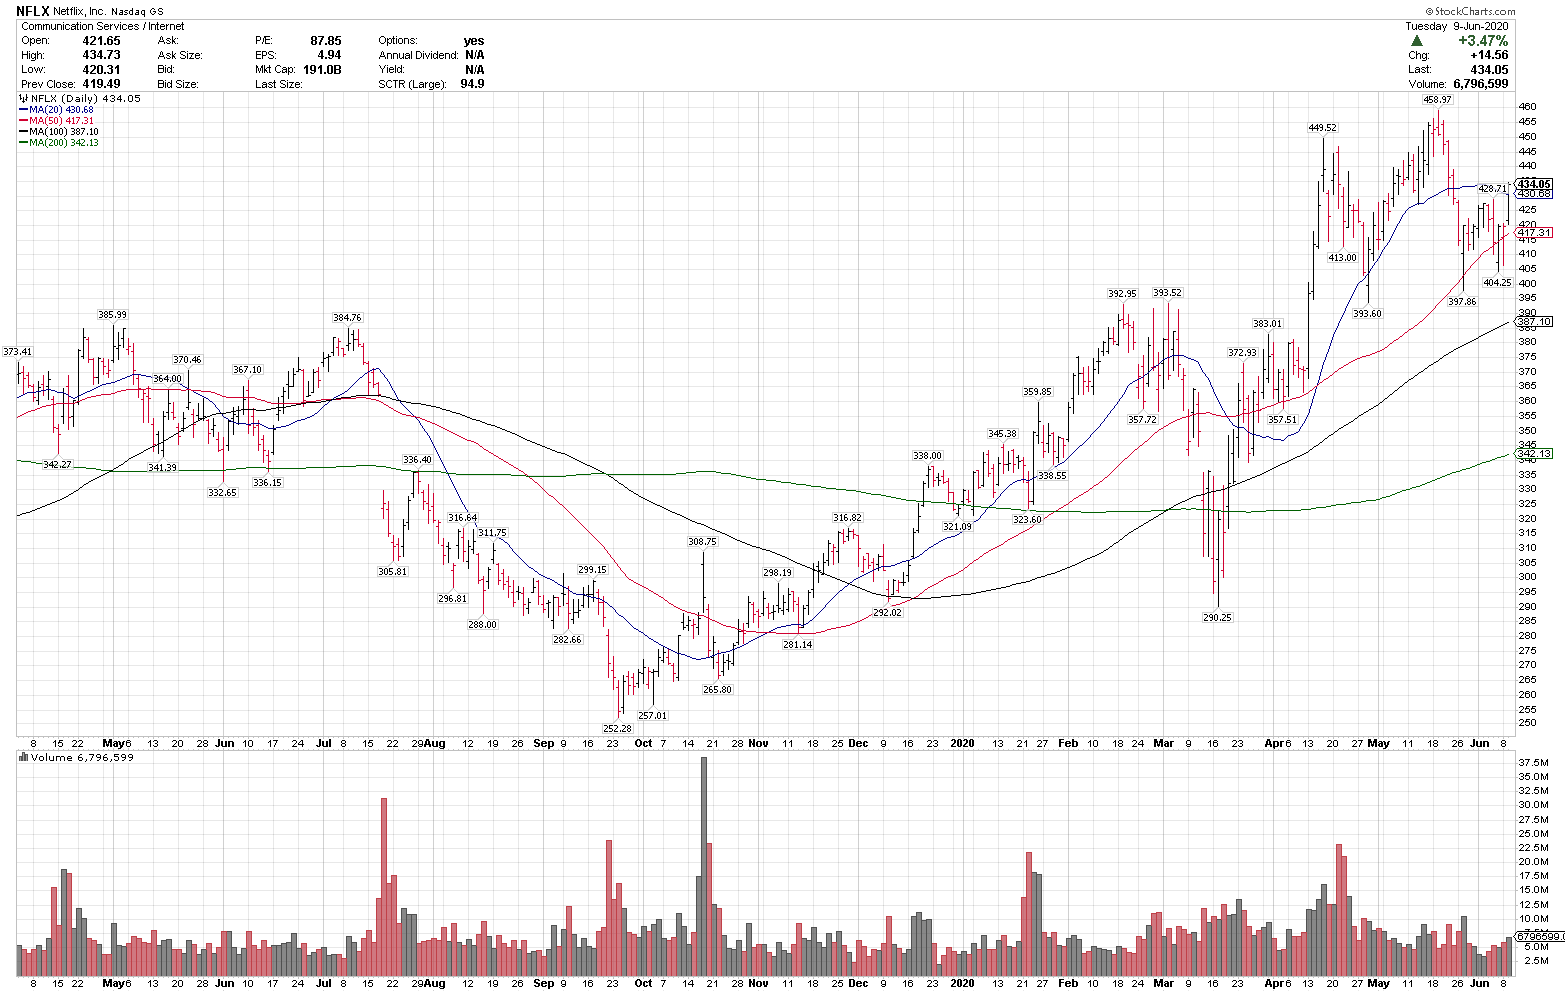
6/09/20
Salesforce.com, CRM
Pre-market: 174.50
Stop level: 153.56
$CRM pulled back 9% and is in an uptrend above all key MAs. The 50/200-sma recently crossed, indicating improving momentum.
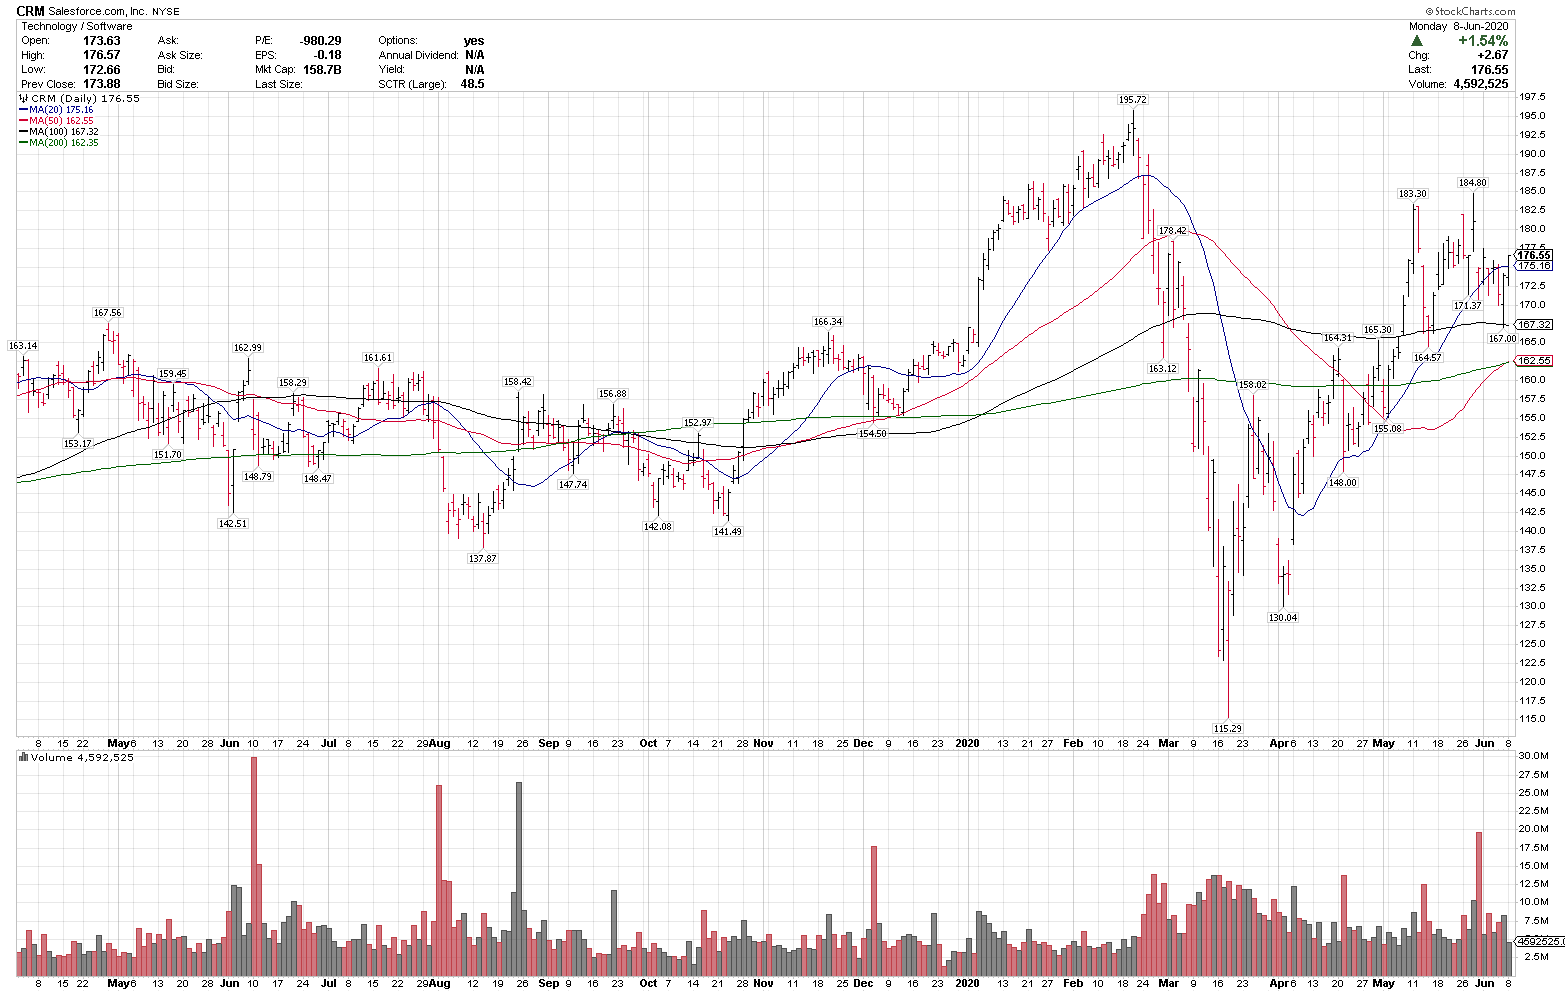
6/08/20
Starbucks, SBUX
Close: 82.14
Stop level: 72.28
SBUX closed at a 90+ day high on Friday, above the March high & above the 200-sma, all bullish trend following signals. The 20 & 50-day moving averages are also rising, indicating an intermediate term uptrend as well.
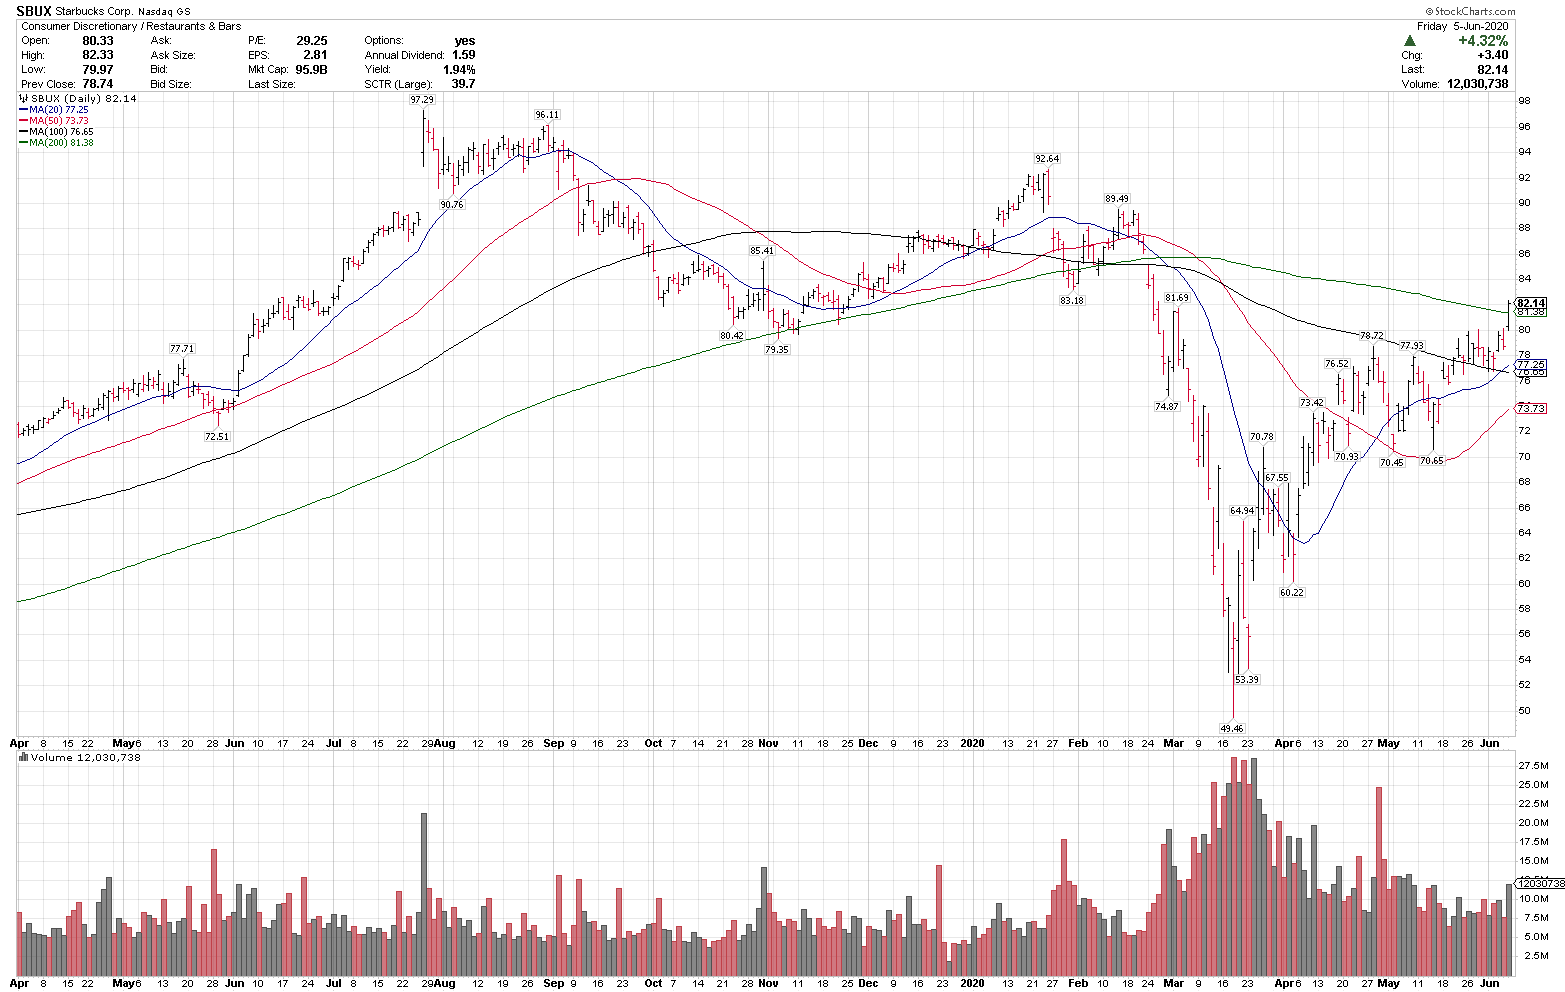
6/05/20
Financial Sector
$XLF
Close: 25.30
Financials broke out of their trading range yesterday, closed at an 80+ day high, & over the 100-sma for the first time since Feb. Active investors could look to scale in at the market or for a 3-5% pullback in top long term ideas $BAC, $C, or $JPM. The bank stocks are breaking out in a strong market, but at the top end of the daily range. While they can pull back at any time, the primary trend has turned higher here.
6/04/20
Twitter, $TWTR
Close: 34.88
Pre-mkt: 34.80
Stop level: 29.58
$TWTR, featured in the June 1 & 2 videos, reclaimed the 200-sma yesterday, made an 80 day high and has a rising 20 & 50-sma, all indicating an improving price trend.
6/03/20
Freeport-McMoRan, $FCX
Close: 9.75
Pre-mkt: 9.85
Stop level: 15% (higher volatility chart)
$FCX broke out to an 80-day high yesterday and is trading above the rising 20 and 50-sma, but below the 200-sma. A close above the 200-sma and $10 could signal a move higher.
6/02/20
Facebook, $FB
Close (when posted): 231.91
Pre-market: 233.99
Stop level: 12%
$FB is in a primary uptrend, above all key rising MAs, and recently completed a 7.9% pullback off all-time highs.
6/01/20
MSCI Inc, $MSCI
Close: 328.85
Stop level: 289.38
$MSCI is in a LT uptrend above the rising 50, 100 & 200-day moving averages, indicating a primary uptrend. It also recently pulled back 12% from all-time highs & held the rising 50-sma, a bullish technical signal.
5/29/20
Invesco Solar ETF, $TAN
Close: 33.05
Stop level: 28.09
$TAN is in an uptrend of higher highs and higher lows, with no closes below the 20-sma since April 5. It is also trading above all key rising MAs.
5/28/20
Newmont Mining, $NEM
Weds. price when posted: 57.33 https://twitter.com/BlueChipPremium/status/1265687682895790085
Close: 58.73
Pre-mkt: 60.48
Stop level: 15%
$NEM just pulled back into the rising 50-sma, which often offers a good continuation buy point in uptrends. It just corrected 19% after reaching an all-time high.
5/27/20
Fastenal
$FAST
Close: 39.72
Pre-market: 40.16
Stop level: 12%
$FAST is a $22B industrial supplies co. in a primary uptrend, above all rising MAs and holding above the 37.50 breakout level.
5/26/20
The Trade Desk
$TTD
Close, when added to weekly best ideas list: 307.60
Pre-mkt: 312.86
Stop: 15%
$TTD is in a primary uptrend, above all key rising MAs & pulled back 14% after making a new high. A higher volatility name testing a breakout > $300. $275 is key on any pullbacks.
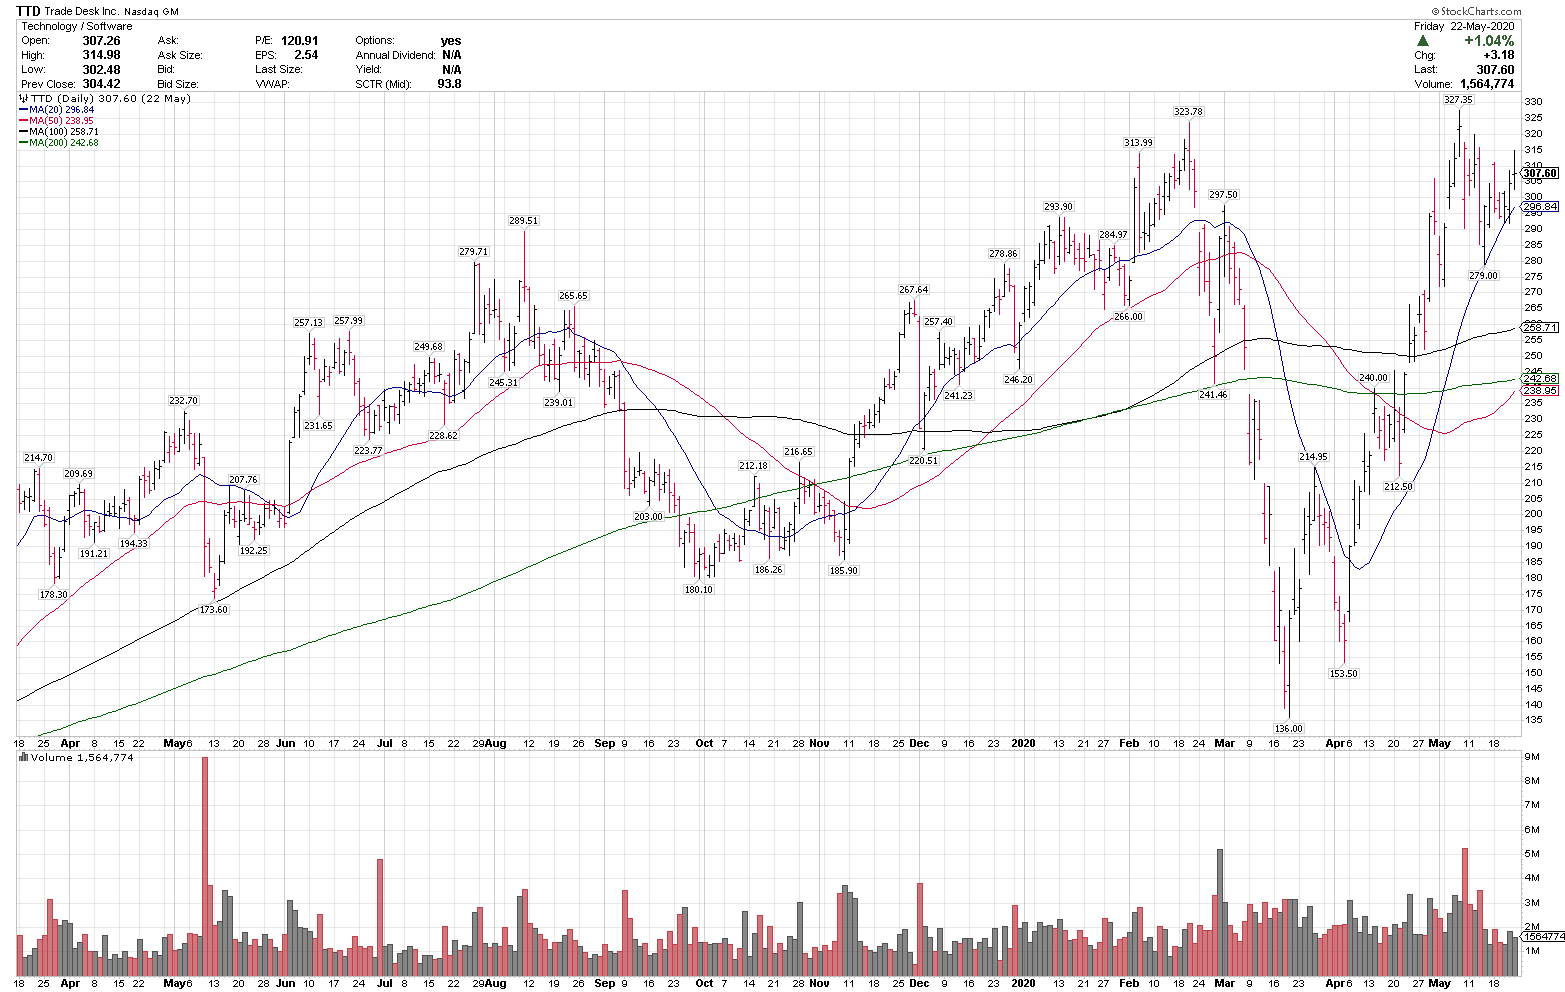
5/22/20
Shopify
$SHOP
Pre-market: $800.00 even
Stop level: 15%
$SHOP broke out to a new high yesterday, having consolidated it’s early May breakout as well, and above all rising MAs. $700 & the 20-sma are key levels on any pullback. $SHOP was our Chart of the Day on 4/09 as well. https://twitter.com/BlueChipPremium/status/1248219496491466754
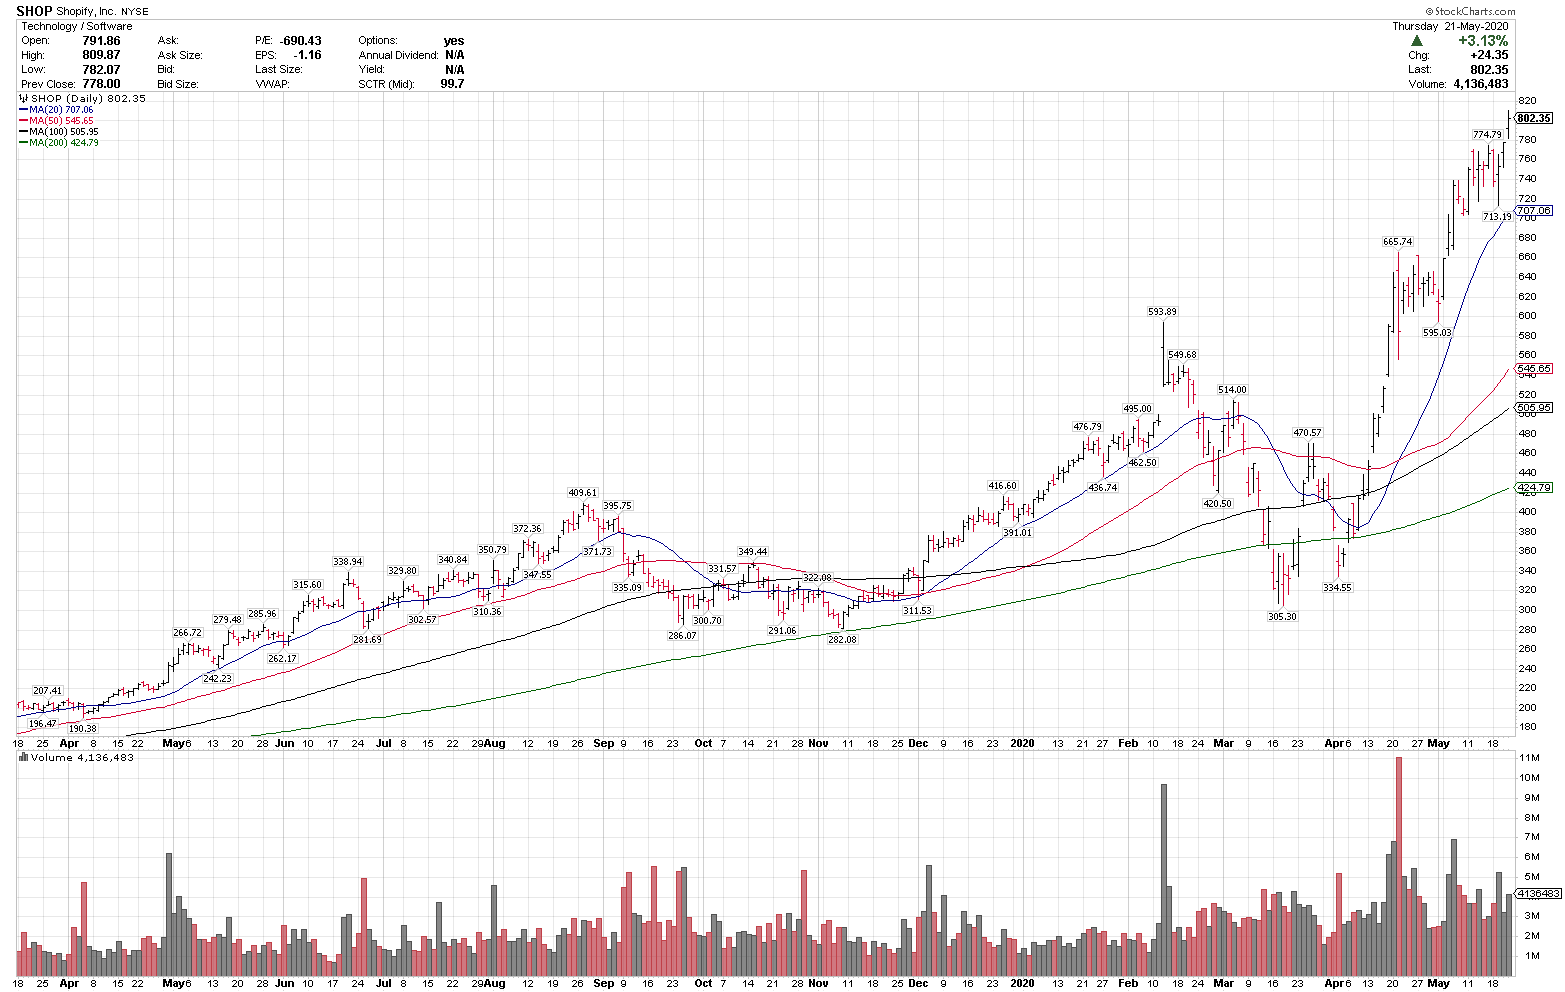
5/21/20
Cisco Systems
$CSCO
Close: 45.44
Stop level: 39.98
$CSCO is in an intermediate-term uptrend, with a series of higher highs and higher lows, at a 90-high and has reclaimed the 200-sma.
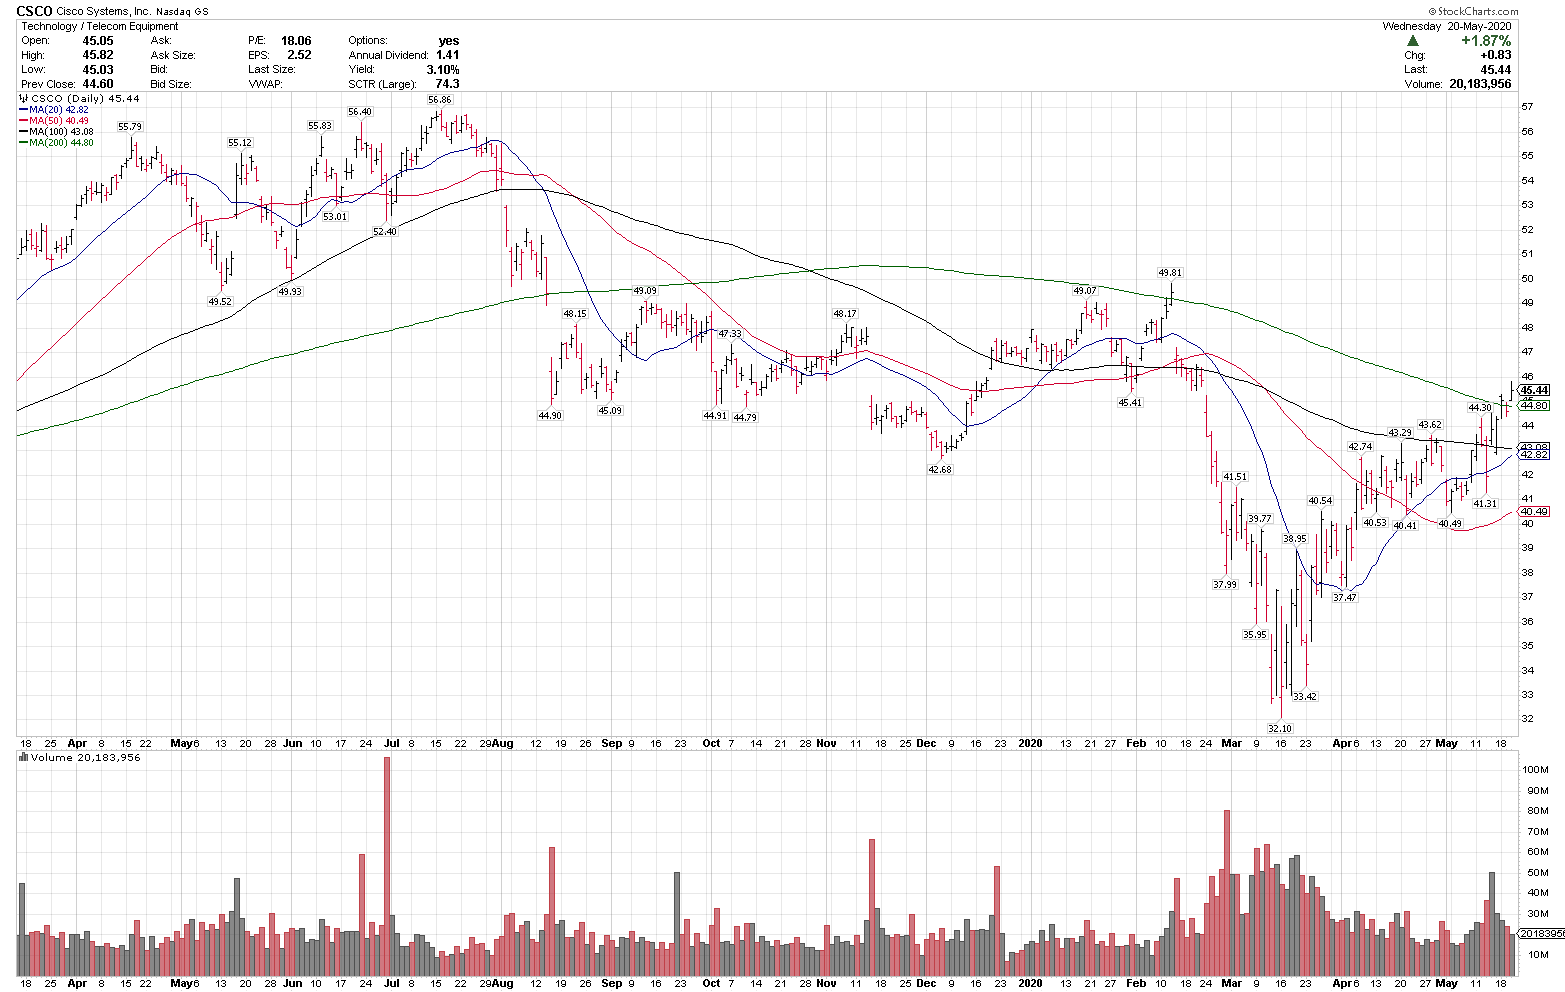
5/20/20
Applied Materials
$AMAT
Close, when posted: 55.47
Pre-market: 56.40
Stop level: 15%
$AMAT is in an intermediate-term uptrend, closing above all key MAs and making a 70-day high yesterday.
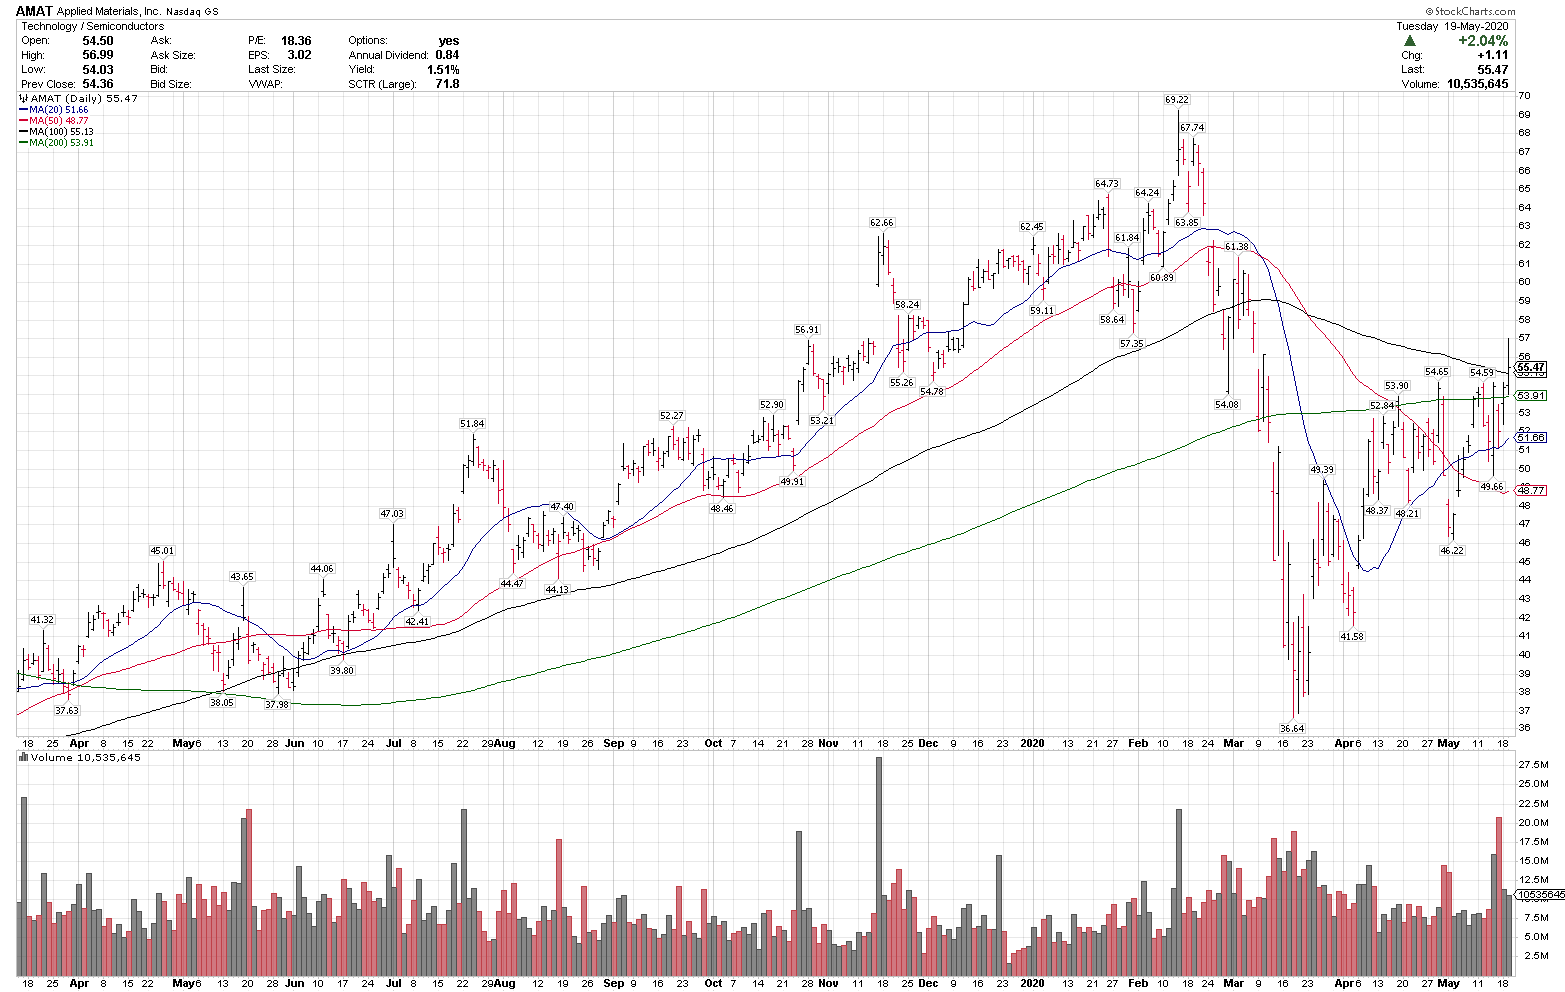
5/19/20
Mastercard
$MA
Close: 289.90
Stop level: 254.81
$MA is in an intermediate term uptrend, with a series of higher highs and higher lows, just cleared the 200-sma and made a 60+ day high.
5/18/20
Adobe
$ADBE
Close: 365.30
Pre-market: 369.26
Stop level: 12%
$ADBE is in a primary uptrend above all key rising MAs, and held the 20-sma after a 6.7% pullback. $ADBE is on the weekend best ideas list as well.
5/15/20
Barrick Gold
$GOLD
Close: 27.14
Pre-market: 27.38
Stop level: 23.06
$GOLD is in a longer-term uptrend above all key rising MAs. It is holding above recent breakout levels of $22.50 and $25.00.
5/14/20
Chewy Inc.
$CHWY
Close: 41.17
Stop level: 35.45
$CWHY is in an uptrend above all key MAs, recently completed a 20% pullback and held the rising 50-sma. The rising 50-sma is key on any pullbacks.
5/13/20
Electronic Arts
$EA
Close: 116.37
Stop level: 101.40
$EA is in a longer-term uptrend above all key MAs. 108-110 is near term support on any pullbacks.
5/12/20
Exxon Mobil
$XOM
Close: 45.74
Stop level: 38.87
$XOM is in an intermediate term uptrend, with a series of higher lows & higher highs, over the 50-sma & the rising 20-sma.
5/11/20
Amgen
$AMGN
Close: 234.82
Stop level: 206.64
$AMGN is in an uptrend above all key MAs and a rising 50 & 200-sma. $AMGN pulled back 6.9% after making a new high.
5/08/20
Slack Technologies
$WORK
Close: 29.95
Pre-market: 30.90
Stop level: 15%
$WORK went on the trade ideas list on 4/15 at 26.52, https://twitter.com/BlueChipPremium/status/1250478051537944576 is testing a 9 month high premarket & over the $30 level it has failed at 4 times. If price can stay above & close over 30, it could signal a breakout. The variable here is if it can stay/close over $30.
5/07/20
Square
$SQ
Close: 68.10
Pre-market: 68.17
Stop risk level: 57.88
$SQ recently reclaimed the 200-sma and is trading in an uptrend of higher highs and higher lows over the rising 20-sma. $60 is a key level on any pullbacks.
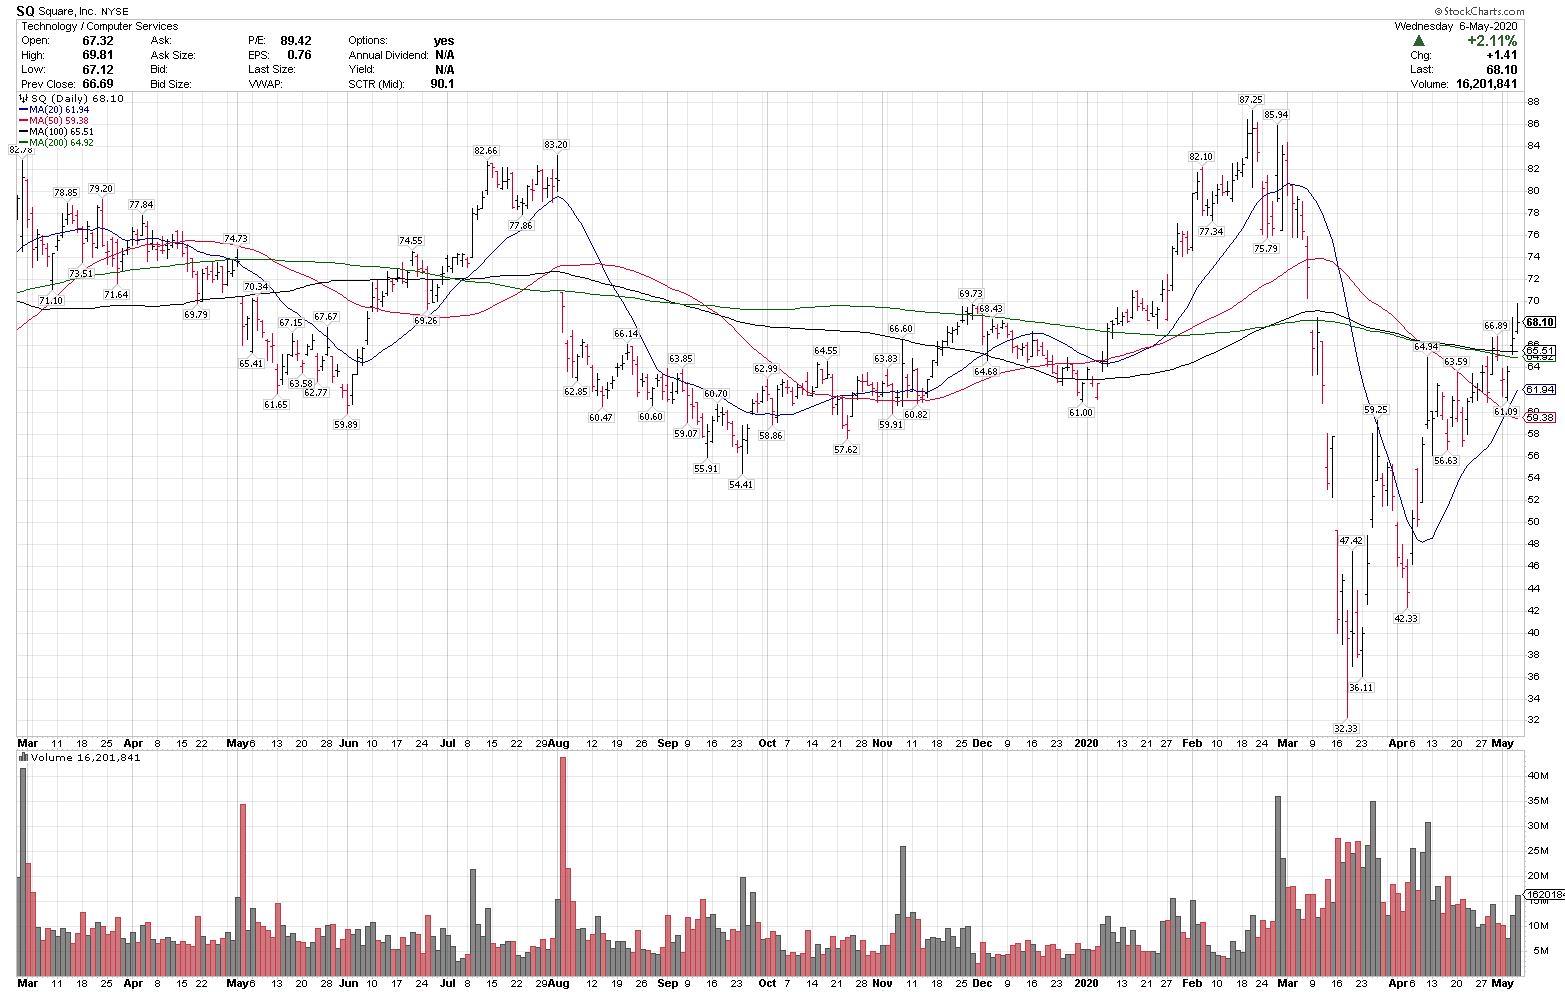
5/06/20
Paycom
$PAYC
Close: 256.98
Stop level: 218.43
$PAYC is an S&P 500 name that recently reclaimed the 200-sma. This is a higher volatility chart and potentially higher risk/potential reward idea.
5/05/20
Advanced Micro Devices
$AMD
Close: 52.56
Pre-market: 53.45
Stop level: 15%
$AMD reclaimed a key $50 level yesterday, after a 16% pullback, is turning higher on the daily chart and is trending higher over the rising 200-sma. $AMD was also alerted intra-day on the premium Twitter feed yesterday at 51.05.
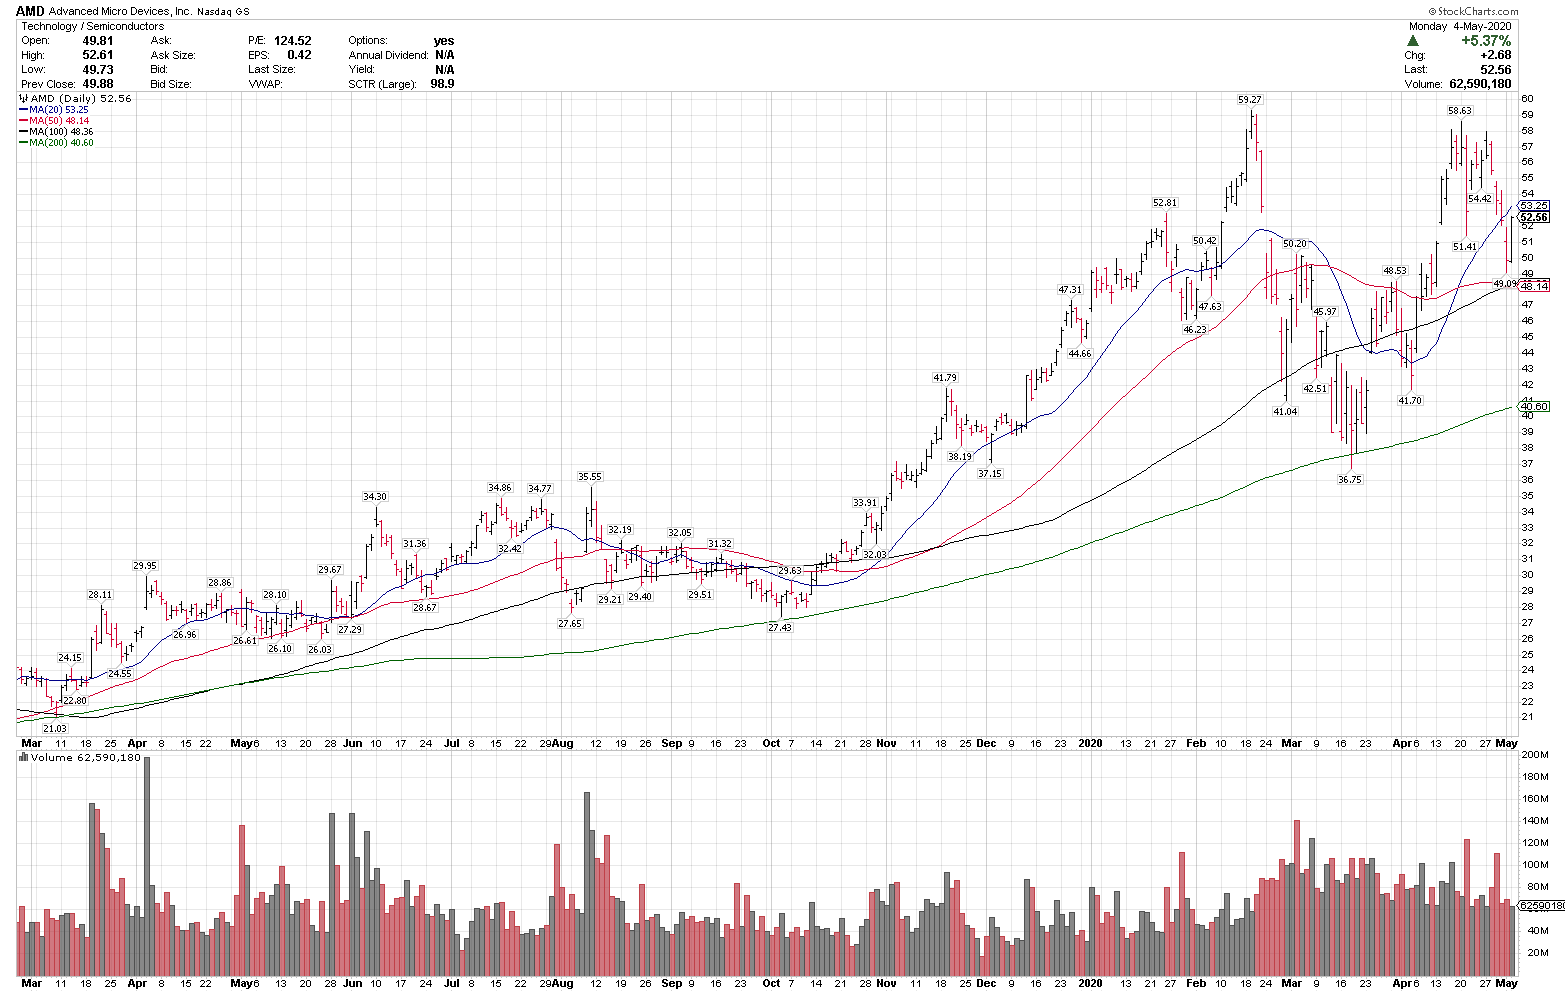
5/04/20
Kroger Co.
$KR
Close: 31.96
Stop level: 27.16
$KR is in a steady uptrend above the rising 50, 100 & 200-sma. It has had one close below the 100-sma since Sept. 2019 – a good trend gauge here.
5/01/20
Abbott Labs
$ABT
Close: 92.09
Pre-mkt: 90.70
Stop level: 12%
$ABT is in a longer-term uptrend, above rising-MAs, and consolidating after a breakout to recent highs. 86-90 is a key support level.
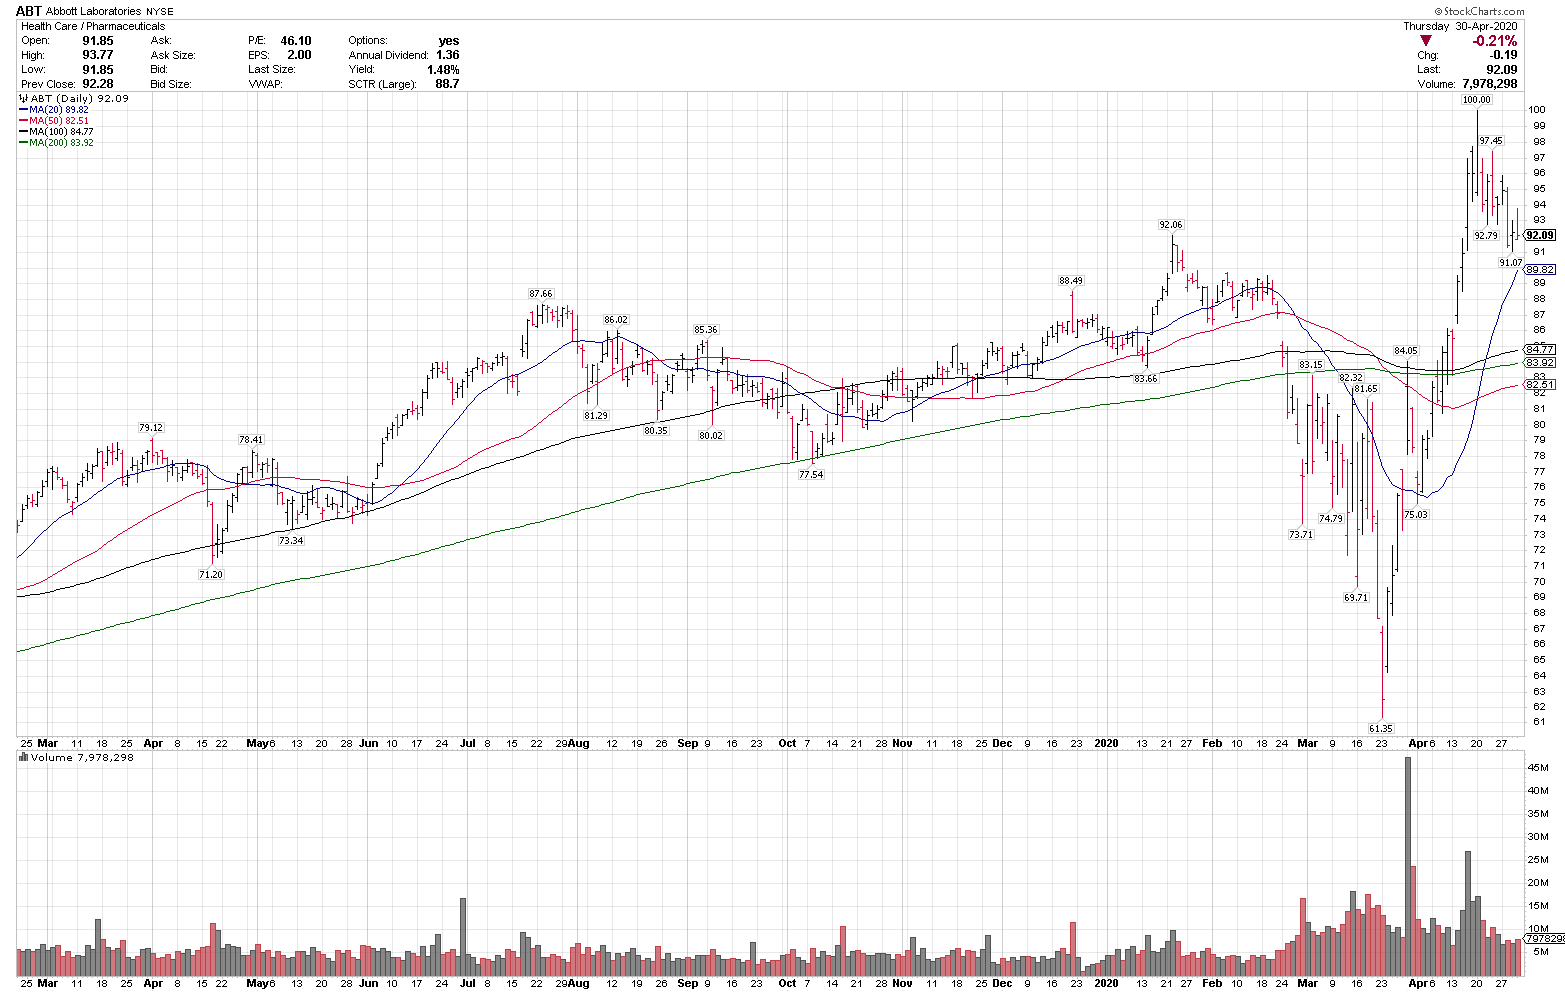
APRIL 2020 “CHART OF THE DAY”
4/30/20
Bank of America
$BAC
Close: 24.78
Stop level: 20.96
$BAC is trending higher, with a series of higher highs and higher lows, and reclaimed the 50-sma yesterday.
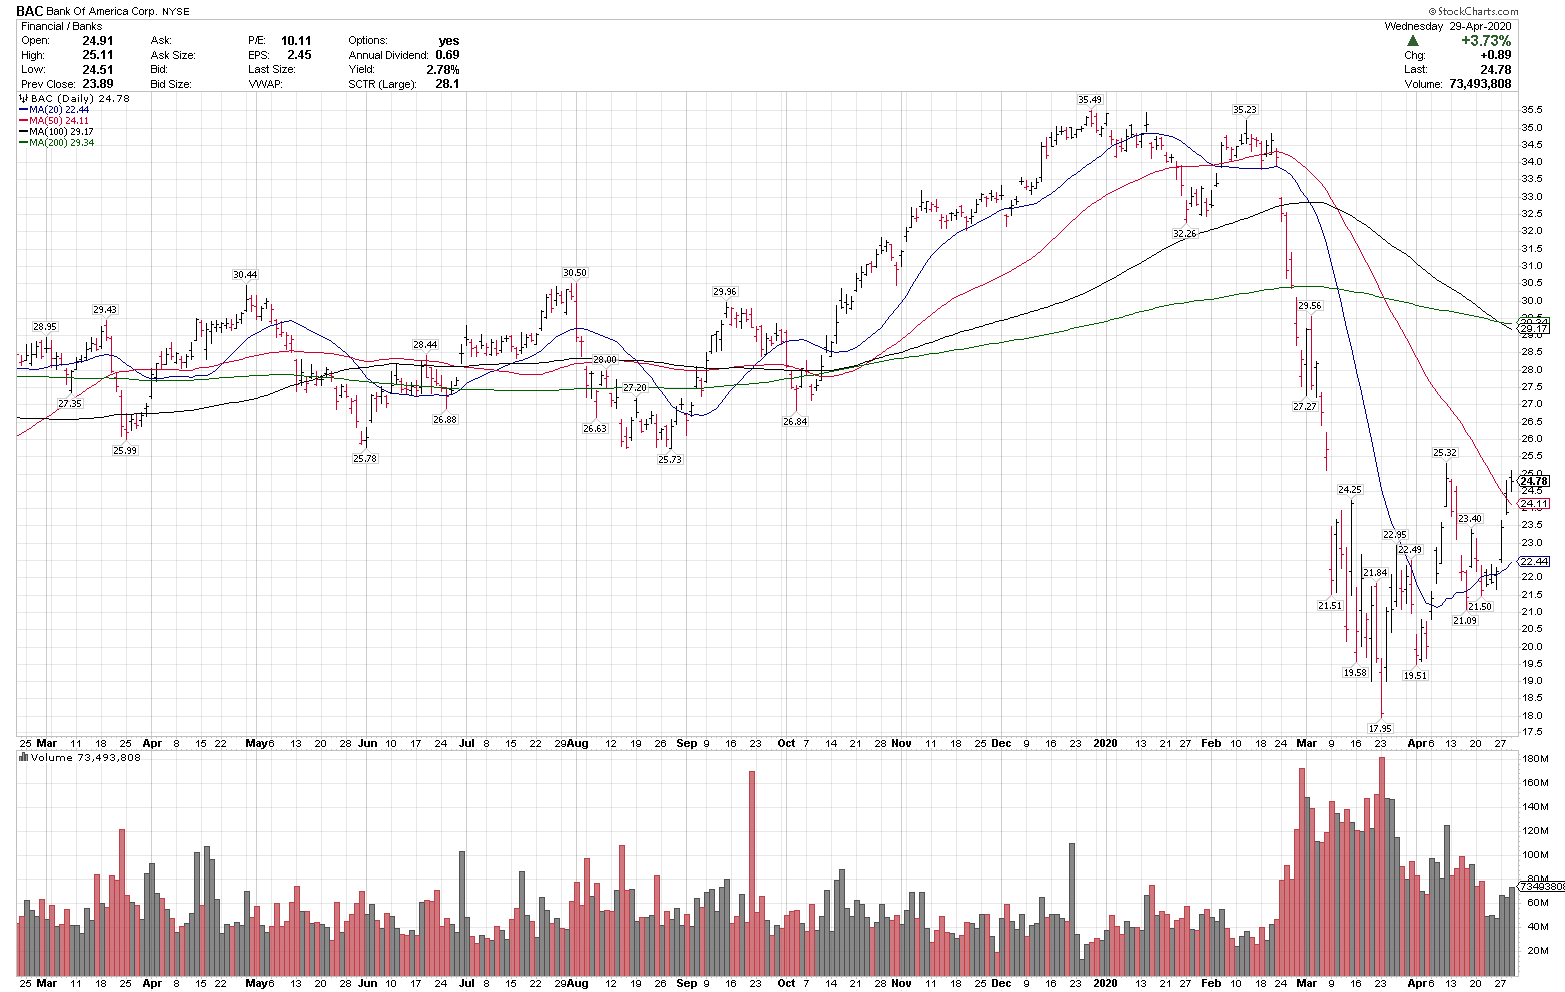
4/29/20
S&P SPDR Metals & Mining ETF
$XME
Close: 18.94
Stop level: 16.21
$XME is in a near-term uptrend, with a series of higher highs and lows, and closed over the 50-sma yesterday. I have a new long position here as well.
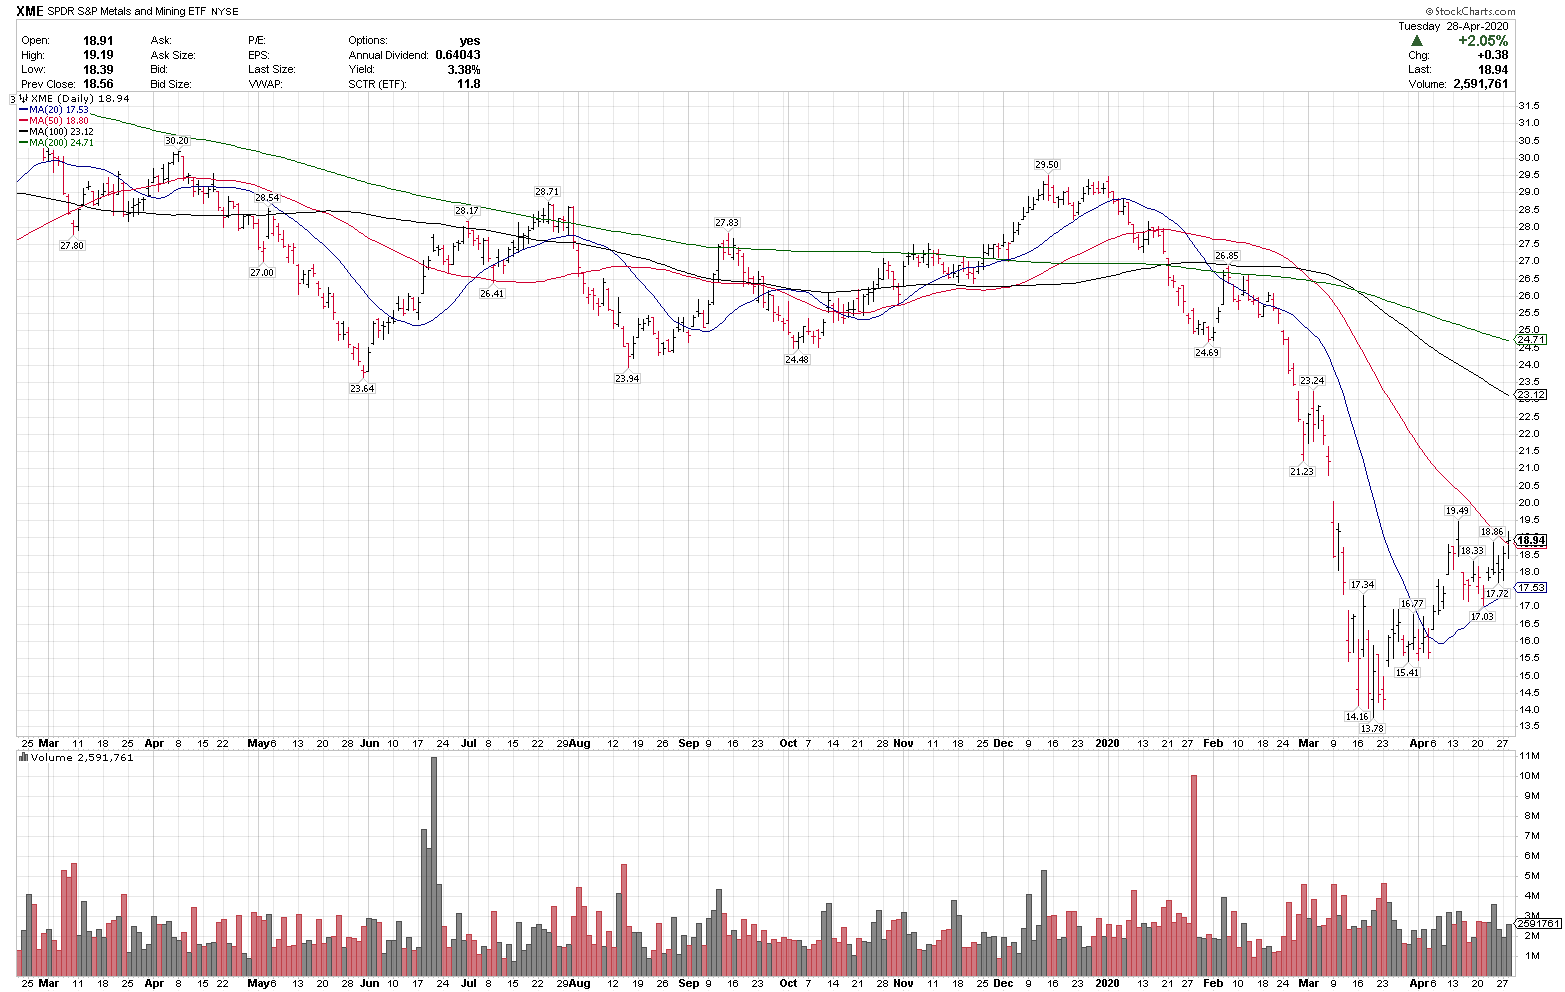
4/28/20
Goldman Sachs
$GS
Close (when posted): $183.54
Pre-market: $187.51
Stop level: 15%
$GS reclaimed the 50-sma yesterday for the first time since mid-Feb and is making higher lows & higher highs over the rising 20-sma. $169 and $162.50 are key shorter-term levels.
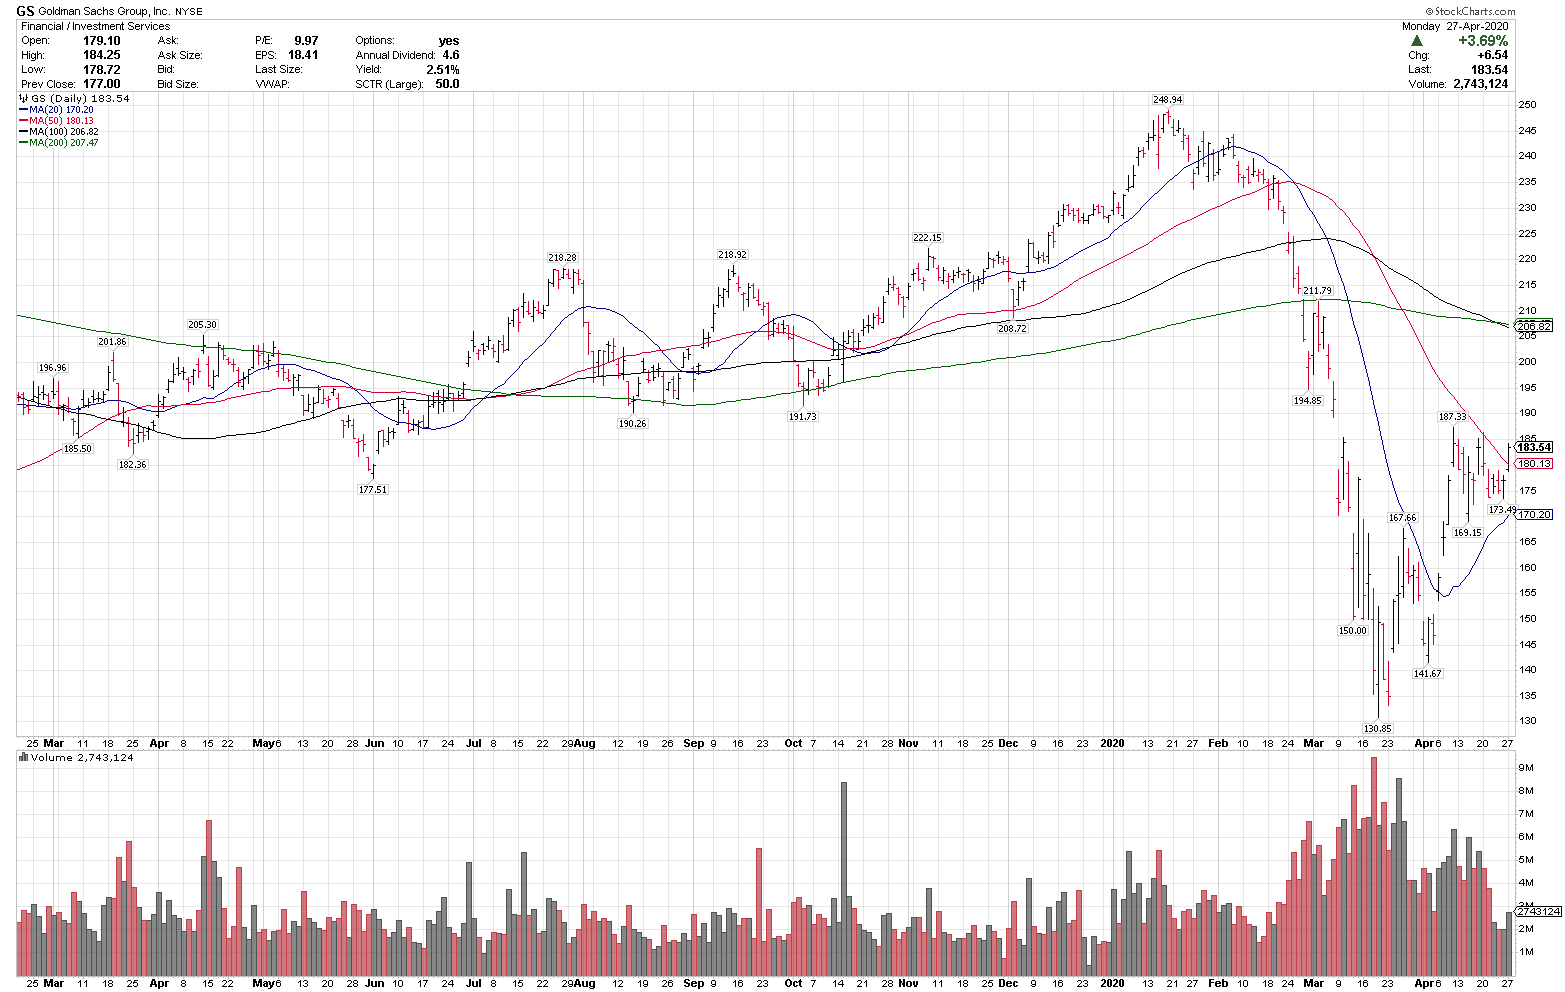
4/27/20
Intel
$INTC
Close: 59.26
Pre-mkt: 59.80
Stop level: 50.83
$INTC is in a longer-term uptrend above the rising 200-sma. A close over $61 could signal a new leg higher.
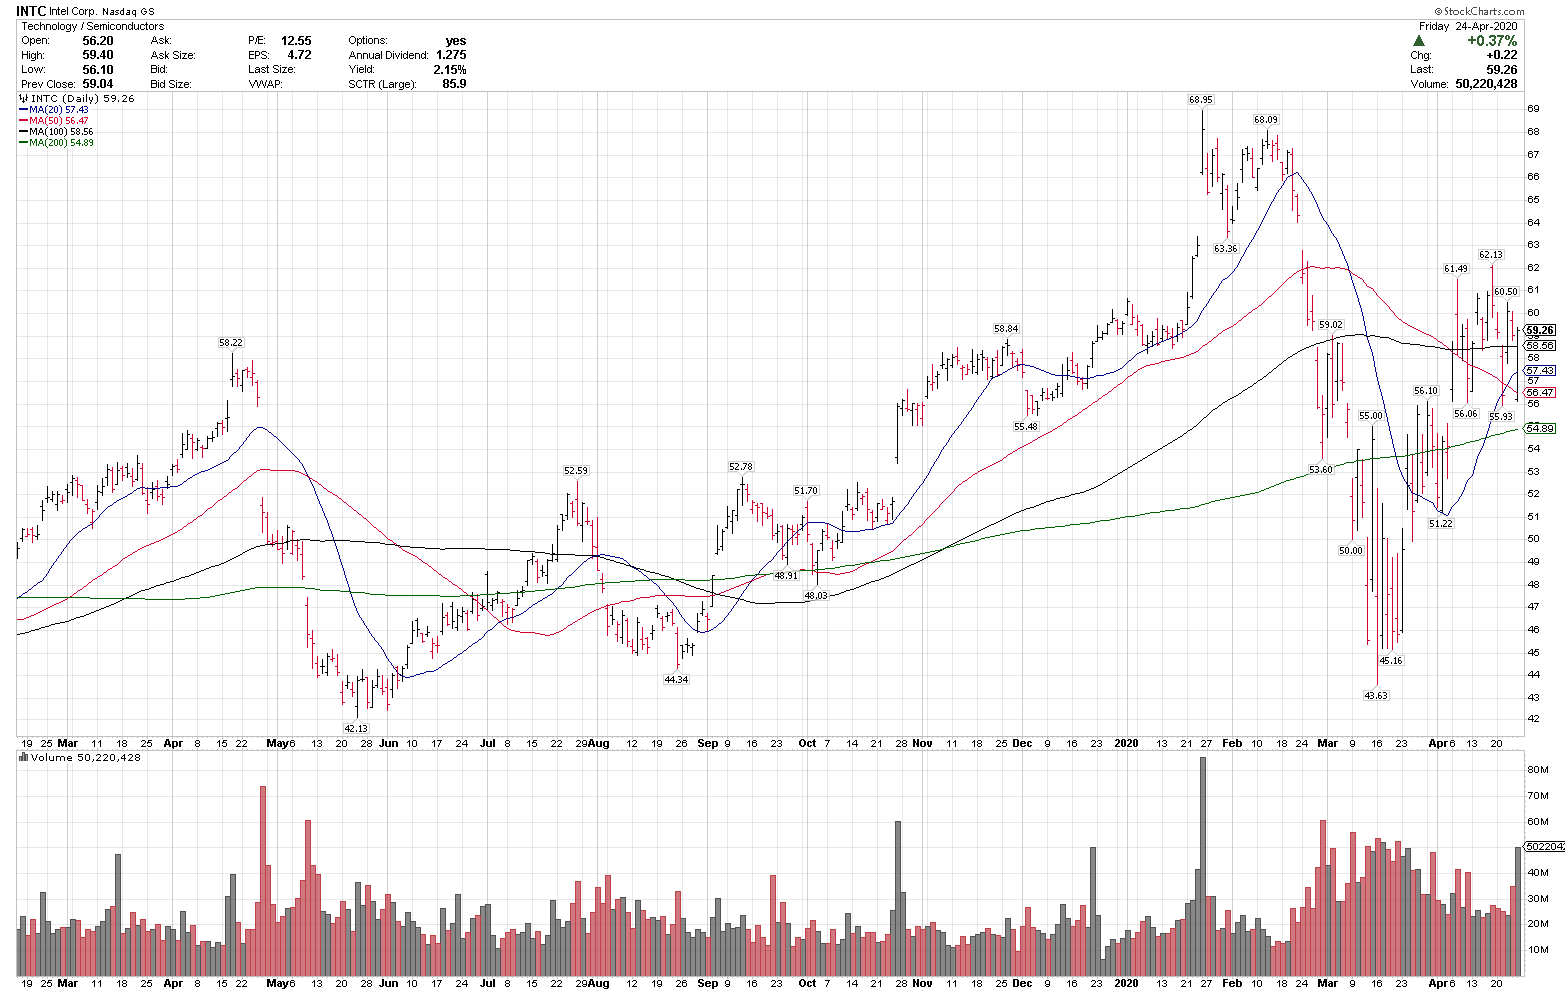
4/24/20
$UNH
Unitedhealth Group
Close: 285.33
Pre-mkt: 288.00
Stop level: 15%
$UNH is a leader in the healthcare space and above all key MAs. It recently pulled back 10% in it’s uptrend.
4/23/20
$BMY
Bristol Myers Squibb
Close: 60.93
Stop level: 51.79
$BMY is in a longer term-uptrend, above the rising 200-sma, and above all key MAs.
4/22/20
$IBB
Biotechnology ETF
Close: 122.42
Pre-mkt: 122.90
Stop level: 107.72
$IBB is in a longer-term uptrend above all key MAs and recently broke out to a 4 /12 year high. Healthcare is our #2 ranked focus group as well.
4/21/20
$BABA
Close: 212.13
Pre-mkt: 209.18
Stop level: 177.80
$BABA is in a longer-term uptrend above all key MAs, and a rising 200-sma. $BABA is the market cap leader in the focus group China internet sector.
4/20/20
$GOOGL
Close: 1279.00
Pre-market: 1265.00
(both quotes were priced in round dollar amounts from online sources)
Stop Level: 1087.15
$GOOGL reclaimed the 50 and 200-sma on Friday, and is trading over the rising 200-sma.
4/17/20
$KWEB
China Internet ETF
Close: 48.85
Stop level: 42.68
$KWEB is improving technically, over all key MAs, and a rising 200-sma. Leading large cap names in this group are $BABA, $TCEHY, $JD, $NTES & $SE. The individual names in the sector can be more volatile on average.
Best Ideas List Sector
$XLV
Close: 98.73
Stop level: 86.88
The Healthcare sector has been one of our top focus groups for a few weeks now, and the group continues to improve technically.
4/16/20
$GDX
Close/posted: 30.15
Pre-market: 30.88
Stop level: 24.70 (wider stop to start due to higher current volatility)
$GDX is trying to breakout from a 9 month base and above the rising 200-sma. We are planning to open a position this morning.
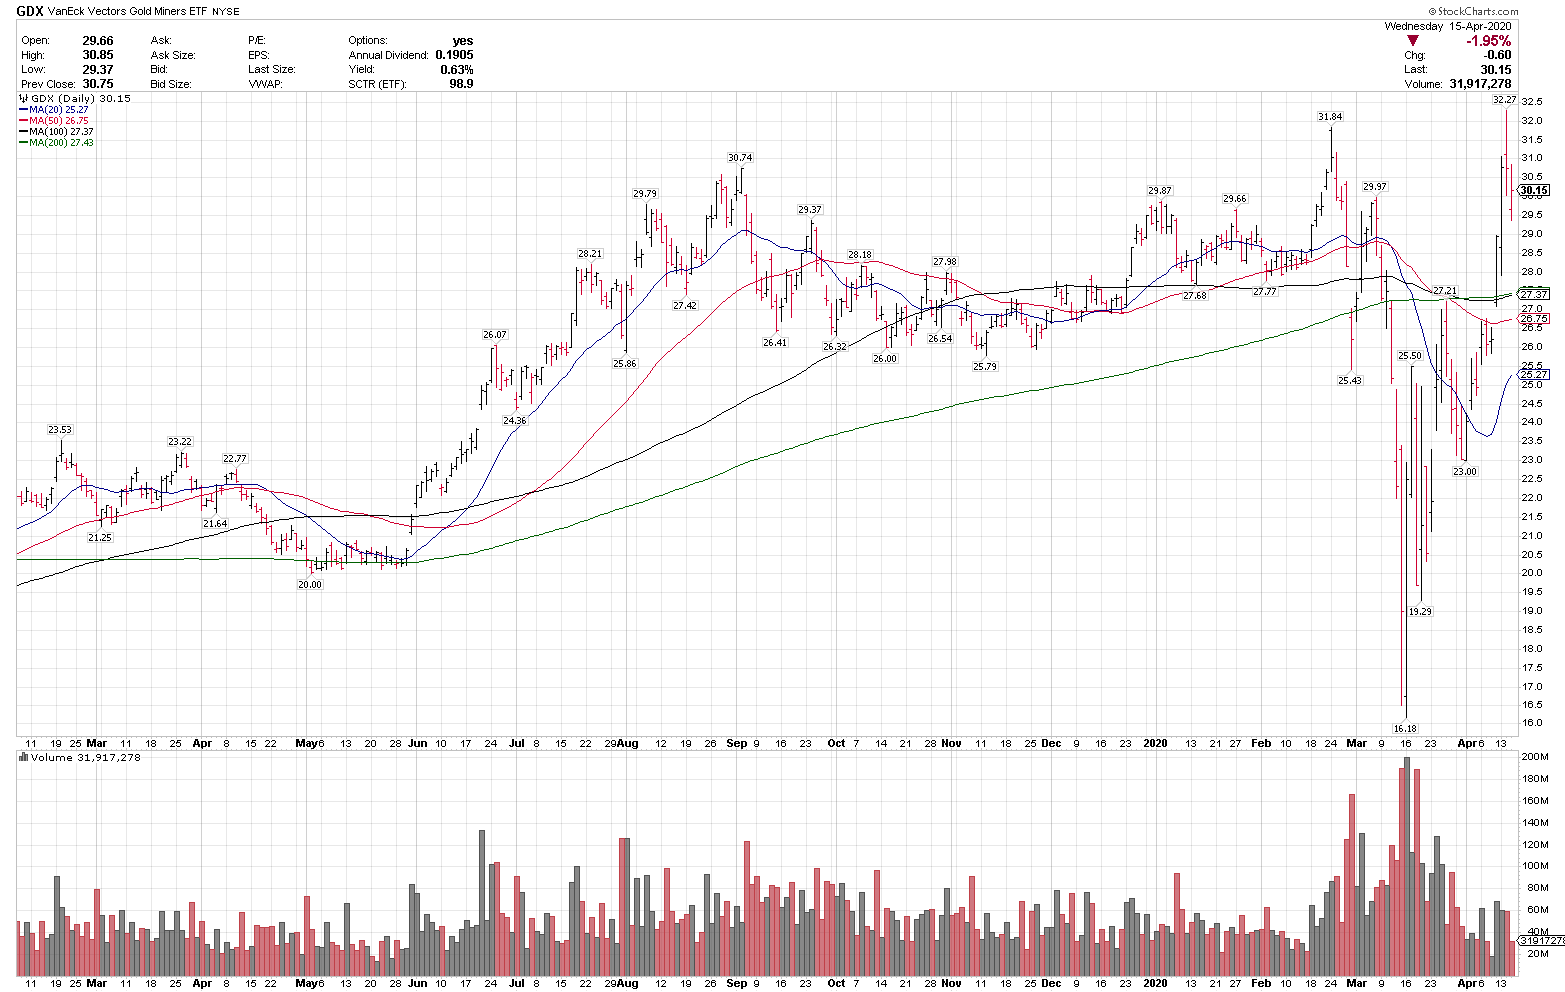
4/15/20
$NOW
Close: 302.09
Stop level: 254.77
$NOW has been improving technically. The 20-sma has turned up, it has reclaimed the 200-sma & had the first close over $300 since March 10.
4/14/20
Crude Oil
$WTIC
$21.87
Key level: $20.00
A longer-term recovery idea. At $21.87 pre-market, crude oil is at 1996 levels. In the short-term, it is very volatile. On any recovery, the reward vs risk potential could be high. $XLE, $XOP, $XOM are top longer term ideas, as prices dictate. The Energy space is not our standard uptrend idea, but for a longer-term time frame, the space could offer high potential. Any close under $20.00 could signal a new leg lower.
4/13/20
$NVDA
Pre-market: 261.82
Stop level: 222.54
$NVDA is in a longer-term uptrend above all key rising MAs.
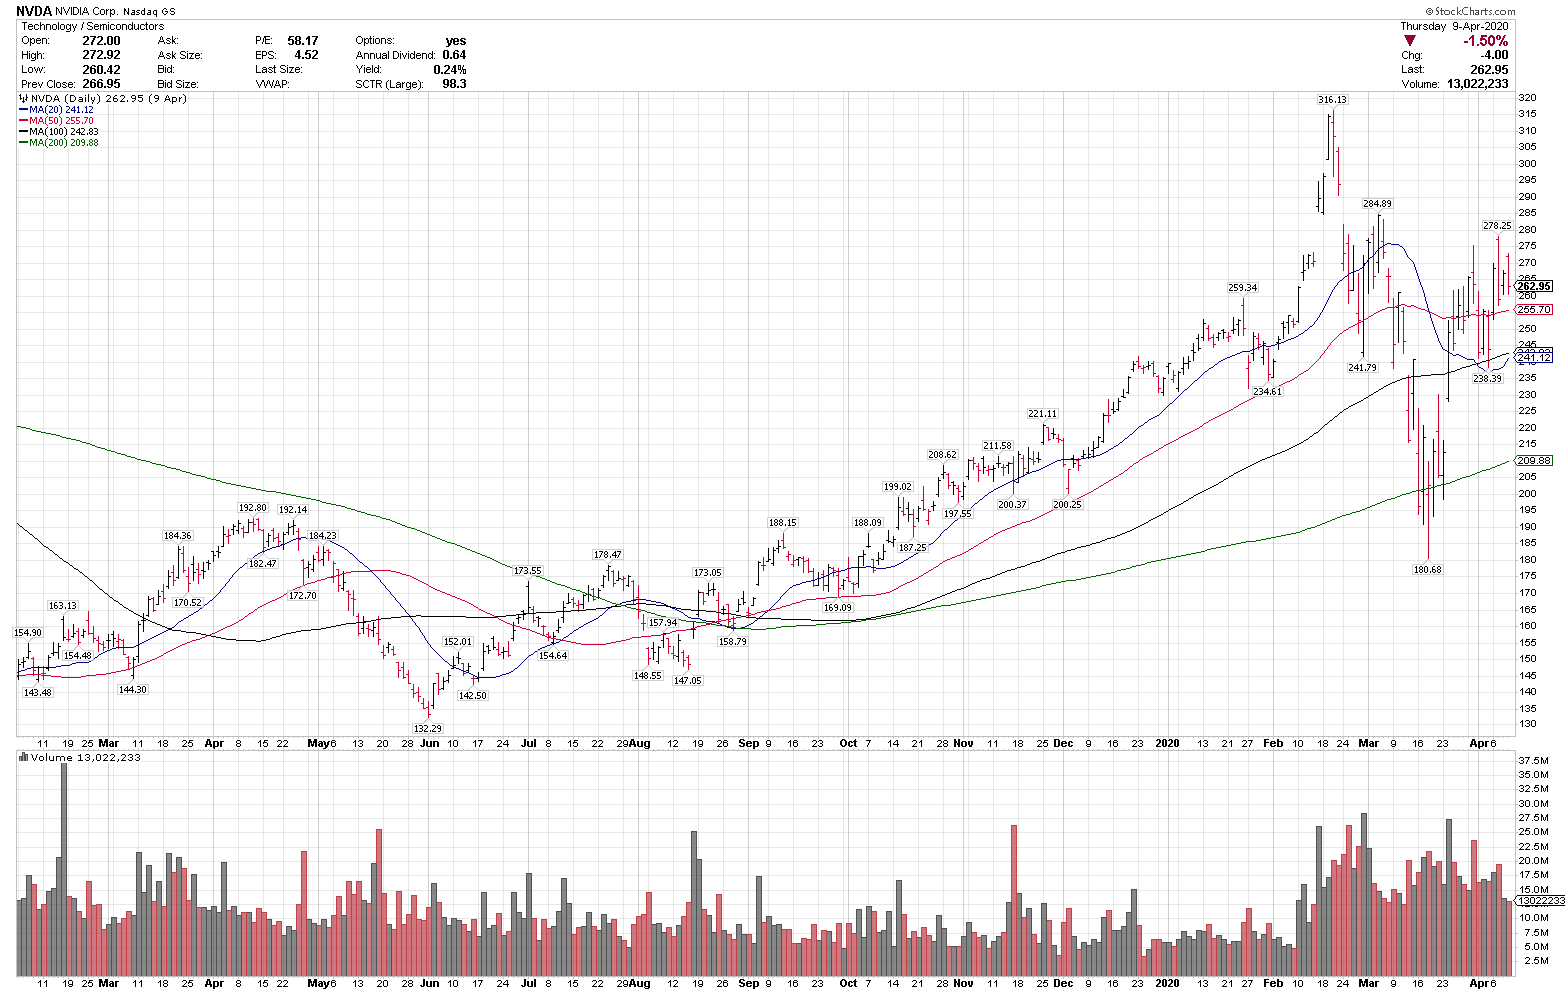
4/09/20
$SHOP
Close: 414.51
Pre-market: 410.84
Stop level: 15%
$SHOP is in a longer-term uptrend, with a rising 100 and 200-sma, having just reclaimed the 200-sma and a key $400 level.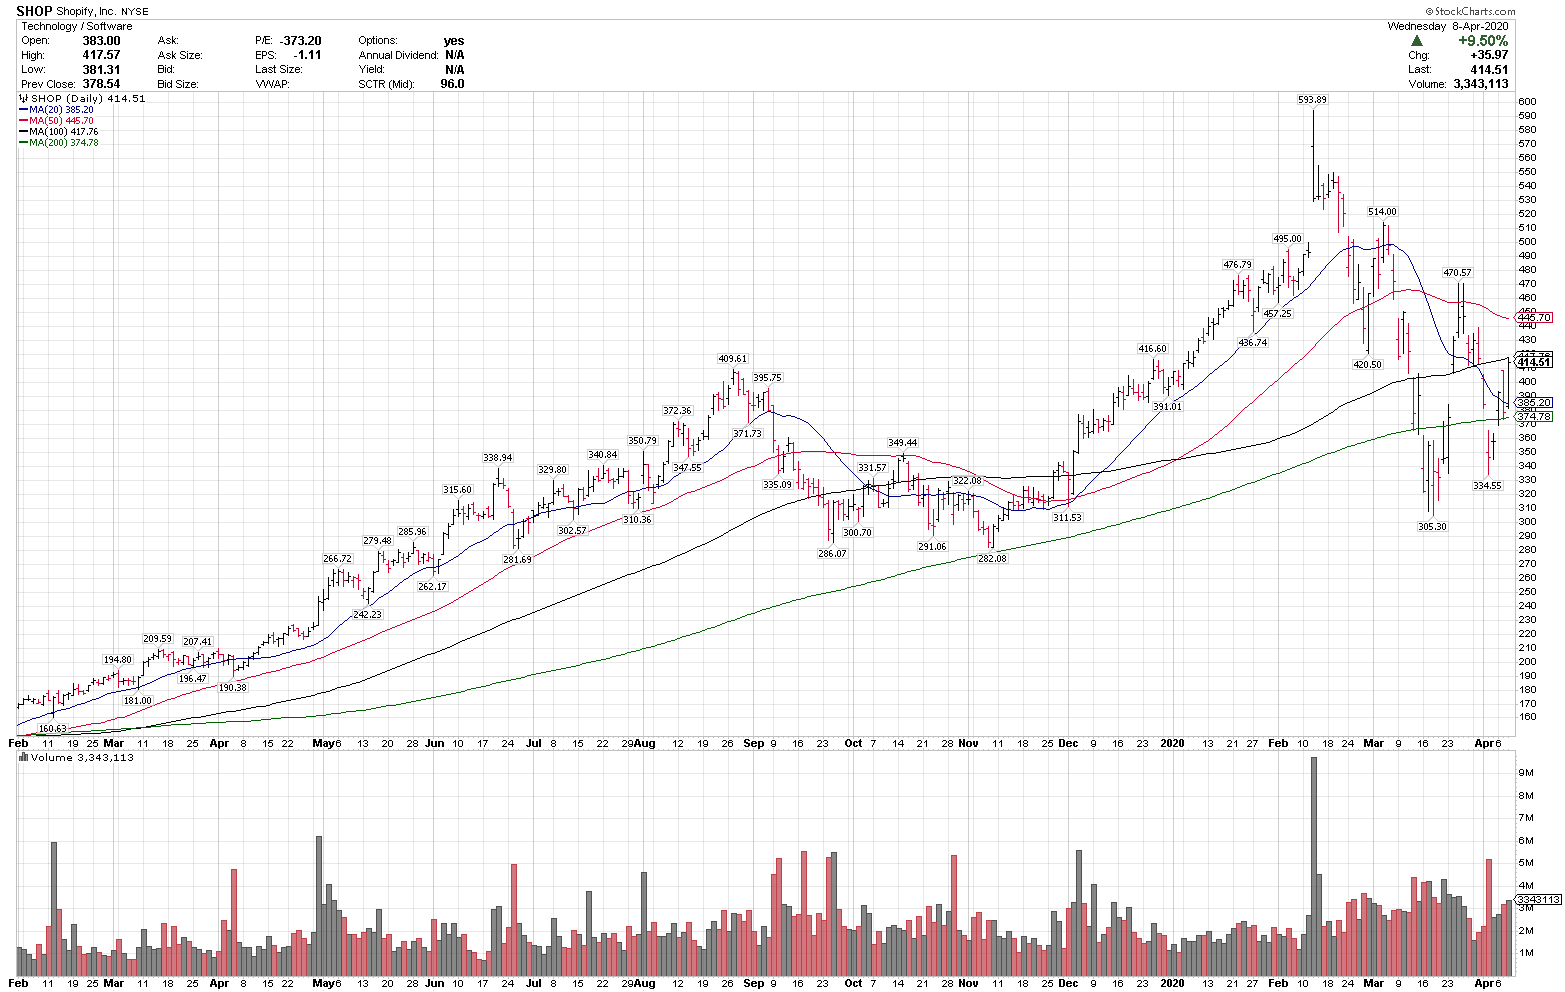
4/08/20
$LLY
Close: 141.88
Stop level: 120.59
$LLY is in a longer term uptrend and showing very high Relative Strength, currently within 3.6% of all time highs. Healthcare as a group is at the higher end of it’s range, so some consolidation could be expected, but not necessary.
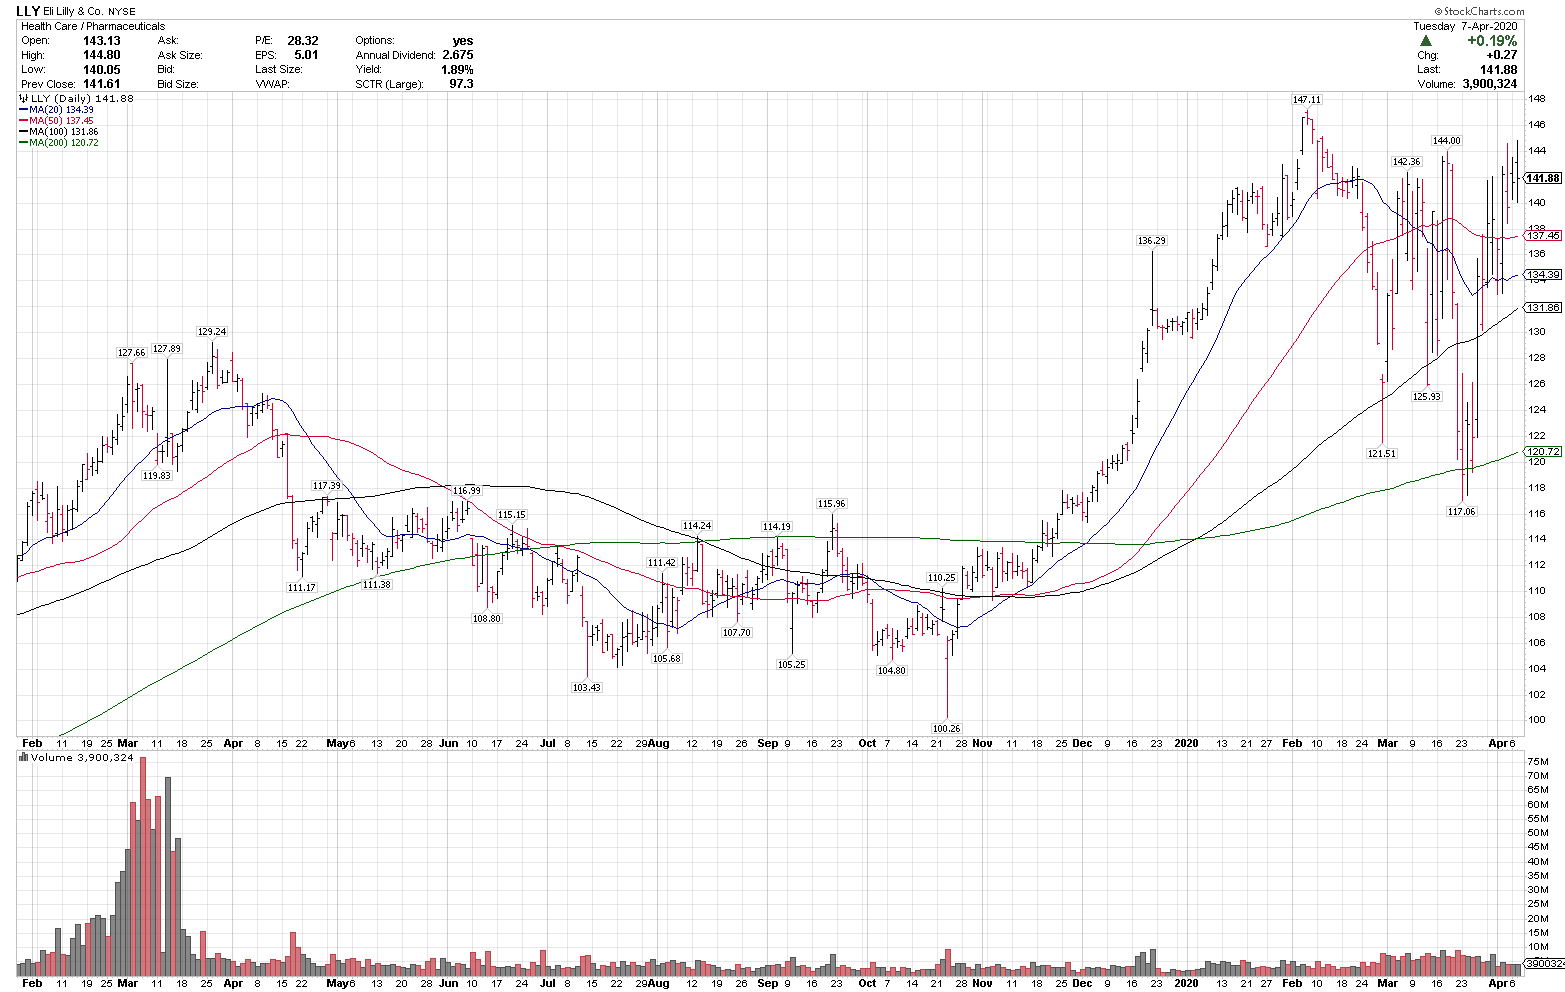
4/07/20
$AAPL
Close: 262.47
Pre-market: 268.34
Stop level: 15%
$AAPL reclaimed both the 20-sma and more important 200-sma yesterday. Holding over the recent low level at 235 is key on any pullback.
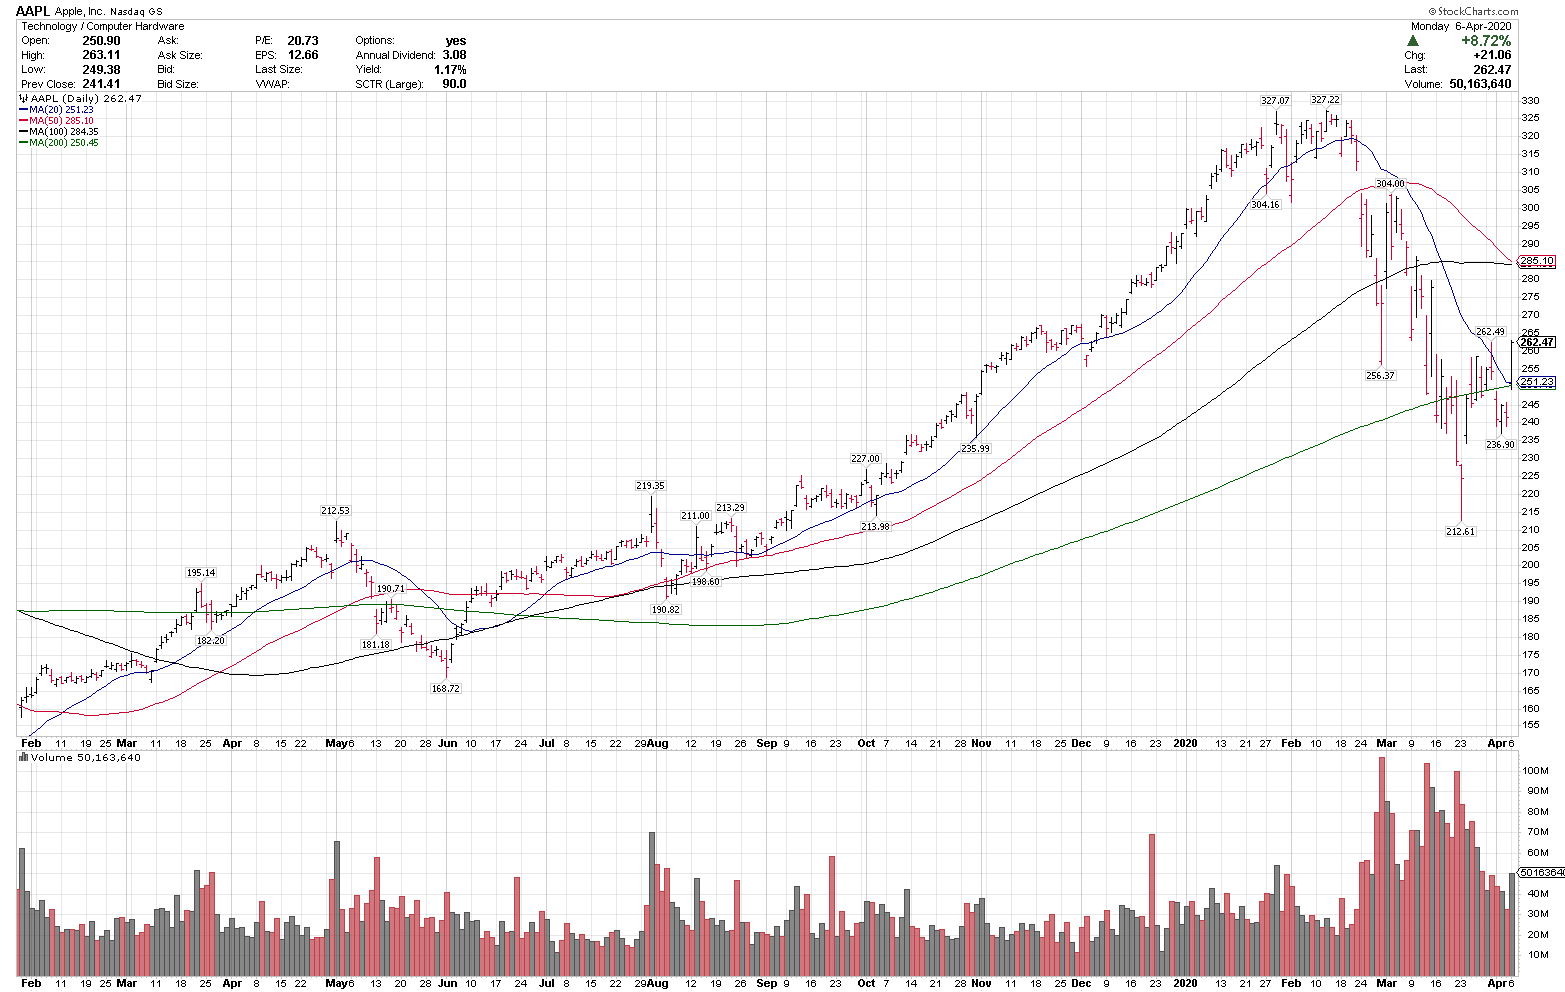
4/06/20
$NFLX
Close: 361.76
Pre-market: 369.18
Stop level: 15%
$NFLX is in a longer term uptrend above all key MAs.
4/03/20
$NEM
Newmont Mining
Close: 48.23
Stop level: 40.59
$NEM is in a longer-term uptrend above rising 50, 100 and 200-smas.
4/02/20
$ZTO
Close: 26.32
Stop risk level: 22.37
$ZTO is a profitable $20B mkt cap. co. in the express delivery sector in China, with e-commerce exposure. It is in a longer term uptrend above all key rising MAs.
4/01/20
$ATVI
Close: 59.48
Pre-market: 58.01
Stop level: 49.30
$ATVI is in a longer-term uptrend above a rising 100 & 200-smas. Futures are weak this morning, & overall market direction could have an impact. The chart is a stand alone technical idea, not a market call.
3/31/20
$ADBE
Close: 318.39
Pre-mkt: 319.30
Stop level: 270.63
$ADBE recently reclaimed the rising 200-sma and is holding over a key $300 support level for now.
3/30/20
Clorox
$CLX
Closing price: 173.19
Stop level: 152.28
$CLX is in a longer-term uptrend above rising the 50, 100 and 200-sma. ( $CLX was our Chart of the Day on 3/12 at 163 and moved to 214. It is back into it’s base & held the recent 50-sma test.)
3/27/20
$REGN
Regeneron Pharmaceuticals
Close: 452.30
Stop risk level: 384.45
$REGN is in a longer term uptrend, above the rising 50, 100 & 200-sma.
3/26/20
$AMD
Close: 44.63
pre-market: 45.30
Stop risk level: 15%+ (stop would need to go below the 200-sma)
$AMD is a top longer term idea, in an uptrend with no closes below the rising 200-sma. Shorter term price volatility is a factor on all charts recently.
3/25/20
$AMZN
Close: 1940.10
Pre-market: 1933.88
Stop risk level: 1643.79
$AMZN is in a longer-term uptrend above a rising 200-sma and showing higher RS.
3/24/20
$DOCU
Close: 83.50
Pre-market: 87.00
Stop risk level 15%
$DOCU is in a longer term uptrend with rising 50, 100 and 200-sma and recently held the 200-sma test. $DOCU was highlighted in the last Weekly Trend Report and mid-day on 3/23.
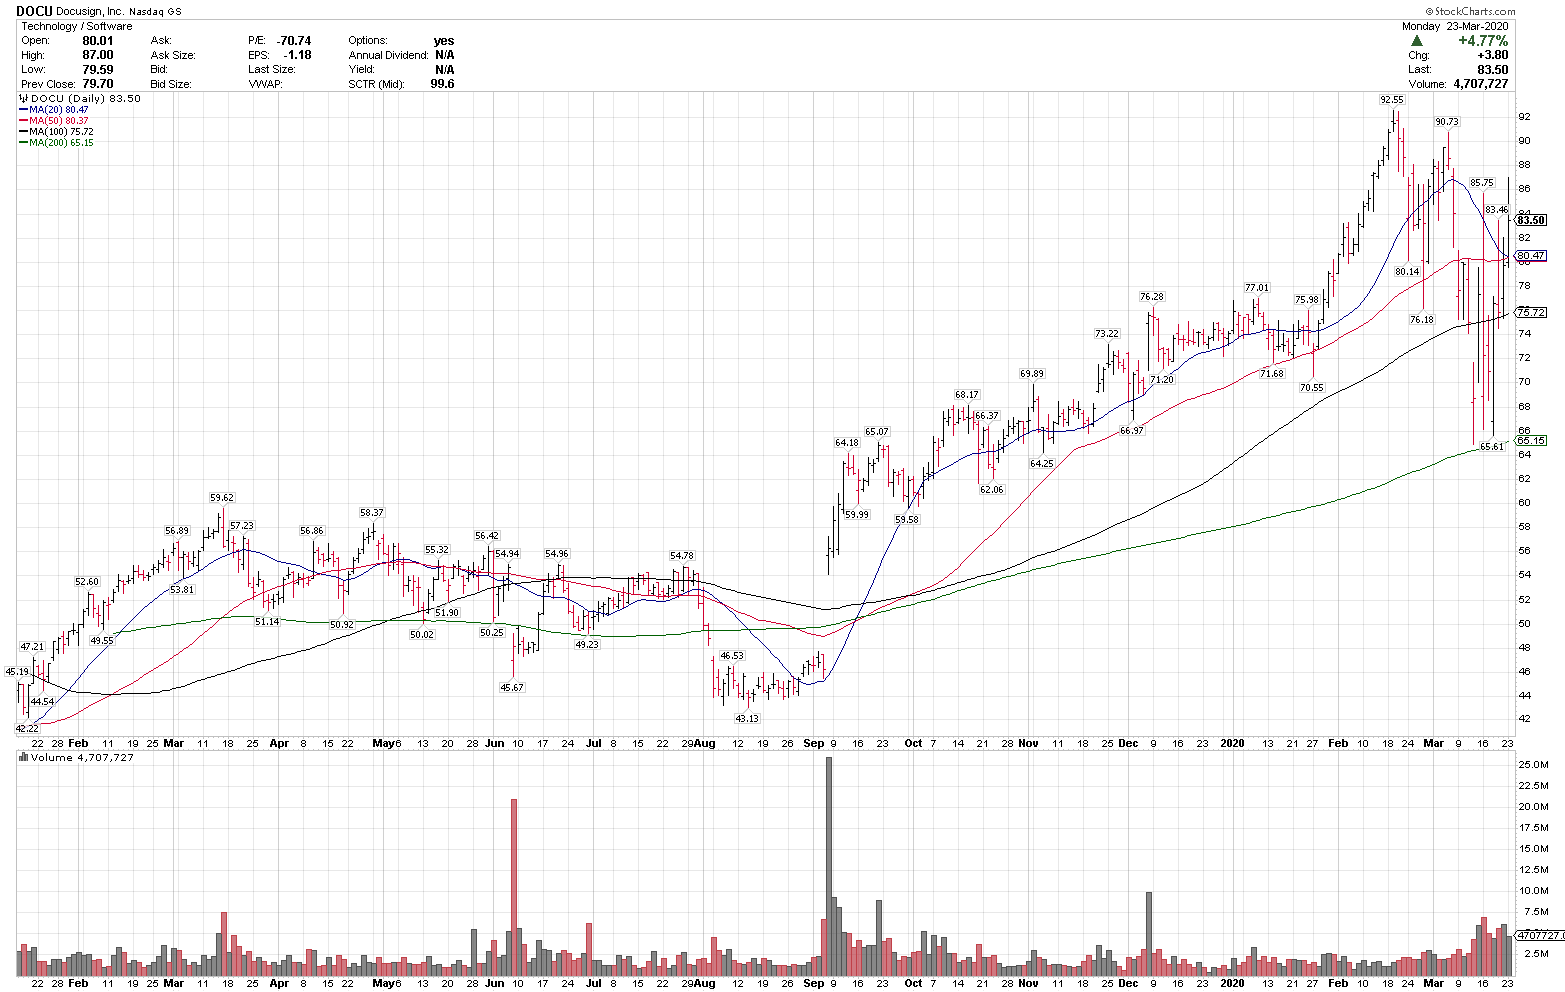
3/23/20
$GILD
Close: 73.26
Pre-market: 74.94
Stop-risk level: 63.69
$GILD is sitting on top of a 3 year base, trying to break out, with a rising 20, 50, 100 and 200-sma.
3/20/20
$MSFT
Price when posted in Daily Report
142.71
Pre-market: 148.98
Stop risk level: 15%
$MSFT has held 3 recent tests of 135, and is holding a key 130-140 support level for now.
3/19/20
$WMT
Pre-market: 121.05
Stop risk level: 102.89
$WMT is in a longer-term uptrend and made a new all-time high yesterday, a sign of technical strength.
3/18/2020
$ZM
Pre-market: 107.85
Stop risk level: 91.67
$ZM is in a longer term uptrend, above a rising 50, 100 & 200sma. 97-107 is a key support range.
3/17/20
$MASI
$9.5B mkt cap
Closing price: 174.19
Stop risk level: 148.06
$MASI is in a longer-term uptrend above rising 50, 100 and 200-sma, and is positive YTD in a weak market, showing higher relative strength. A higher volatility name.
3/16/20
Today’s ‘Chart of the Day’ is more of a watch list chart than technical idea for the day.
Gold
Pre-market: $1468.60
Gold initially rallied > $1550 last night, but like many assets, might be caught up in a near-term liquidity crunch here. $1460 & $1400 are key long term levels.
Gold Weekly 2008 – 2020
The Fed’s first round of QE was in Nov of 2008, which launched a Gold multi-year move from $681 to $1923. Every market is unique, and price has to prove itself, but something of note if prices stabilize & start higher at some point. Wait and see for now.
3/12/20
$CLX
Pre-market: 163.20
Stop level: 142.86
$CLX is in a longer term uptrend above the rising 50/100/200sma and is a ‘defensive’ consumer staples stock, with a wide price base in the 144-158 range.
3/11/20
Chart of the Day
$JD
Pre-market price: 40.94
Stop risk level: 34.79
$JD is in a longer-term uptrend above all key rising moving averages, and recently made a new 52-week high, a sign of relative strength in a weaker market.
3/10/20
Nasdaq 100 ETF
$QQQ
Close: 193.57
Pre-market: 201.54
Today’s Chart of the Day is not a ‘trade idea’ right now. It is the key chart that I am watching today to see how it trades intraday, vs the 200-sma, & into the close. I am not taking any new equity positions as of yet.
3/05/20
New Oriental Education & Technology Group
$EDU
Close: 134.59
Stop level: 114.40
$EDU is in a very steady longer-term uptrend above the rising 50, 100 & 200-day moving averages. The recent higher volatility equates to a wider stop. Also in a key focus space, China Internet.
3/04/20
SPDR Gold ETF
$GLD
Closing price: 153.89
Stop risk level: 138.49
$GLD is in a longer-term uptrend, above all key rising MAs, with a recent test of the 50-sma. This is also a key focus group for us. I am planning to start a longer-term position today.
3/03/20
iShares Global Clean Energy ETF
$ICLN
Closing price: 12.69
Stop risk level: 11.42
$ICLN is in a longer-term uptrend above the rising 50, 100 and 200-sma and is a core focus area for us. I am planning to take a position this morning.
3/02/20
Nasdaq 100 ETF
$QQQ
Current price: 205.32
Stop risk level: 194.80
$QQQ had a very high volume reversal off the rising 200-day moving average on Friday and gave very strong buy signals. The stop risk level is close. We have been accumulating a position this morning, per the Weekend Video.
FEBRUARY 2020 ‘CHARTS OF THE DAY’
2/28/20
$WORK
Slack Technologies
Market cap: $13.95B
*watch-list name only
$WORK has technically held up relatively well, just now testing the rising 20-day moving average and price support in the 20-23.50 range.
2/27/20
$GDX
Van Eck Gold Miners ETF
Close: $29.87
Stop risk level: $26.28
$GDX is in a major longer-term uptrend above all key MAs. $GDX recently touched a 46-month high, and has consolidated 6.8% since then. This and Gold are technically bullish groups here. I expect higher volatility in all markets. We are currently long.
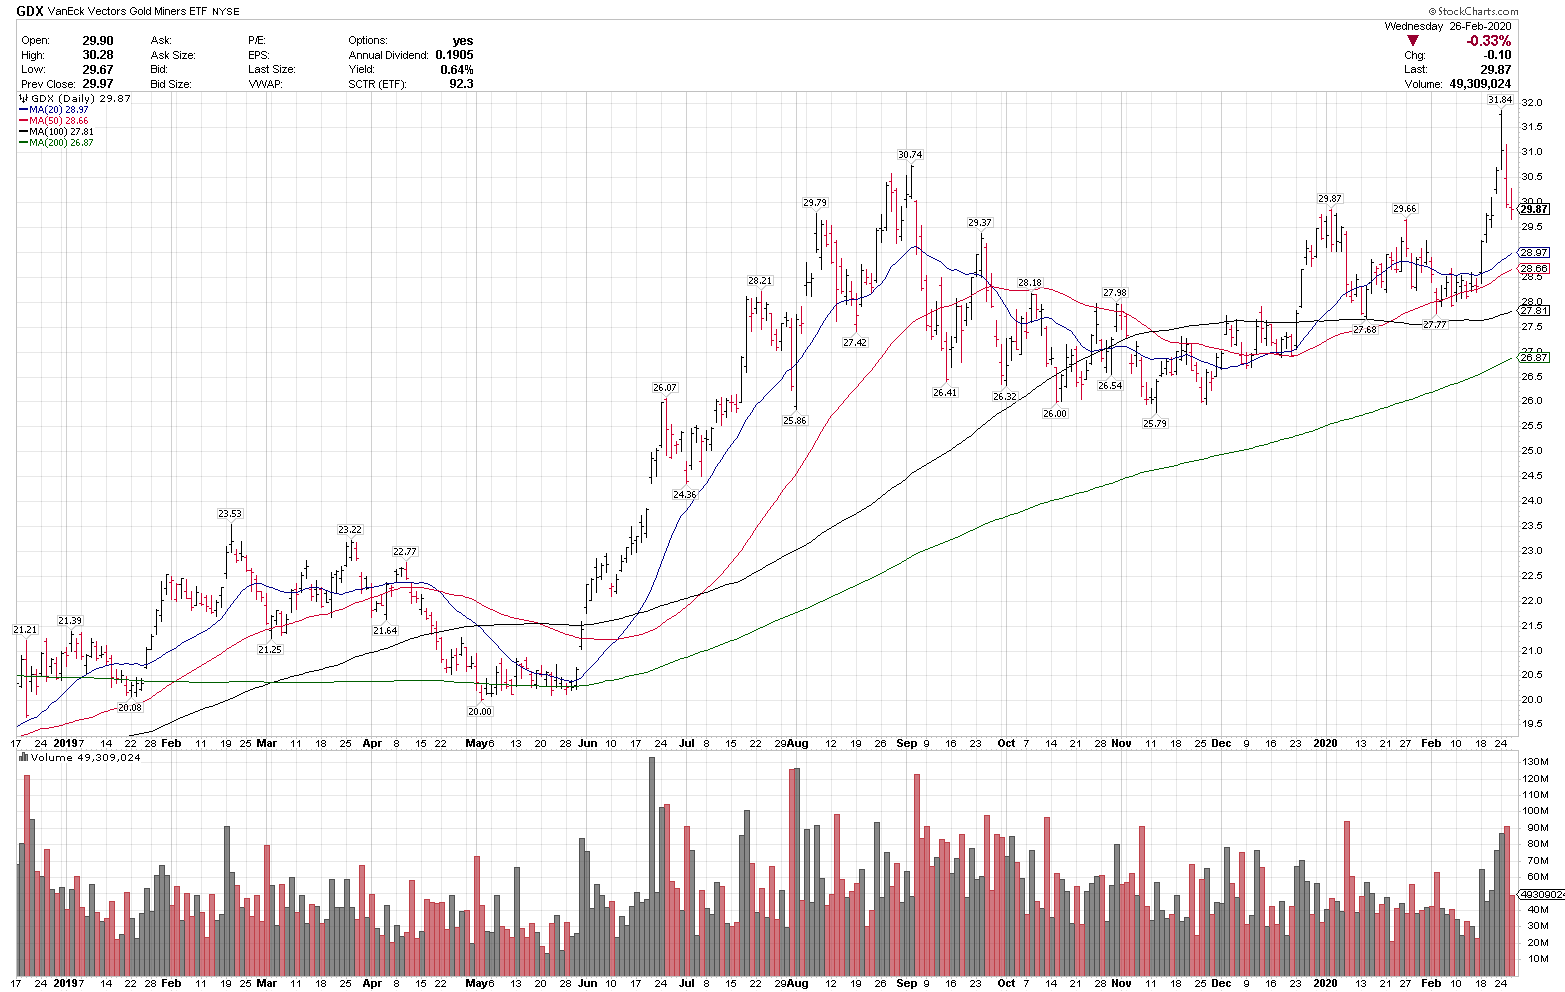
2/26/20
$TEVA
Teva Pharmaceuticals
Close: 13.24
Stop level: 11.25
$TEVA is in a major uptrend above all key MAs, is +.38% this week in a weak market and the #6 large cap top performer YTD, showing high relative strength. It has a 4.9% daily volatility range = wider stop. BlueChip Daily is currently long $TEVA as well.
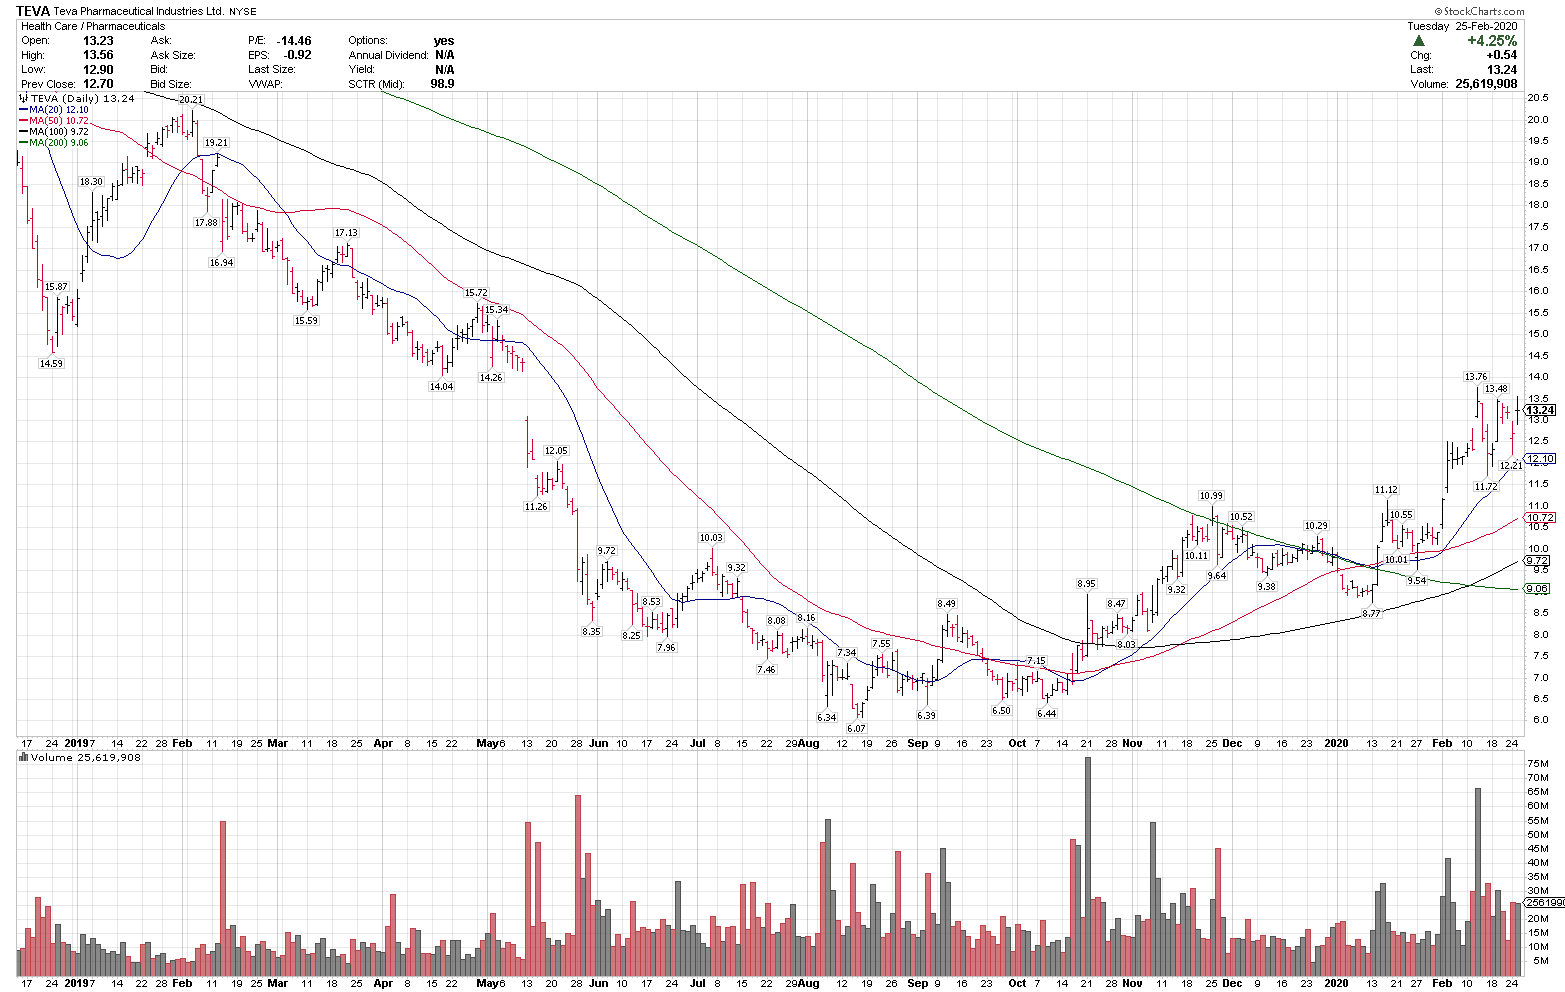
2/25/20
$QQQ
Nasdaq 100 ETF
Closing price: $221.39
Stop risk level: $208.10
$QQQ is in a longer-term uptrend and held the rising 50-sma after 3 higher volume down days. The stop is closer at 6%, just under the rising 100-sma. I am planning to take a position this morning.
2/24/2020
S&P 500, $SPX
Friday close, 3337.75
The S&P 500 is in a longer term uptrend and under pressure this morning with futures -2.4% at 3258. The key level that I am watching here is 3214 to 3220, which was tested twice in January.
2/21/20
Paypal, $PYPL
Close: 122.43
Stop risk level: 107.73
$PYPL is in a longer-term uptrend above all key rising MAs, with no closes below the rising 50-sma since Nov. The stop is below the 200-sma. 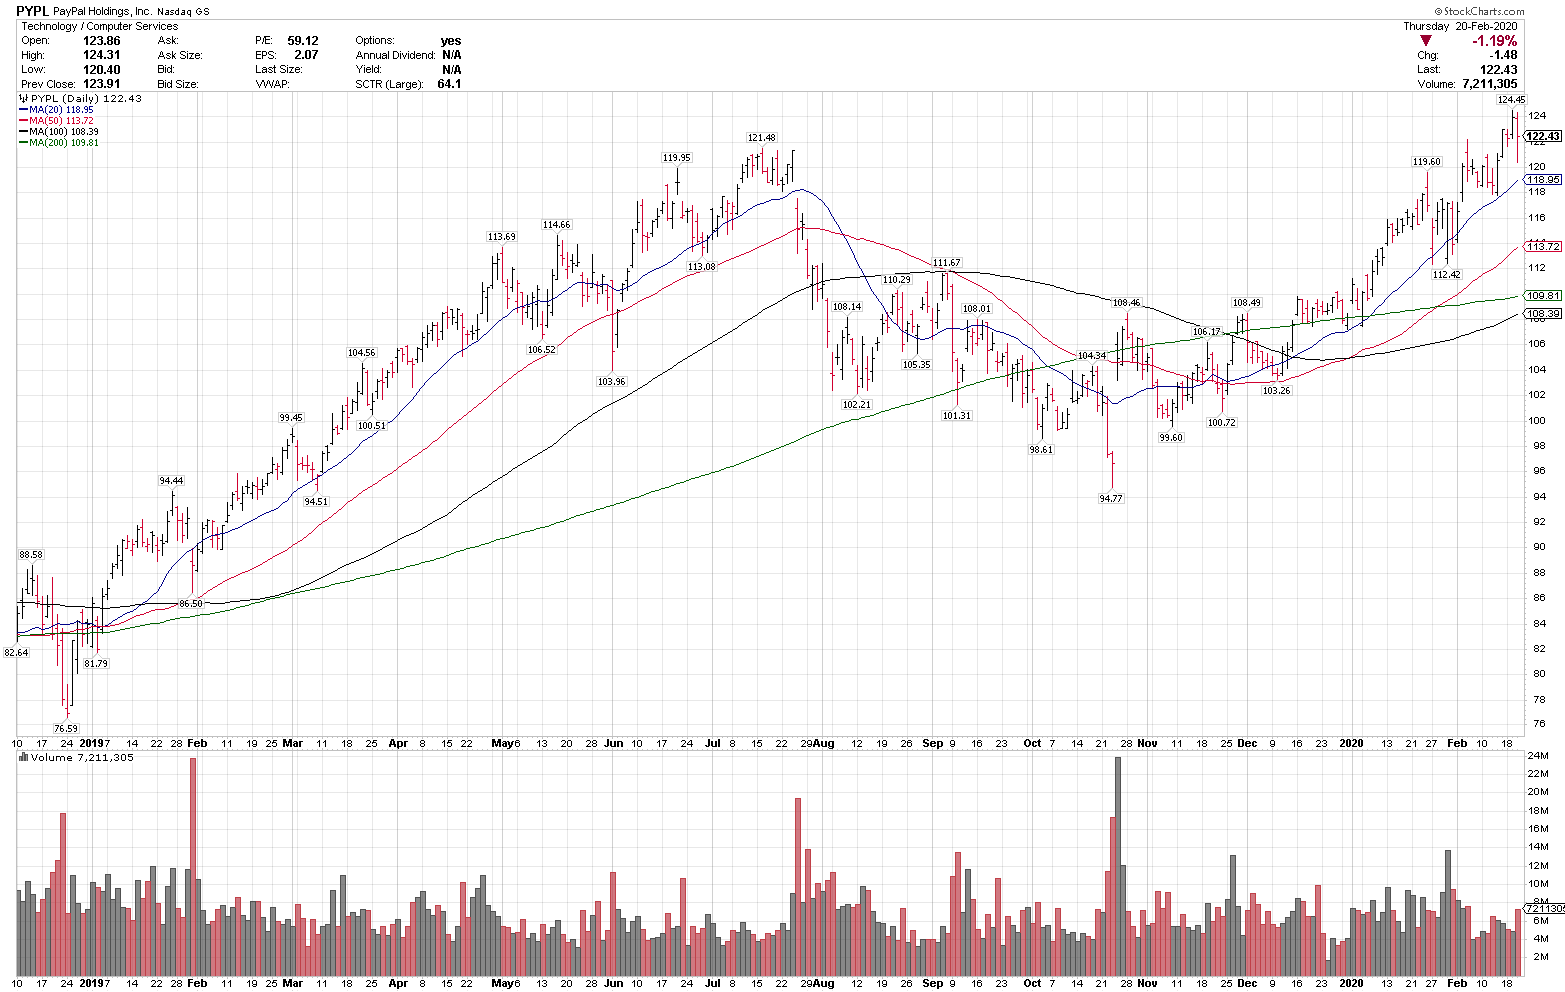
2/20/20
BAX is on hold due to multiple conflicting earnings reporting dates.
2/19/20
Twitter, $TWTR
Close: $38.06
Stop risk level: $33.49
$TWTR is in a 3-month uptrend above the rising 20 & 50-sma. The longer term trend is neutral for now. $TWTR recently reclaimed the flat 200-sma after a test and consolidation.
2/18/20
L3 Harris Technologies, $LHX
Close: $228.55
Stop: $199.52
$LHX is in a strong uptrend, recently having made an all time high, and is above all key rising MAs. There is considerable support between 205 – 215 and the stop is below the rising 200-sma.
2/14/20
Paycom, $PAYC
Close: $303.29
Stop: $266.86
$PAYC is in a longer term uptrend above the rising 50, 100 & 200-sma. It corrected sharply after earnings. The stop is at $266, but if the position is going to work, I would want to see recent lows and the 50-sma hold, at 285. $PAYC is a higher volatility name with a $17B market cap.
2/13/20
Goldman Sachs, $GS
Close: $238.65
Stop risk level: $209.74
$GS is consolidating a recent 52-week high with a constructive pullback into the rising 50-sma. $GS is in a longer-term uptrend above the rising 50, 100 & 200-sma. The stop is placed below the 200-sma and below the December low of $210.00
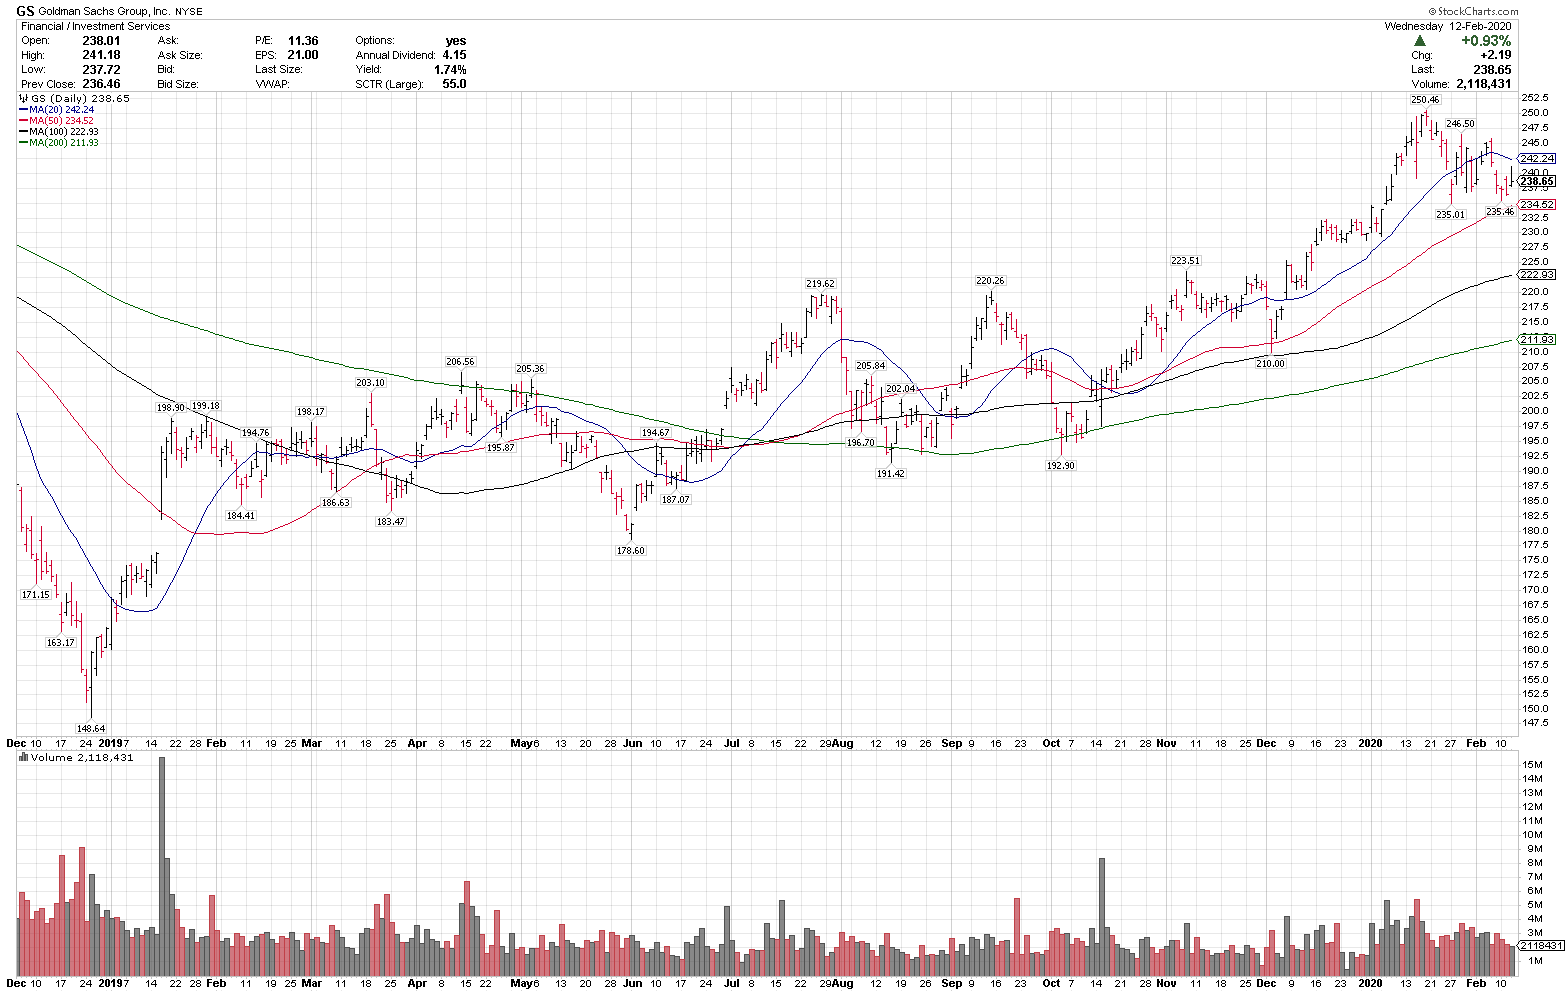
2/12/20
MercadoLibre, $MELI
Close: 651.62
Stop risk level: $573.42
$MELI is in a longer-term uptrend, above the rising 200-sma and recently made an all-time high before consolidating after earnings.
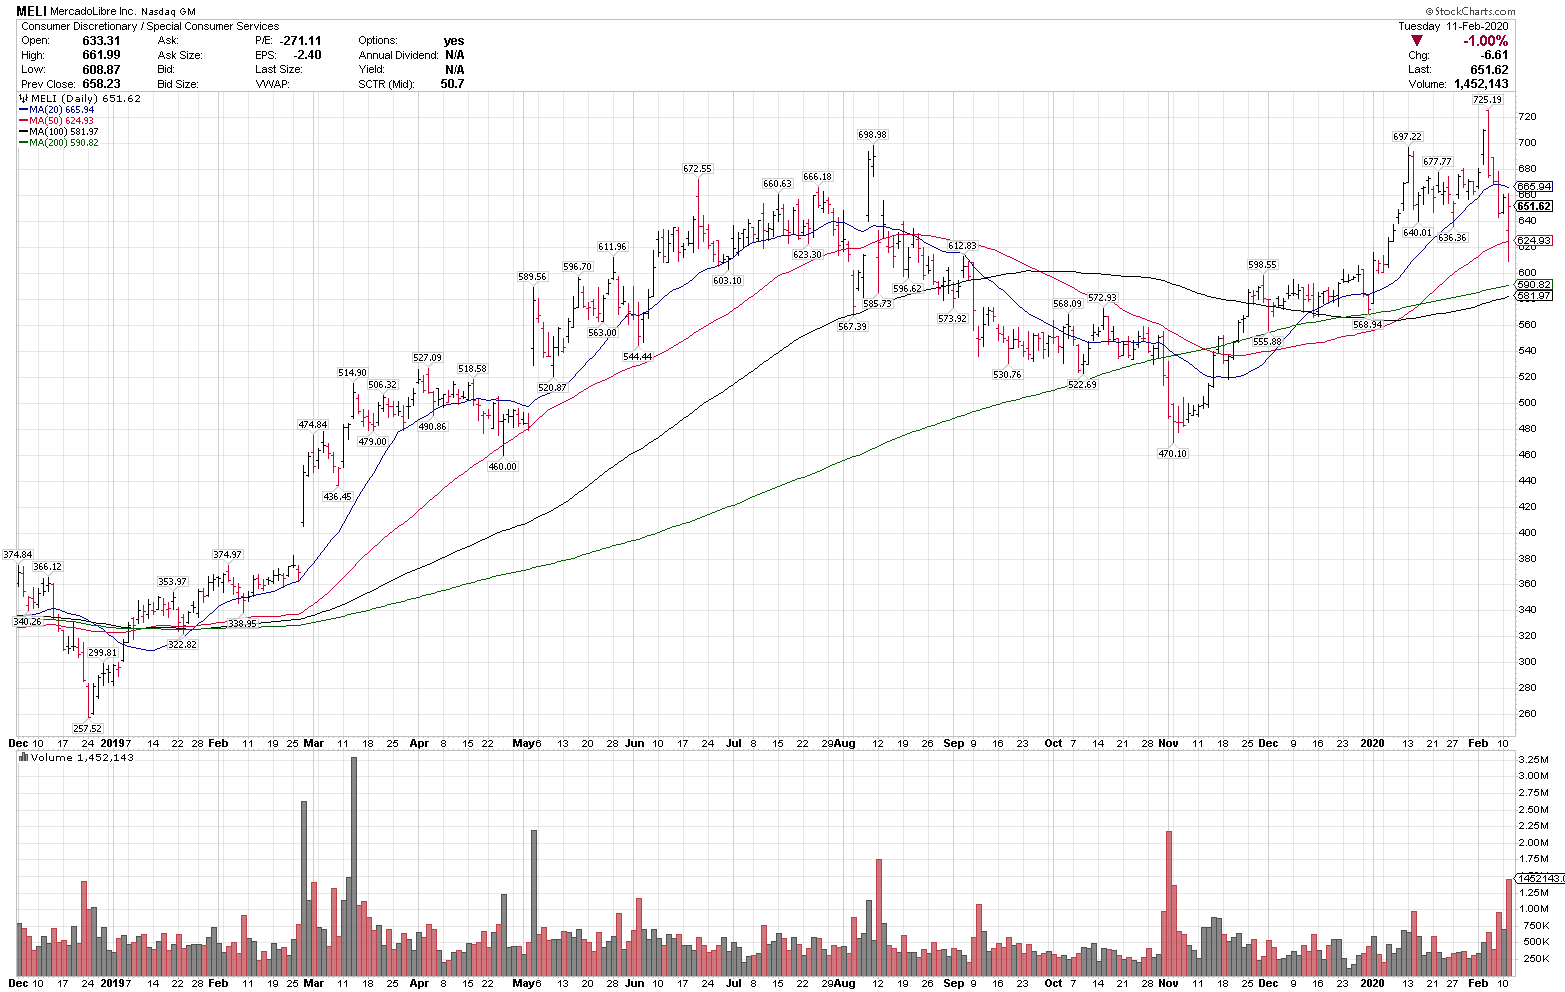
2/11/20
Visa, $V
Close: 205.99
Stop risk level: $181.27
$V is in a longer-term uptrend above all key MAs and daily momentum is turning up.
2/10/20
Platinum ETF, $PPLT
Close: $91.20
Stop risk level: $80.25
Platinum is in a longer-term uptrend above the rising 50 and 200-sma. On the Weekly chart, $95 and $100 are key upside levels, that if crossed, could signal a new leg higher.
PPLT WEEKLY
2/07/20
Facebook, $FB
Close: $210.85
Stop risk level: $185.54
$FB is in a longer-term uptrend above the rising 50, 100 and 200-smas, and just completed a 10% correction after earnings.
2/06/20
General Electric, $GE
Close: $12.86
Stop risk: $11.31
Initially on the 1/05 Best Ideas list at $11.97, $GE is in a longer-term uptrend above all rising MAs, and a top longer-term idea as well. I am planning to open a position this morning.
2/05/20
Freeport McMoRan, $FCX
Close: $12.04
Stop risk: $10.23
$FCX reached oversold on the daily chart and is coming off a successful test of the 200-sma. Daily momentum is turning back up and could benefit from a rebound in deeply oversold copper.
Copper charts below as well. The idea is based off $FCX vs the 200-sma, not on Copper. Any copper rebound could help though.
COPPER DAILY, coming off a 13 day losing streak, the longest on record per Bloomberg. https://www.bloomberg.com/news/articles/2020-01-30/copper-falls-in-record-losing-streak-as-china-extends-holidays
COPPER WEEKLY, vs 2.50 potential support
2/04/20
Shopify, $SHOP
Price: $475.64
Stop risk: $413.80
$SHOP is in a major uptrend with two recent 20-sma range tests. The earnings report is scheduled for next week and I view this as a higher risk vs reward scenario. I am planning to take a position this morning for the newsletter account. A “lower risk” position would have a stop below the 50-sma and a smaller position.
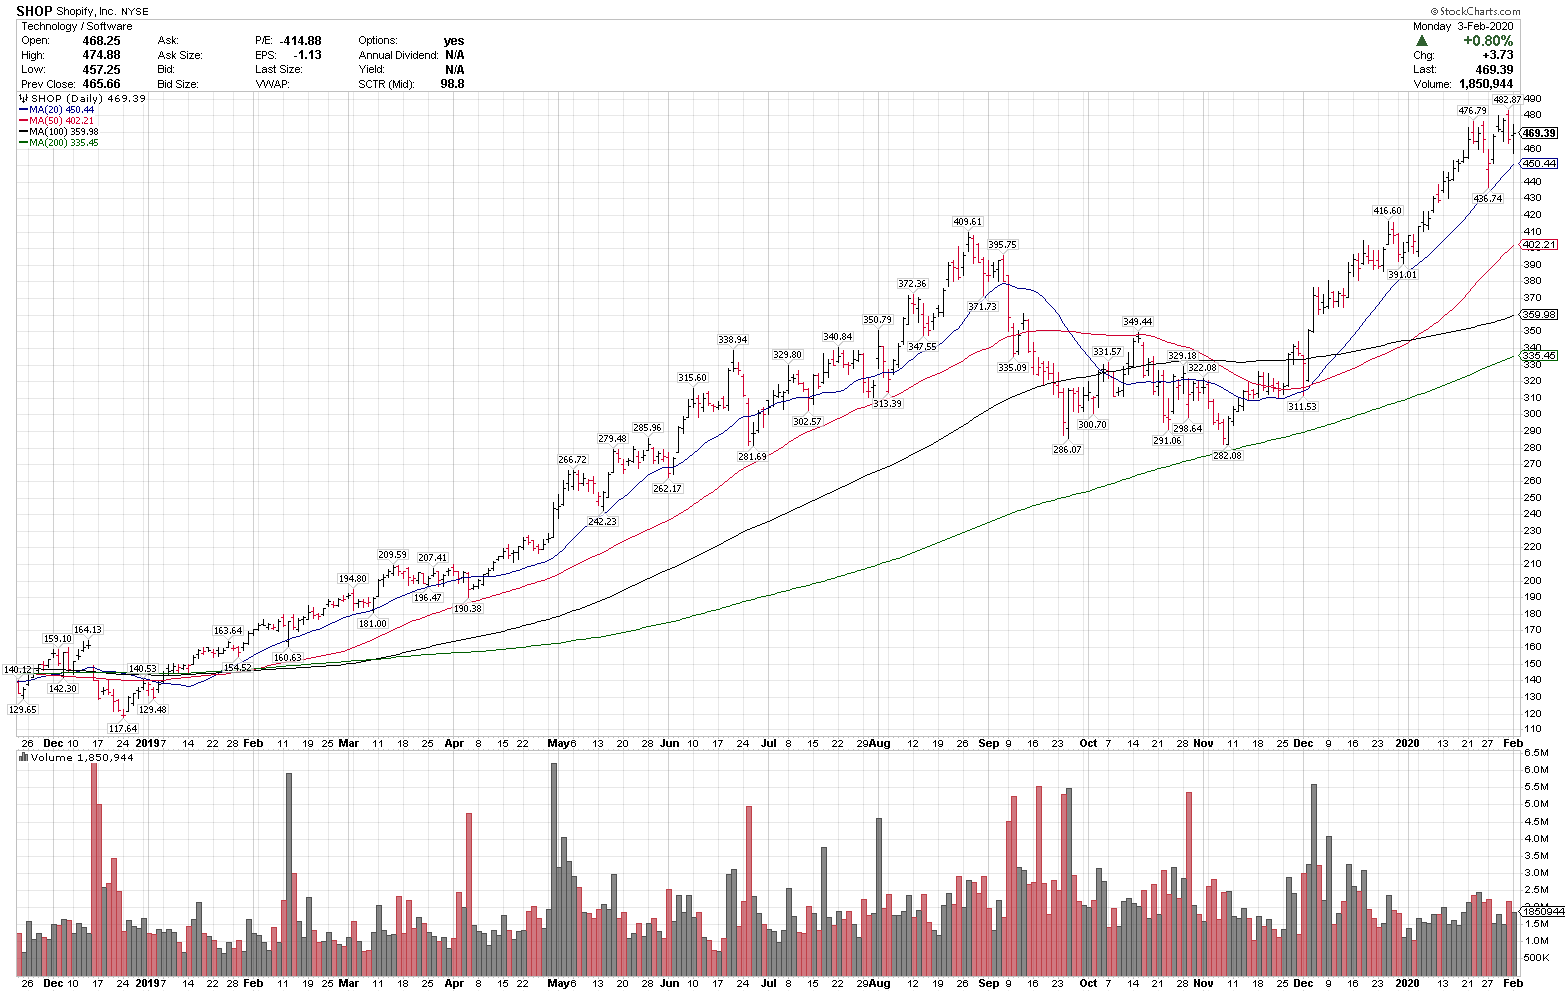
2/03/20
Bank of America, $BAC
Prior close: $32.83
Stop risk: $29.44
$BAC is technically oversold on the daily chart, into the rising 100-sma at 32.23. Major support is at 30.00-30.50, and the rising 200-sma is at 30.23.