This week’s focus chart is actually two:
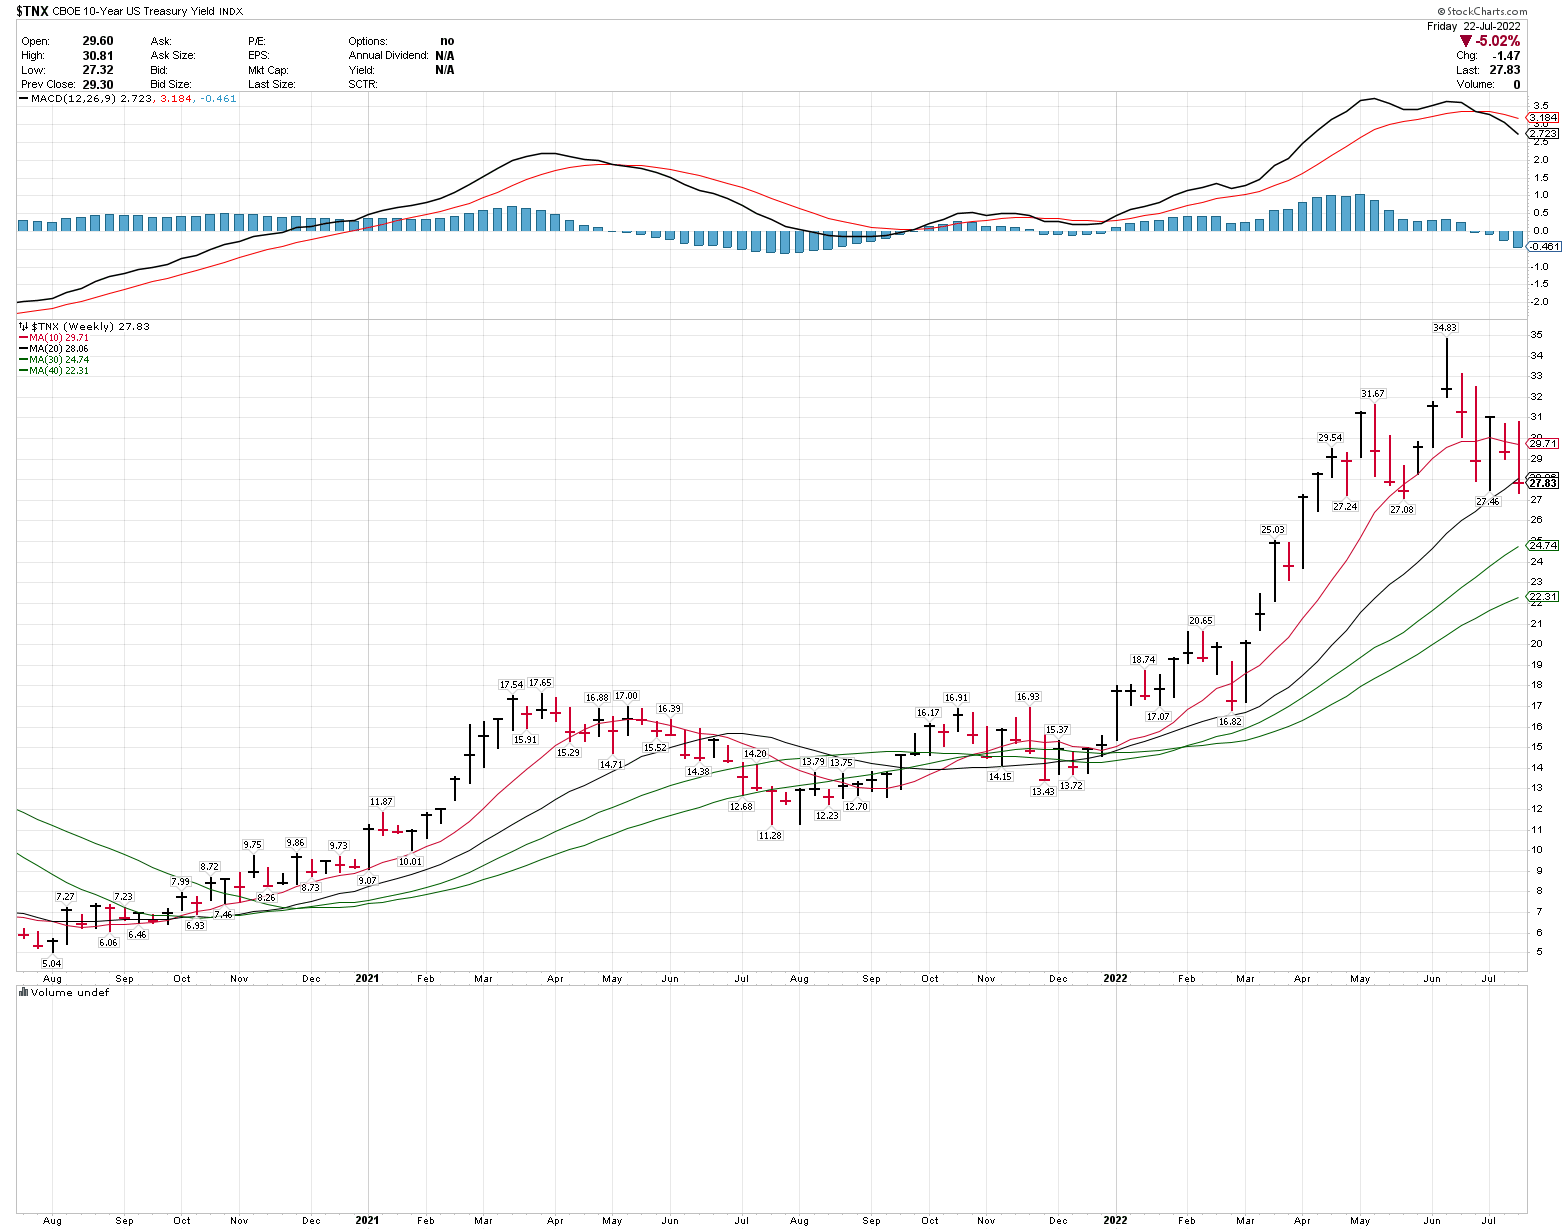
- 10-year UST bond yields (TNX)
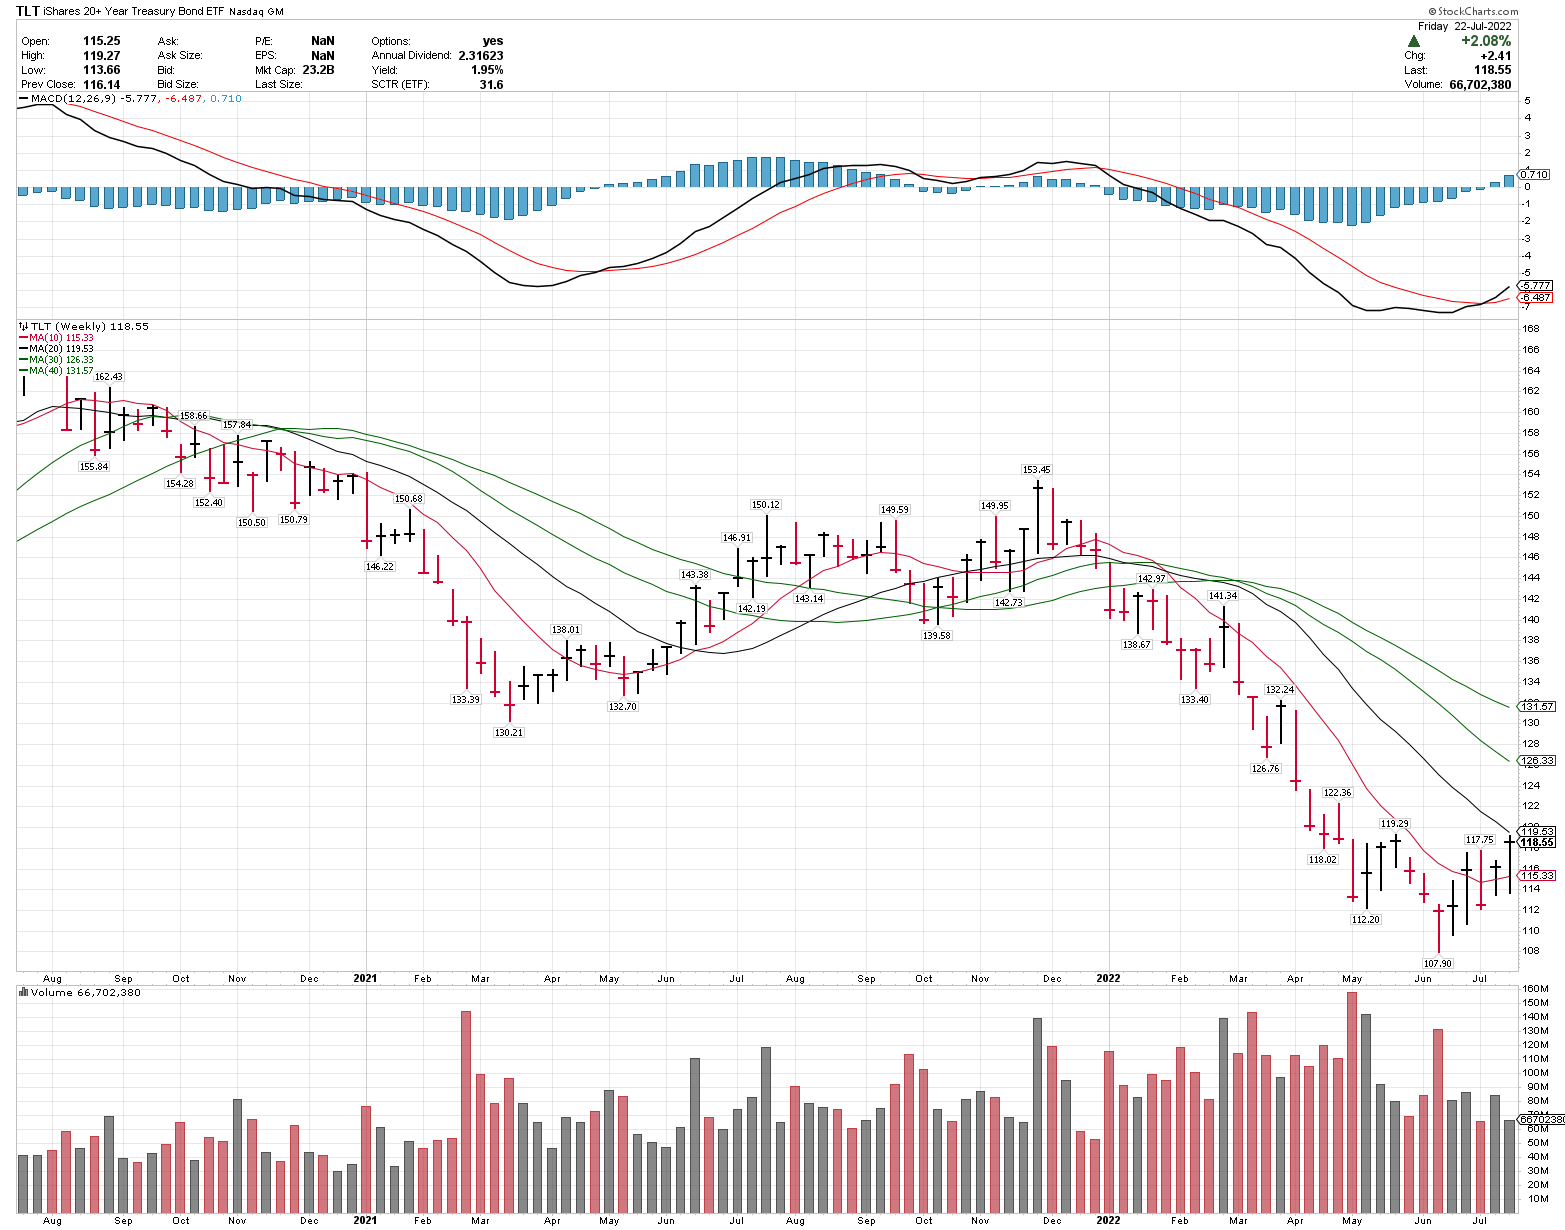
- iShares 20+ year Treasury Bond ETF (TLT)
- The bond market, inflation expectations and the Federal Reserve Open Market Commitee (FOMC) are driving major moves in the equity and commodities markets as well.
The 10-year US Treasury Yield chart (TNX) put in a recent high 6-weeks ago, after reversing off of 11-year highs at 3.483.
- (TNX) turned down after the FOMC raised short-term interest rates by 75 basis points, on 6/15/22.
- Since then, bonds and stock indices have turned higher and crude oil has pulled back sharply.
- The weekly MACD (trend momentum) turned down 4-weeks ago and (TNX) closed below the 20-week MA on Friday for the first time in 2022.
iShares 20+ year Treasury Bond ETF (TLT)
- Trading opposite of (TNX) currently, UST Bond ETF (TLT) put in a recent low 6-weeks ago, made a bullish weekly MACD cross two weeks ago and has reclaimed the 10-week moving average.
This is expected to be a very busy week, with major mega cap earnings from Apple (AAPL), Amazon (AMZN), Google (GOOGL), Meta (META) and Microsoft (MSFT).
Also this week is the FOMC rate decision, the 2nd Quarter GDP report and the PCE inflation index report.
Any one of these events, by themselves , can move markets. All of them in one week could lead to sharp moves, in both directions.