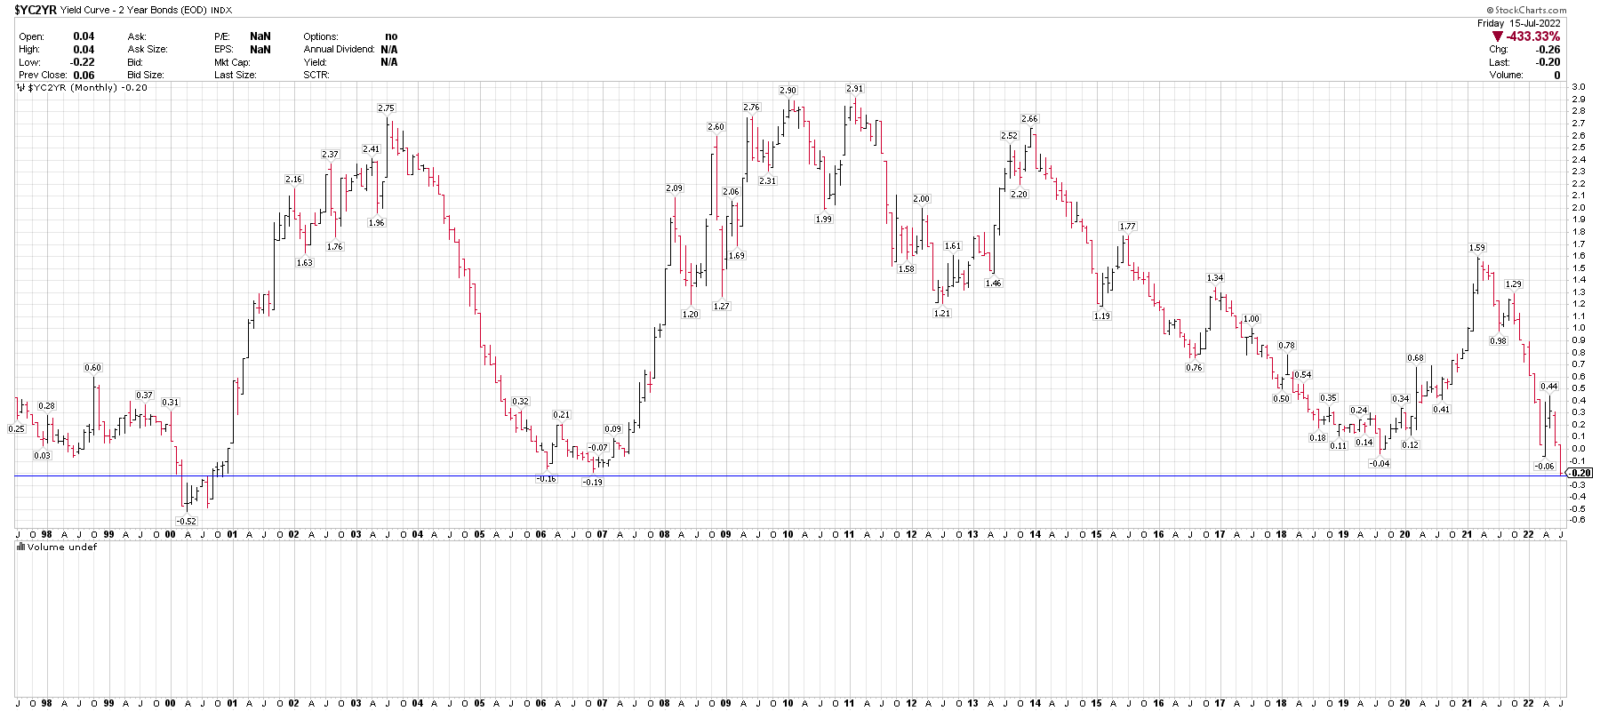
The 2-year yield curve above measures the spread between the 2-year U.S. Treasury Note and 10-year U.S. Treasury Bond.
When the 2-year yield is higher than the 10-year yield, it is said to be inverted and often precedes an economic slowdown.
The current reading of -0.20 is the lowest level since December 2000.
START YOUR 30-DAY FREE TRIAL HERE TO BE LEARN HOW TO GET POSITIONED CORRECTLY: VIP – Blue Chip Daily Trend Report
SEE LARRY’S BEST MARKET CALLS, FOR SUBSCRIBERS ONLY, OVER THE PAST 60-DAYS: Our Best Recent Market Calls – S&P 500, Nasdaq 100, Fed Rate Hikes, CPI, ARKK, Mega-caps – Blue Chip Daily Trend Report