11/29/20
Blue Chip Daily Chart of the Week:
SPDR S&P Oil & Gas E&P ETF, XOP
Close: 57.88
Stop level for position traders and investors: 48.61
please see chart analysis below
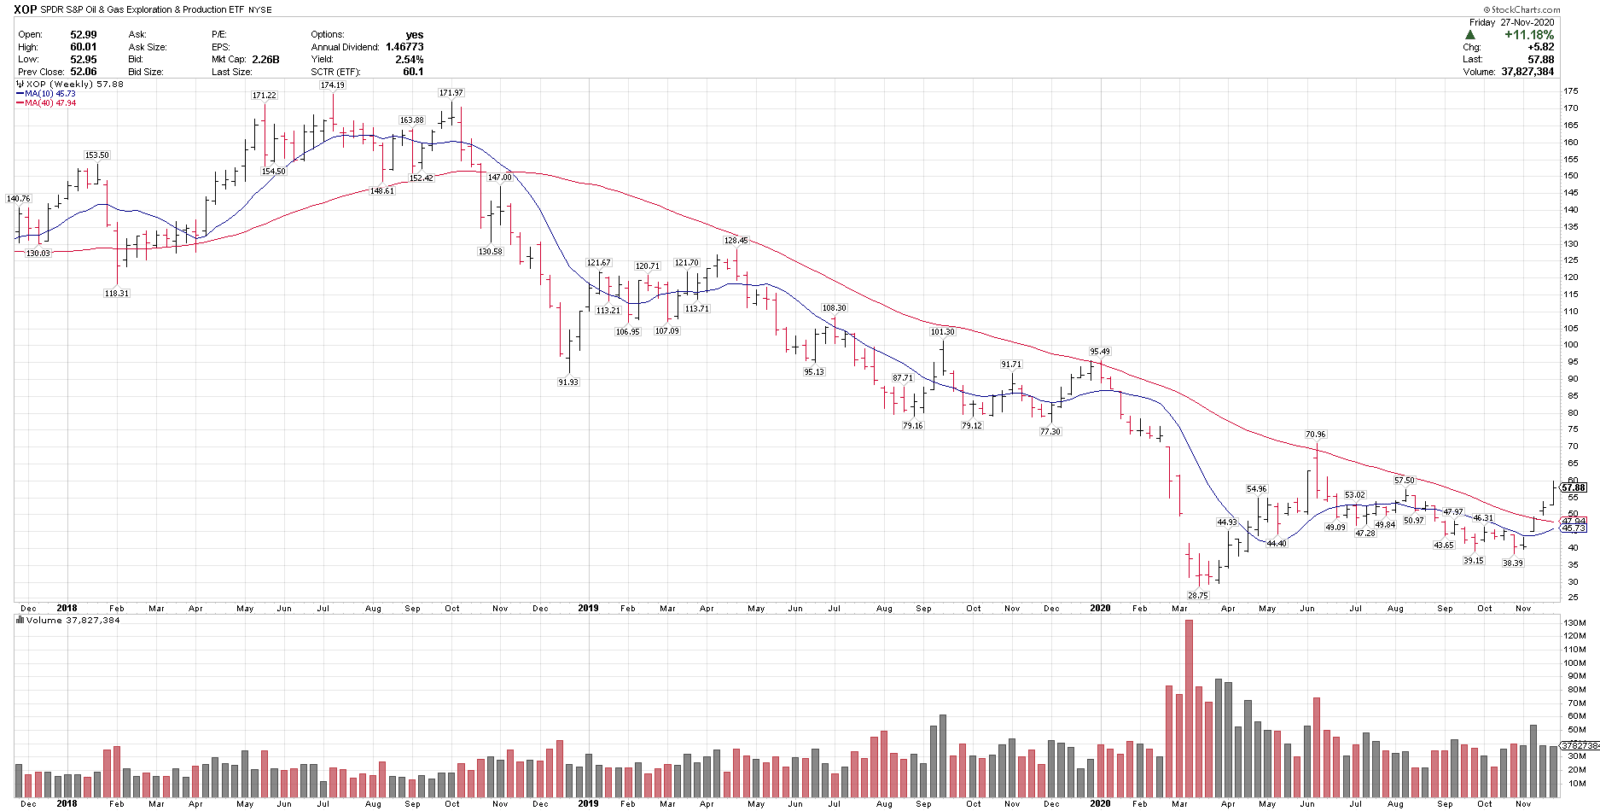
- XOP is one of our Top “Recovery Ideas” here – initially highlighted for our Members on 11/14/20 at $48.86.
- XOP recently reclaimed the 40-week moving average, after spending 25 months below it, as the chart above illustrates.
- From a trend following perspective, the reclaim of the 40-week MA is a bullish technical signal, after such a long time below.
- XOP is currently trading above all key MAs and a rising 20 & 50-sma.
- XOP closed at it’s highest weekly level since early June 2020 and is constructive here and over $50.
- This could be a more volatile, higher potential reward/higher risk idea, and likely tied to a potential economic recovery.
Disclosures:
- I am long XOP from 11/17/20 at $50.24.
- XOP went onto our Chart of the Day Buy List as well on 11/17 and onto our Best Ideas ETF List on 11/22 and 11/29/20 as well. (please see below)
Join us now to get trade signals like this daily, before they break out, and to get immediate access to my Weekly Top 25 Stocks Buy List, published today. https://bluechipdaily.com/join-blue-chip-daily/
See my our best performing recent trade alerts for Members:
https://bluechipdaily.com/nov-top-performers/
Have a great week,
Larry Tentarelli
Publisher