4/10/22
Blue Chip Daily Chart of the Week:
Exxon Mobil (XOM)
Close: 86.84
Trend following stop: 74.40
please see chart analysis below
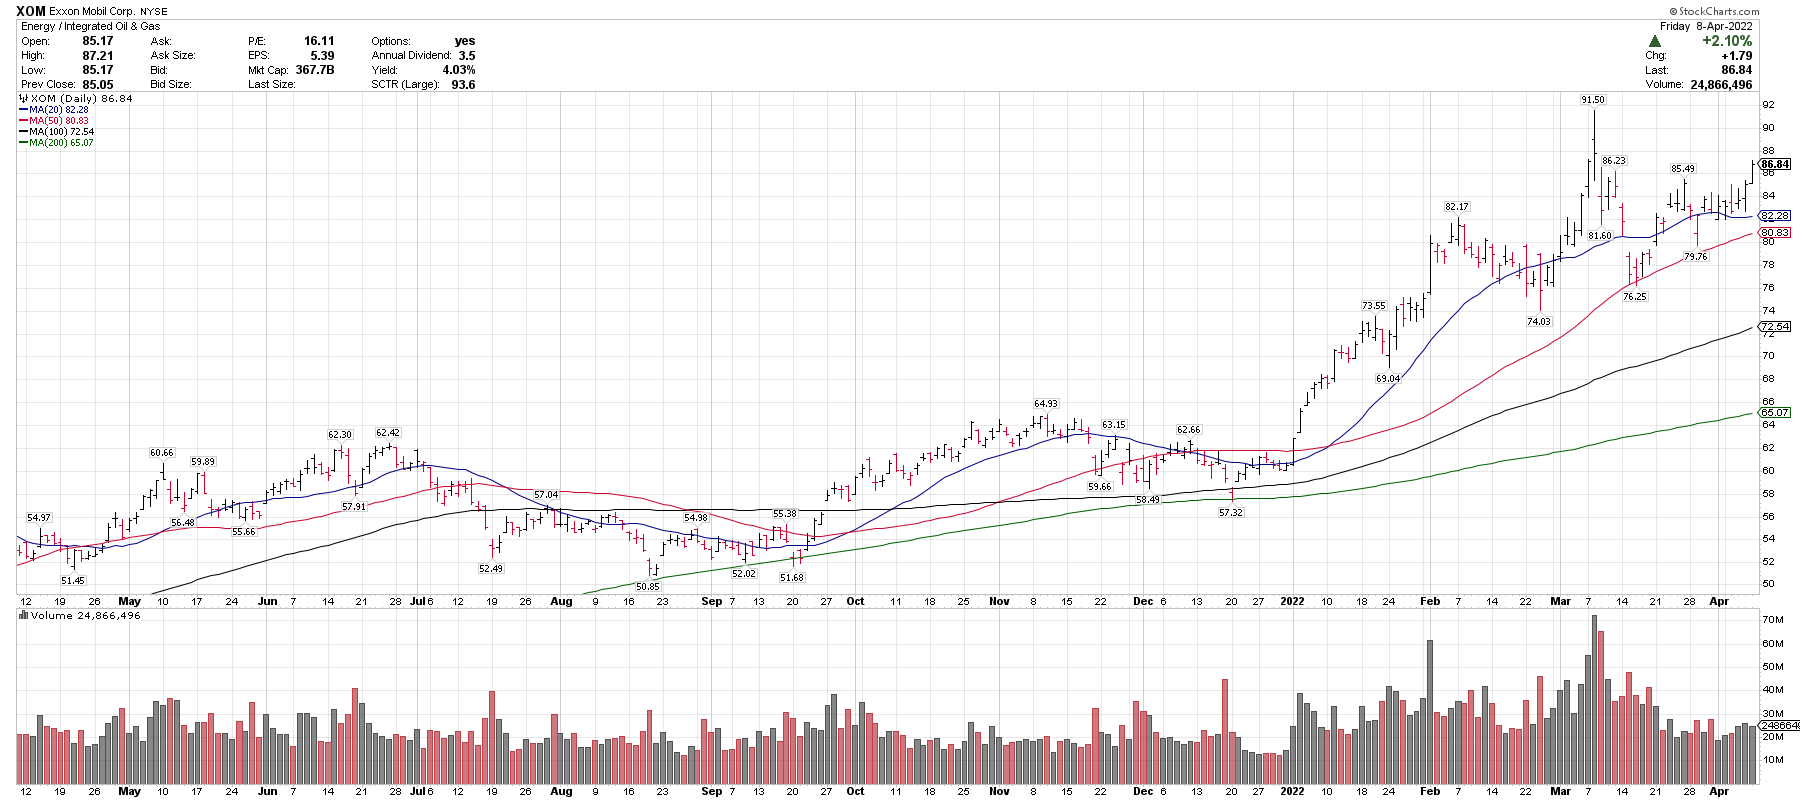
- Exxon Mobil (XOM) is one of our top technical ideas going into the new week and has been on our last 3 Weekly Top 25 Lists for Members, including this week.
- XOM is trading in an uptrend above 4 rising moving averages and made a new weekly closing high on Friday, in a very strong energy sector.
- XOM recently corrected 16.6% off new highs into the rising 50-day sma.
- 76-82 is a wide support range on any pullbacks and over 90-92 could signal a breakout higher.
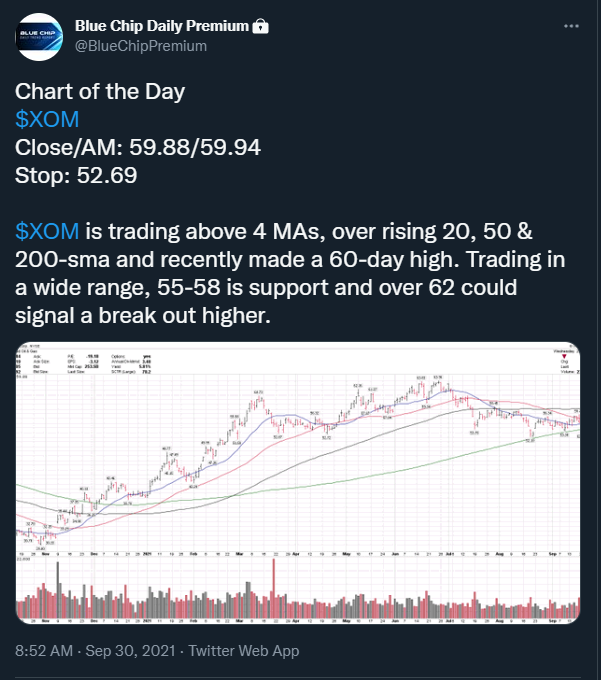
- XOM was also our Members Chart of the Day on 9/30/21, +45.02% since posted.
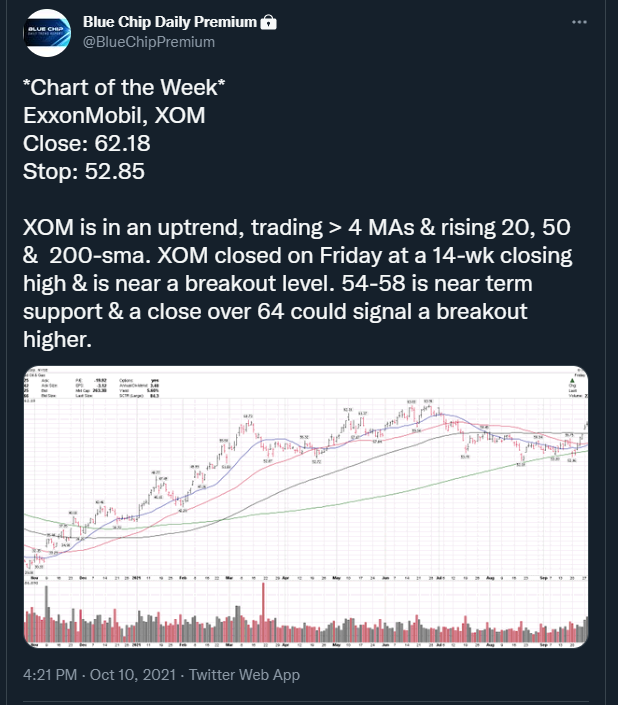
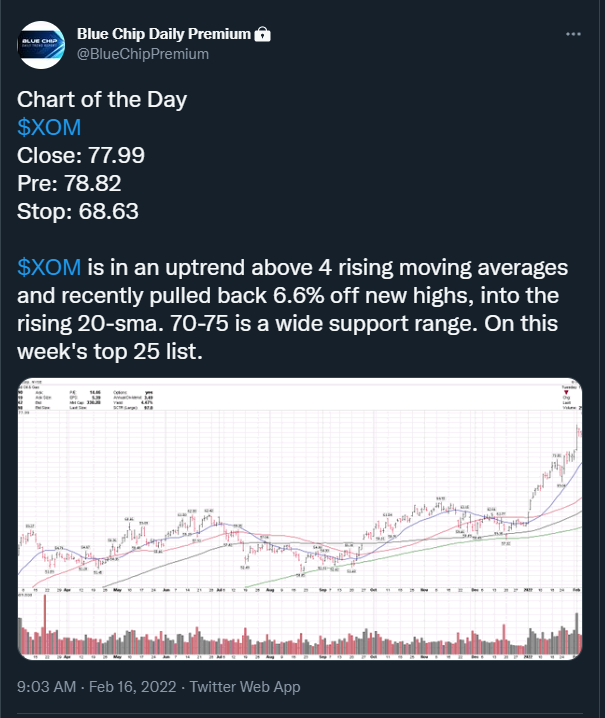
- 10/22/22 +39.66%, and 2/16/22 +11.35% since. (screenshots below)
- Join us here, to get our top technical ideas, like these, daily: Blue Chip Daily Trend Report
Have a great week,
Larry Tentarelli
Publisher
Disclaimer – Blue Chip Daily Trend Report