08/09/20
Blue Chip Daily Chart of the Week:
Industrial Select SPDR ETF, XLI
Close: $75.13
Stop level for position traders and investors: $66.82
please see chart analysis below
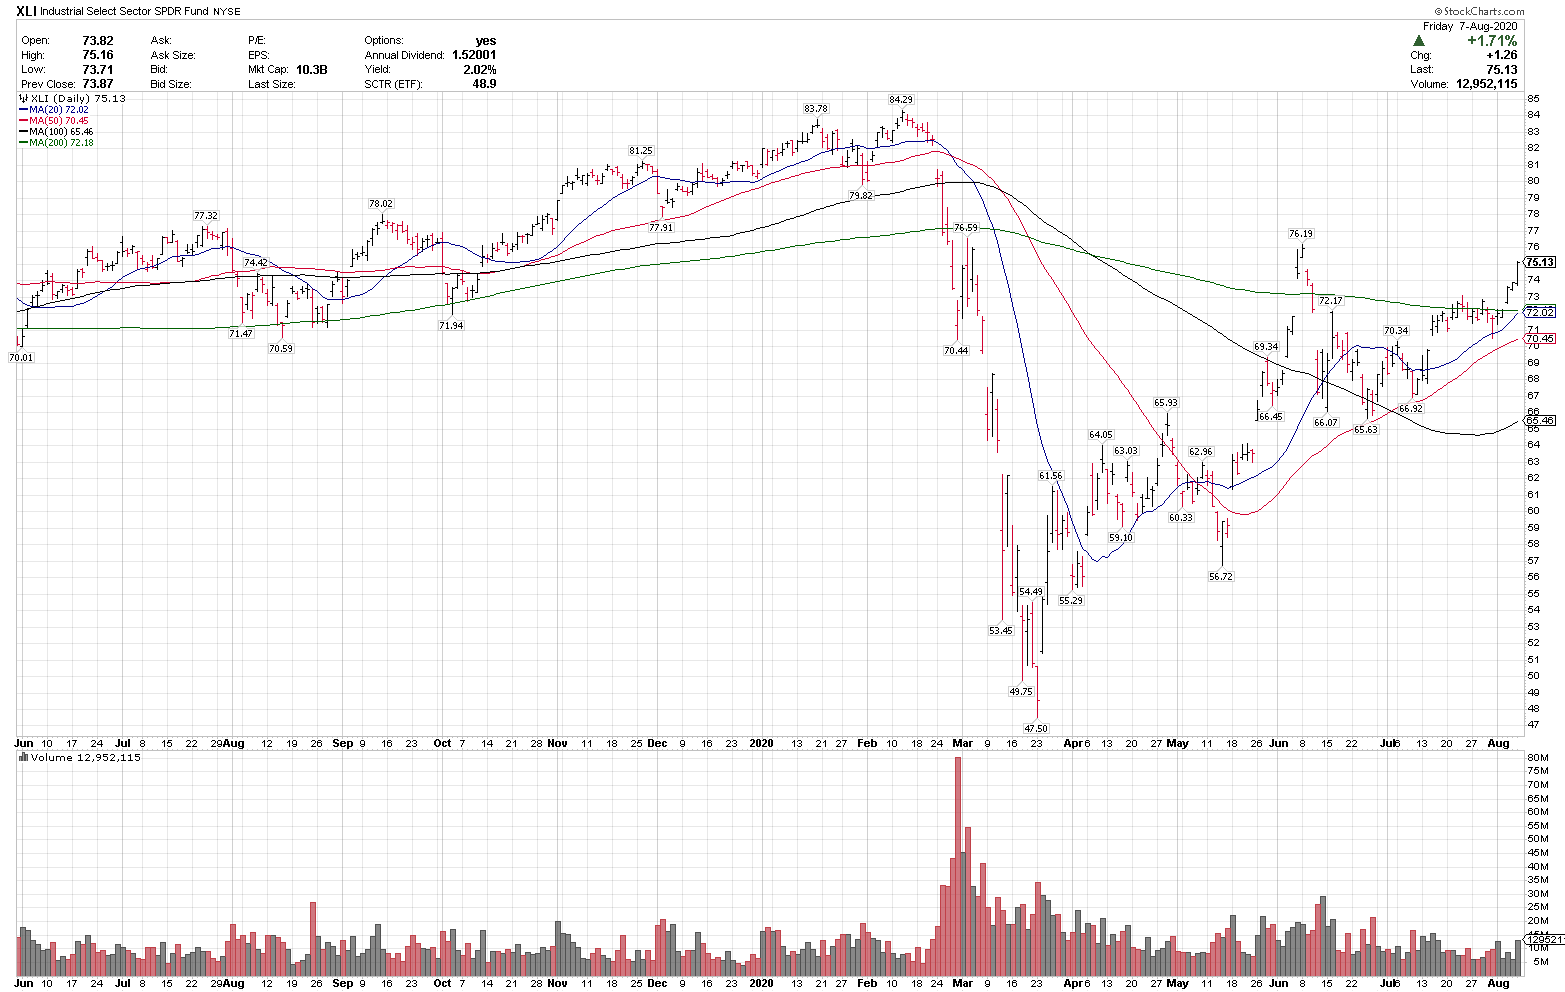
- XLI is in a technical uptrend above the rising 20, 50, 100 and 200-day moving averages, indicating a strong uptrend on multiple time frames.
- XLI reclaimed the 200-day moving average this week, a key longer-term trend signal.
- XLI had it’s highest weekly close on Friday since mid-February, indicating improving price momentum as well.
- XLI was on our member’s Best ETF ideas list last Sunday, and was +4.74% for the week, the top performing S&P sector on the week.
- We have been well ahead of this cyclical recovery for Subscribers starting in late April as cyclicals started to appear on our Weekly Best Ideas Buy lists in CARR, FCX, VIAC, XLE, XME and other cyclical stocks and ETFs.
- We believe this cyclical rotation could be just starting, and published a Members Only Top 10 Recovery Ideas Blog and Video today, with 10 of our best cyclical recovery ideas. https://bluechipdaily.com/august-2020-200-dma-recovery-ideas/
Have a great week,
Larry Tentarelli
Publisher