6/13/2021
Blue Chip Daily Chart of the Week:
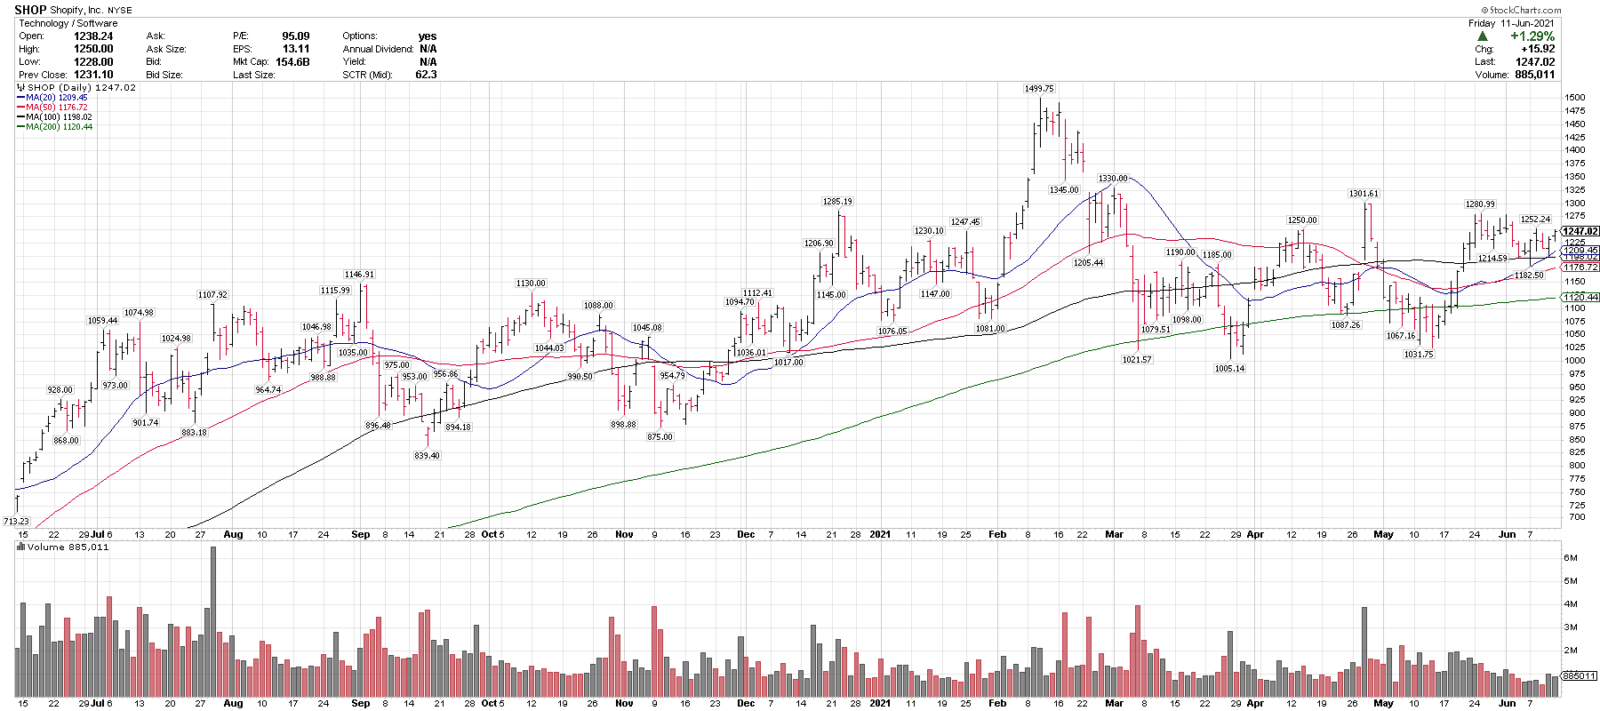
Shopify, SHOP
Close: 1247.02
Standard stop: 1059.67
Trend following stop: 994.61
please see chart analysis below
- Shopify (SHOP) is one of our top technical ideas coming into the week, and is on this week’s Members Top 25 Stocks List.
- SHOP is currently trading over rising 20, 50, & 200-day moving averages, indicating an uptrend on multiple time frames, and is also over the 100-sma.
- SHOP had a 20.7% pullback in April/May, and recovered to close on Friday at the highest weekly close since Feb. 2021.
- 1100-1200 is near-term support, 1000 is a major longer-term support level and over 1300 could signal a breakout higher.
- SHOP was our Chart of the Week on 4/12/20 and is +198.5% since then.
SHOP is on our Top 25 stocks list this week for Members.
This week’s list includes high growth stocks, as well as our top actionable technical ideas in 10 of 11 S&P sectors, including healthcare, energy, materials and others.
To see this week’s Top 25 list, join here: https://bluechipdaily.com/join-blue-chip-daily/
Have a great week,
Larry Tentarelli
Publisher
Disclaimer – Blue Chip Daily Trend Report