04/4/21
Blue Chip Daily Chart of the Week:
Pinterest, (PINS)
Close: 77.73
Stop level for position traders and investors: 64.41 (wider than average, due to recent volatility in this stock)
please see chart analysis below
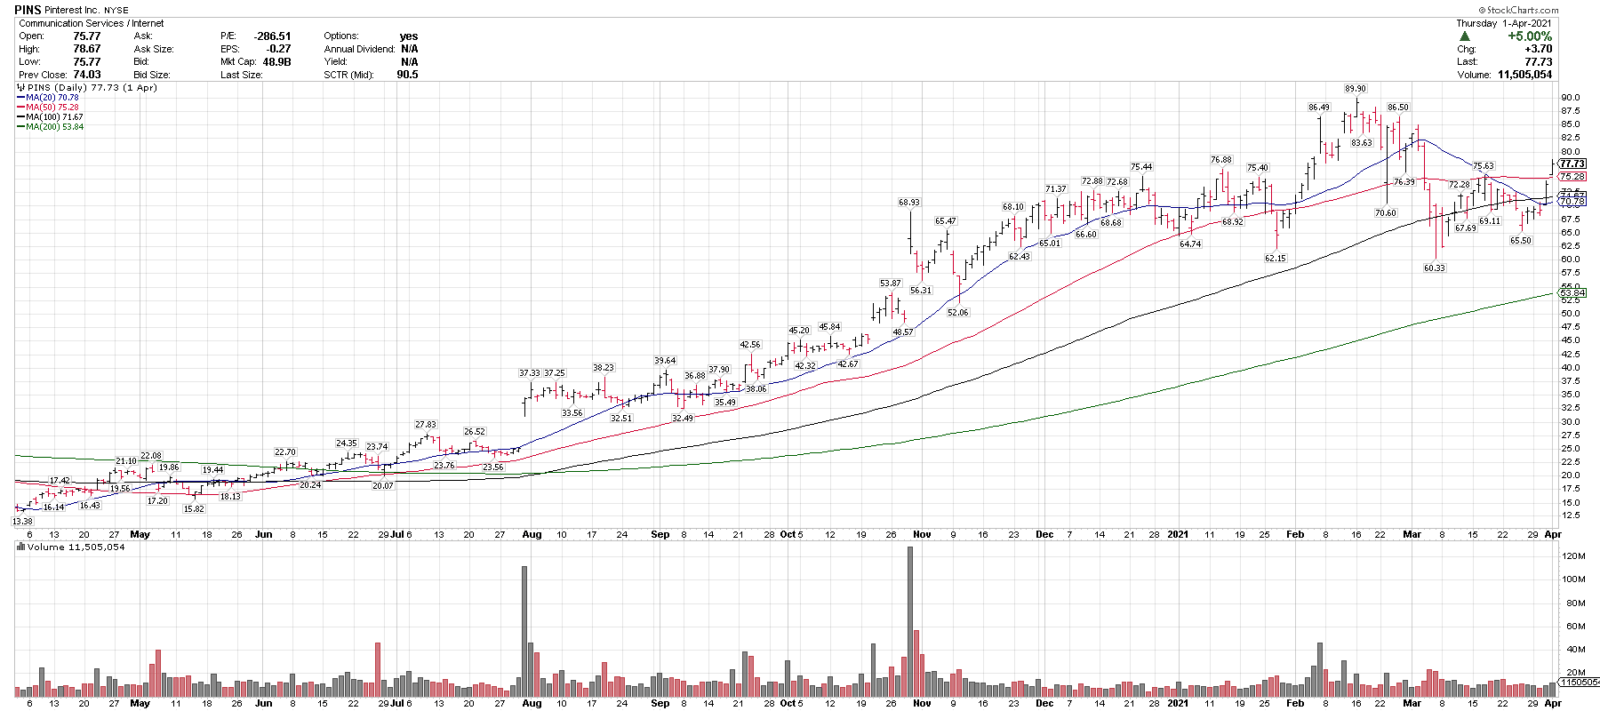
- Pinterest (PINS) is one of our top technical ideas coming into the week and is on this week’s Members Top 25 Stocks List.
- PINS is currently trading over the 20, 50, 100 & 200-day moving averages.
- PINS recently had a very sharp 32.8% correction over a three week period and is showing signs of trying to build a base and recover.
- PINS recently put in a higher low on 3/25 vs the 3/5 reaction low, has reclaimed the 20 & 50-day moving averages and the 20-SMA has also turned up. These are all constructive developments.
- PINS is also trading above a 4-month support base.
- Key Note: PINS is considered a high growth stock and can be very volatile. High growth stocks have been more volatile over the last few weeks as 10-year US Treasury yields (TNX) have risen. If TNX breaks out to the upside for some reason, it could put renewed pressure on higher growth stocks. This is not a prediction, just an observation and something to be aware of.
Have a great week,
Larry Tentarelli
Publisher
Disclaimer – Blue Chip Daily Trend Report