11/22/20
Blue Chip Daily Chart of the Week:
ServiceNow, NOW
Close: 518.06
Stop level for position traders and investors: 439.35
please see chart analysis below
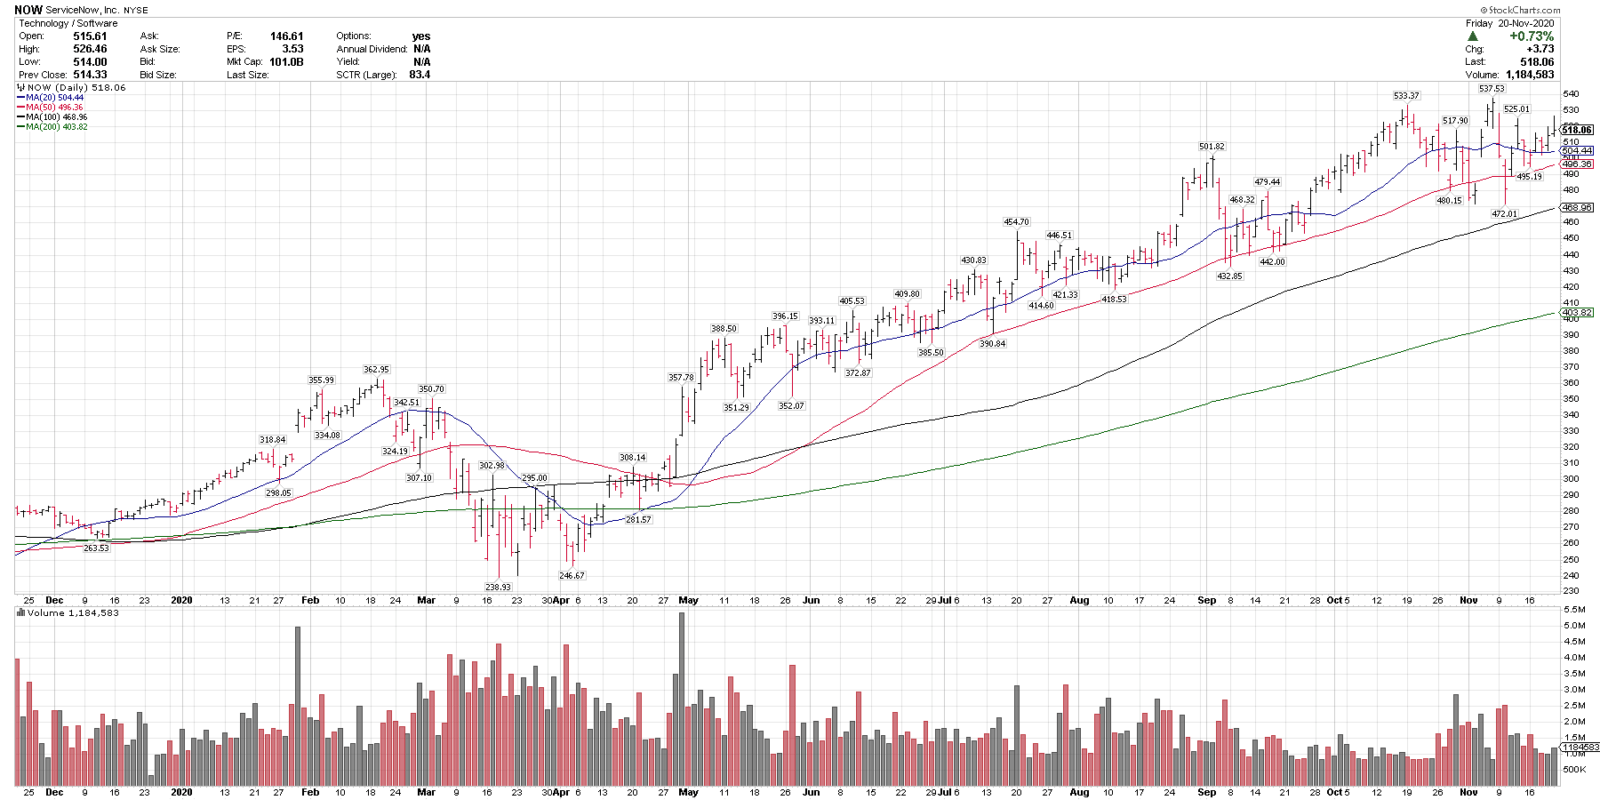
- ServiceNow (NOW) is in a technical uptrend above all key rising moving averages, indicating an uptrend on multiple time frames.
- NOW recently corrected 12.1% off of all-time highs and resumed it’s uptrends.
- NOW has been making a series of higher highs and is one of the top ranked tech charts on on longer-term screen.
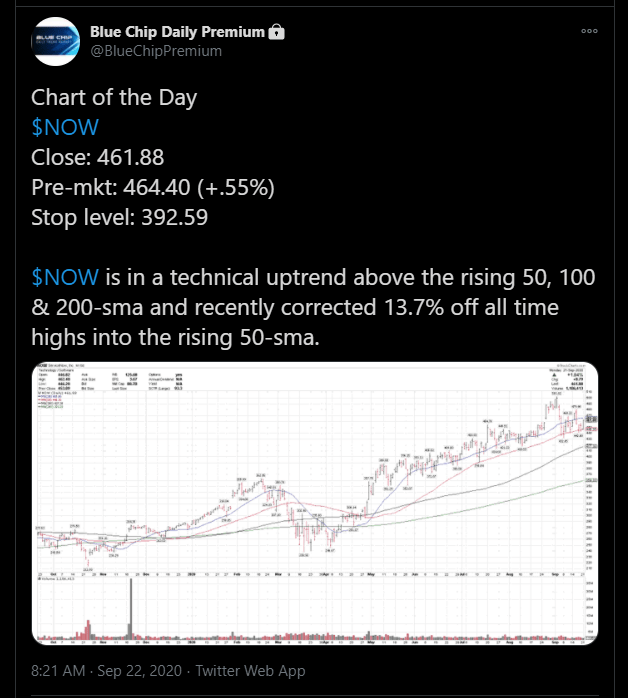
- NOW was our Members Chart of the Day on 9/22/20 and on our Weekly Top 25 Buy list recently on 9/13, 9/27, 10/04, 11/01, 11/15 and today.
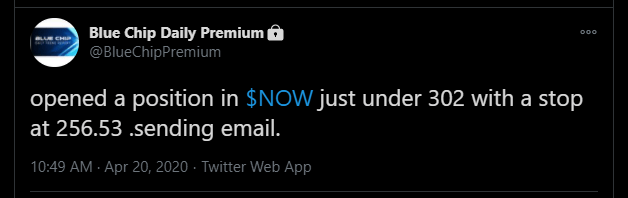
- Disclosure: I am currently long NOW from just under $302.
Join us now to get trade signals like this daily, before they break out, and to get immediate access to my Weekly Top 25 Stocks Buy List, published today. https://bluechipdaily.com/join-blue-chip-daily/
See my our best performing recent trade alerts for Members:
https://bluechipdaily.com/nov-top-performers/
Have a great week,
Larry Tentarelli
Publisher