8/15/21
Blue Chip Daily Chart of the Week:
Nokia, NOK
Close: 6.12
Stop level: 5.18
please see chart analysis below
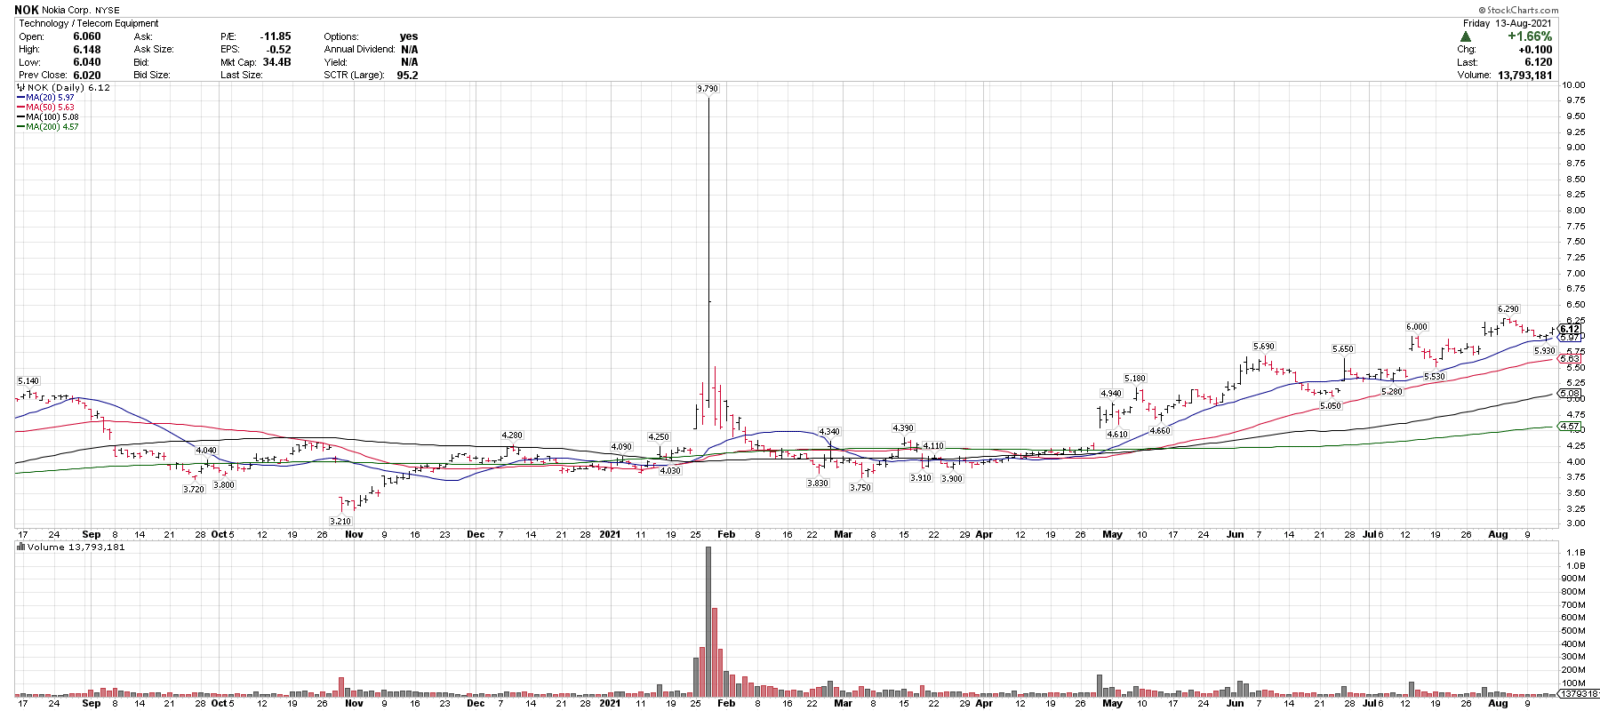
- Nokia, NOK, is one of our top technical ideas going into the week and is on this week’s Members Top 25 list.
- NOK has made a consistent series of higher highs and higher lows since it’s late April breakout.
- NOK is trading over 4 rising moving averages, indicating an uptrend on multiple time frames.
- NOK recently pulled back 5.7% off of 7-month highs and held at the rising 20-sma, a bullish signal.
- On a weekly basis, NOK had the highest weekly close on Friday since March 2019
- NOK was our members Chart of the Day on 6/2/21 and is +17.92% since then.
- NOK has been on our weekly top 25 list recently on 5/30, 6/27, 7/4, 7/18, 7/25 and 8/1.
- To see this week’s Top 25 stocks list, with our best ideas across all S&P 500 sectors, please join here: https://bluechipdaily.com/join-blue-chip-daily/
Have a great week,
Larry Tentarelli
Publisher
Disclaimer – Blue Chip Daily Trend Report
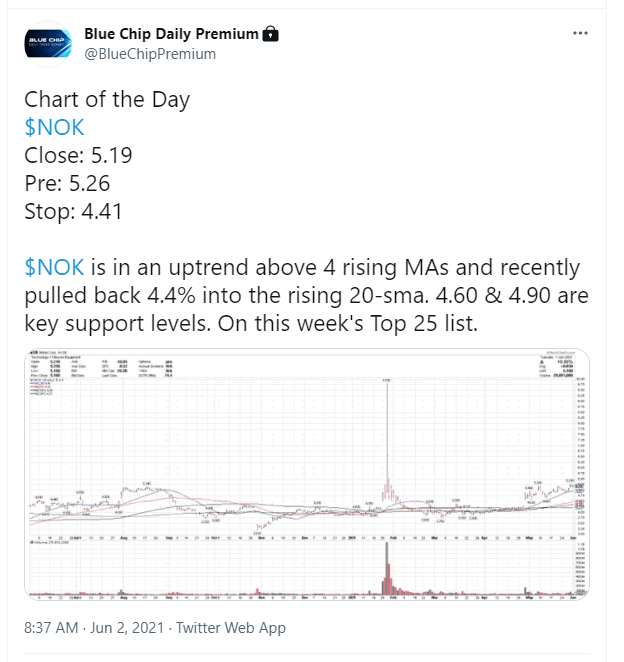
NOK MEMBERS CHART OF THE DAY ON 6/2/21
+17.92% since posted