7/18/21
Blue Chip Daily Chart of the Week:
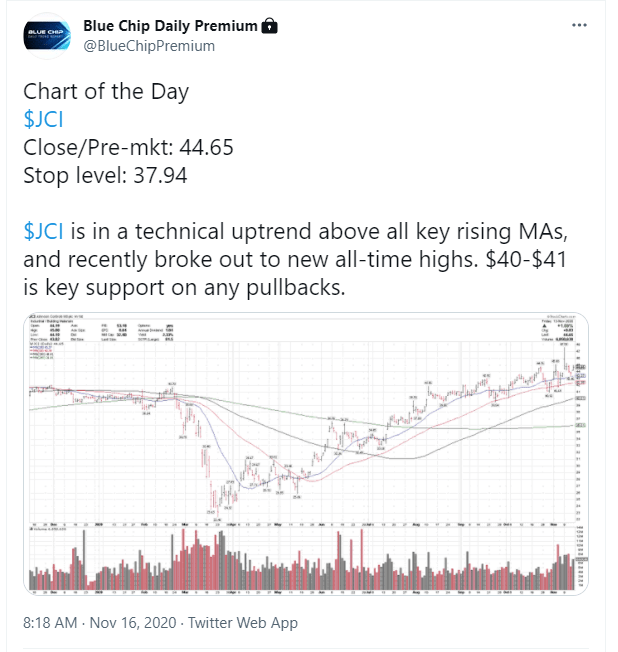
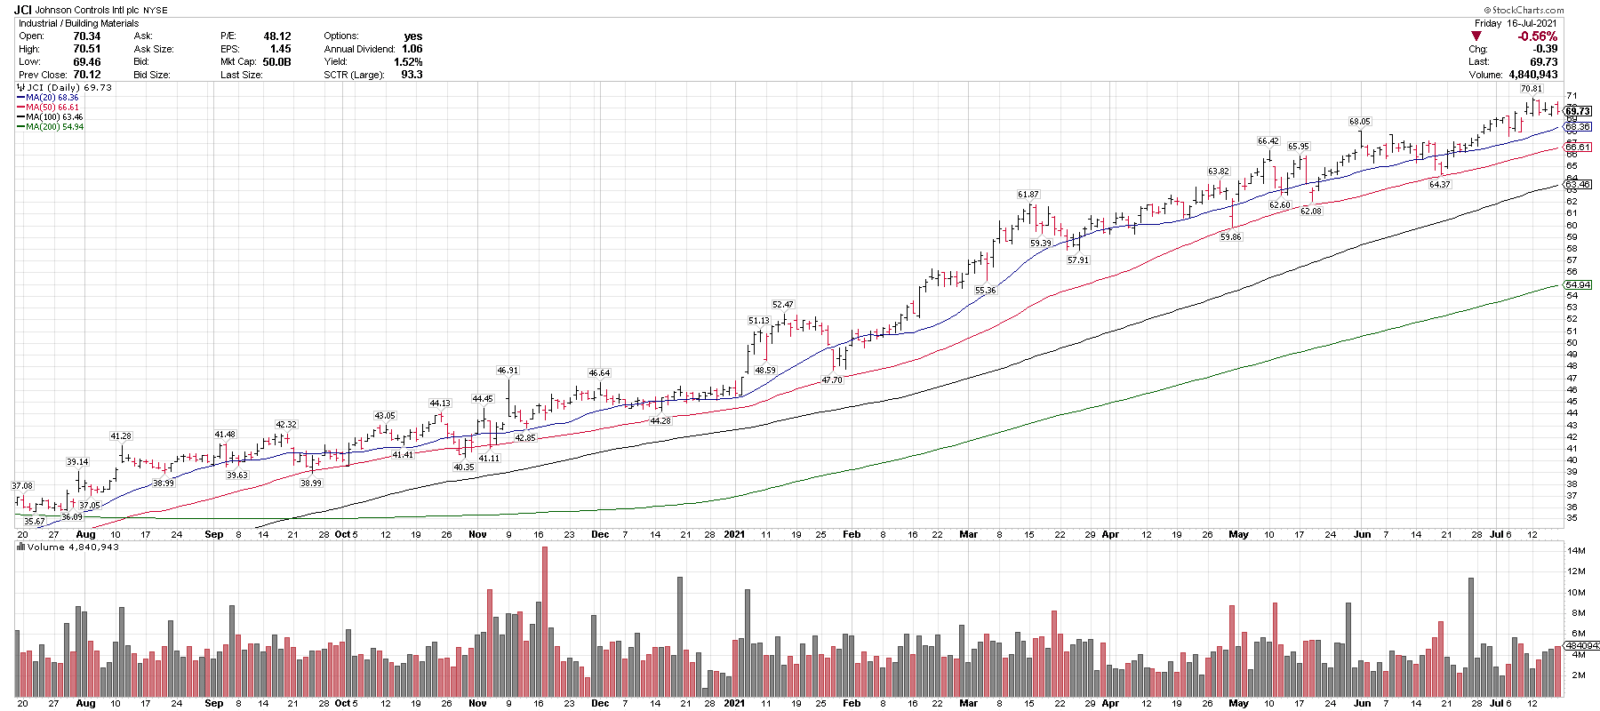
Johnson Controls, JCI
Close: 69.73
Stop level: 59.27
please see chart analysis below
- Johnson Controls, (JCI), is one of our top technical ideas going into the week and is on this week’s Members Top 25 list.
- JCI is trading over 4 rising moving averages, indicating an uptrend on multiple time frames and recently made a new all-time high.
- JCI has put in a series of higher highs and higher lows, in a lower volatility uptrend.
- JCI has been a performance leader in the Industrial sector year-to-date.
- There is key support in the 62-66 range and a close over 71 could signal a breakout higher.
- Our Chart of the Week ideas are based on the stand alone chart, and are not a directional market call. Overall market direction can play a factor as well.
- JCI was our Member’s Chart of the Day on 11/16/20 and is +56.1% since then, (screenshot below).
- JCI has also been on our Weekly Top 25 List 8 times so far in 2021.
To see this week’s Top 25 stocks list, with our best ideas across all S&P 500 sectors, please join here: https://bluechipdaily.com/join-blue-chip-daily/
Have a great week,
Larry Tentarelli
Publisher
Disclaimer – Blue Chip Daily Trend Report