07/26/20
Blue Chip Daily Chart of the Week:
Freeport-McMoRan, FCX
Close: $13.12
Stop level for position traders and investors: Below the rising 50-day moving average.
please see chart analysis below
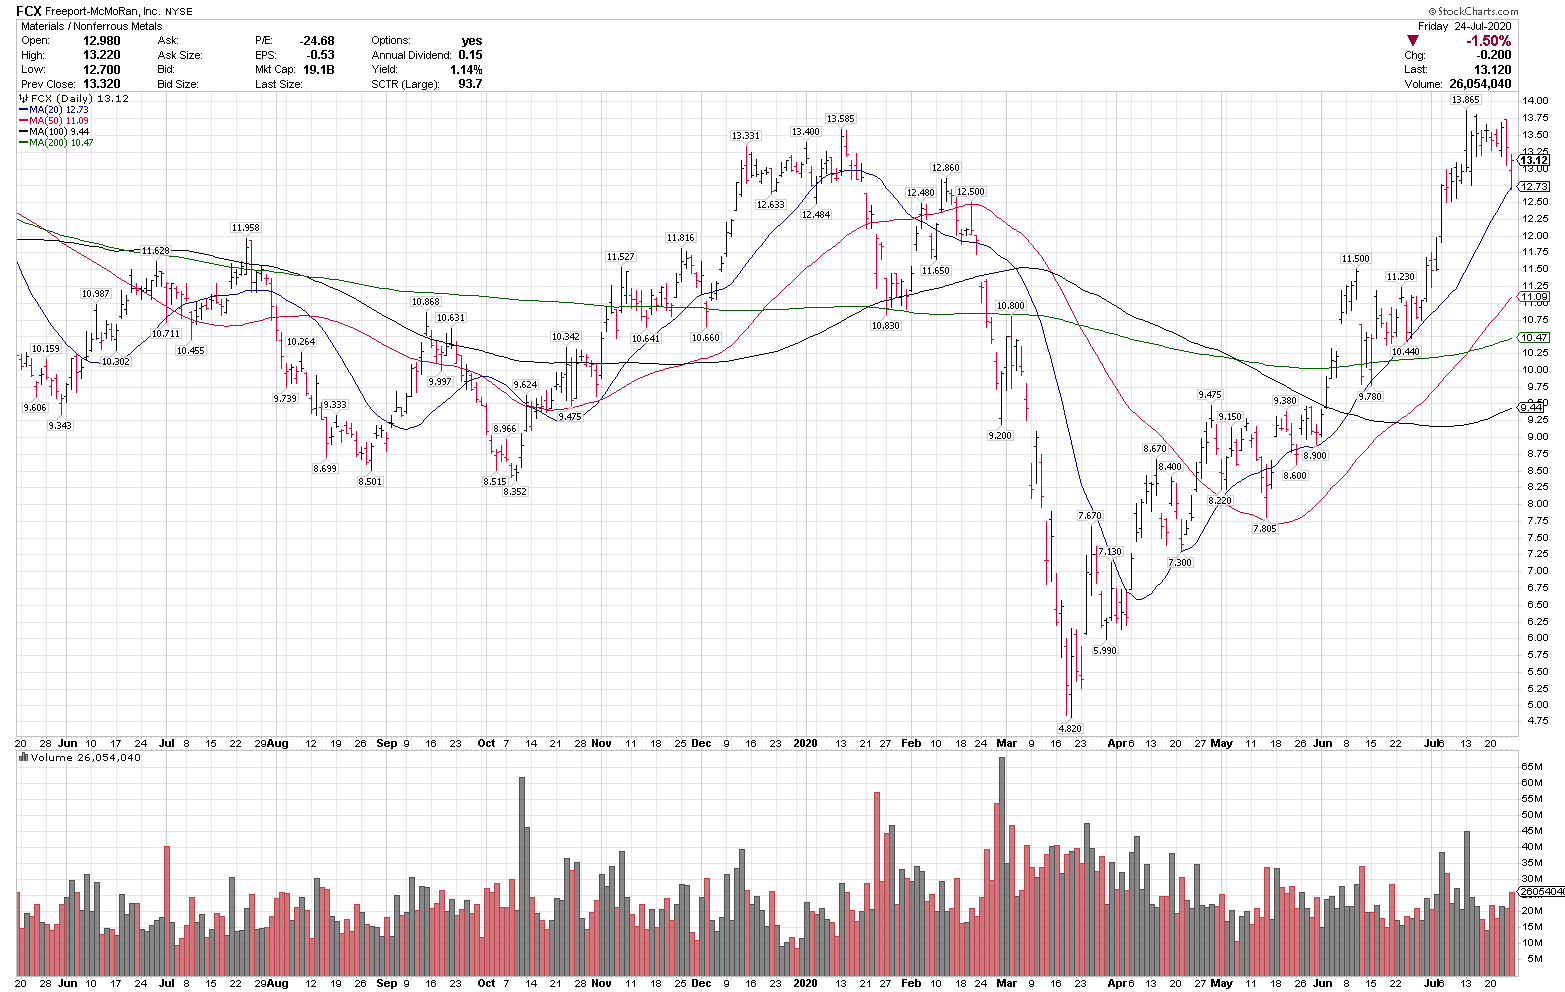
– FCX is in a technical uptrend above the rising 20, 50, 100 and 200-day moving averages, indicating a strong uptrend on multiple time frames.
– FCX is in an 8.3% pullback from the 52-week high.
– Breakout traders/investors might wait for a move over $14 before taking a position.
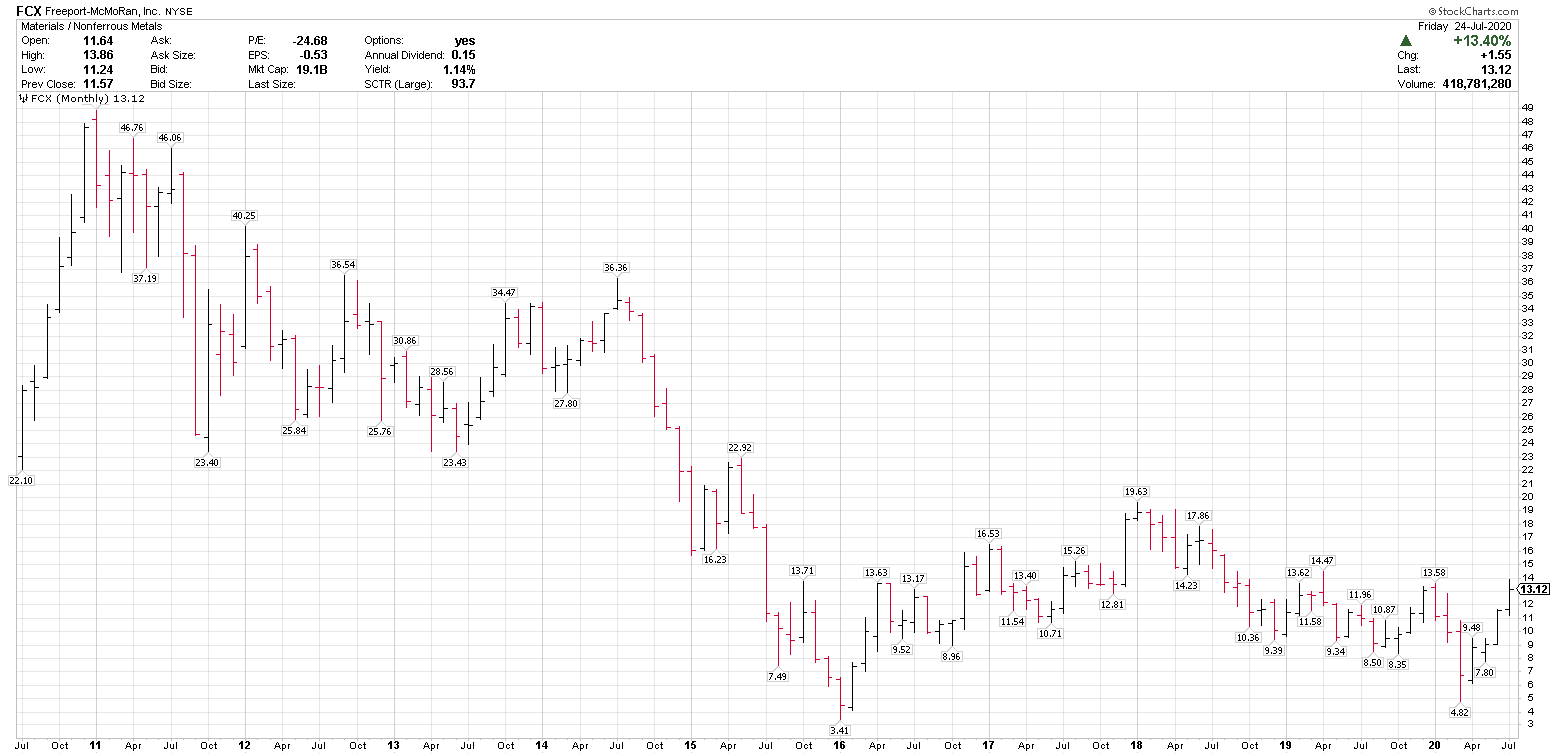
– Below is a monthly FCX chart that shows that a strong move over $14 could signal a new leg higher.
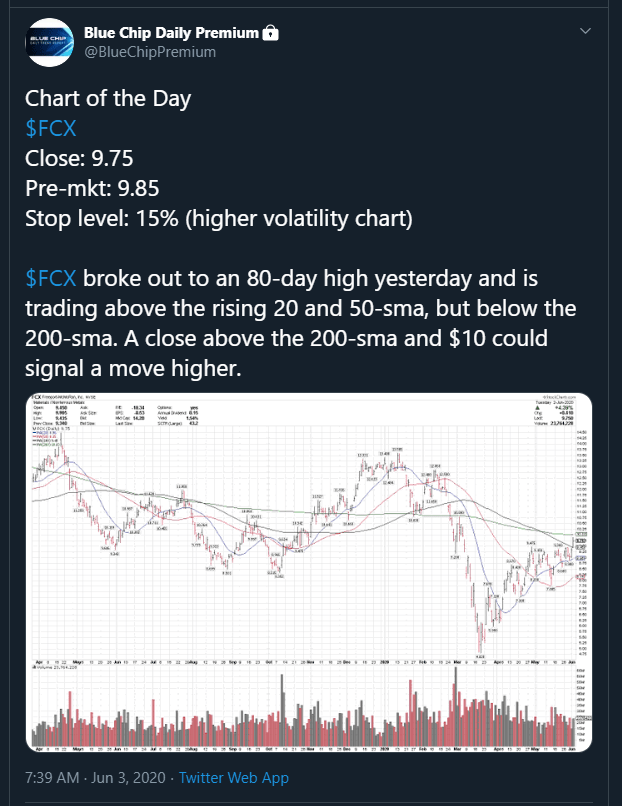
– FCX was our Chart of the Day Best Idea for subscribers on June 3, 2020 at $9.85 and is currently +32% since we posted it.
– FCX is on this week’s Top 20 best ideas list for subscribers, and was on the weekly Top 20 list as well on 6/7/20, 6/14, 6/28, and 7/05 as well.
To receive our best technical ideas daily, please join us at the link below.
https://bluechipdaily.com/join-blue-chip-daily/
Have a great week,
Larry Tentarelli
Publisher