01/03/2021
Blue Chip Daily Chart of the Week:
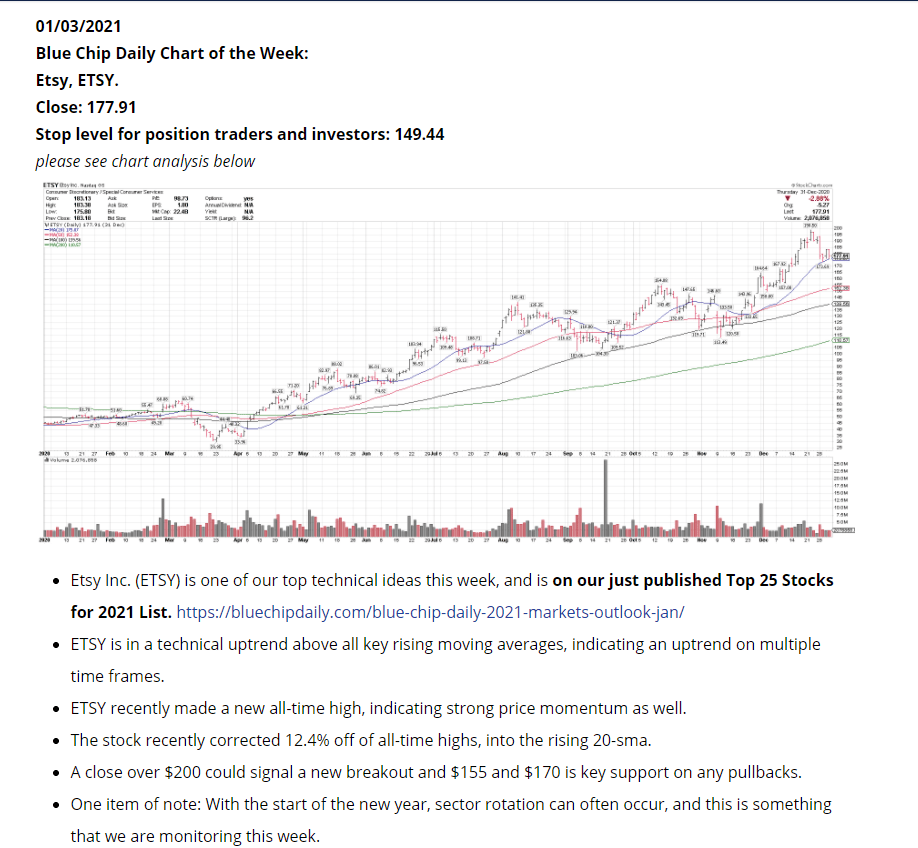
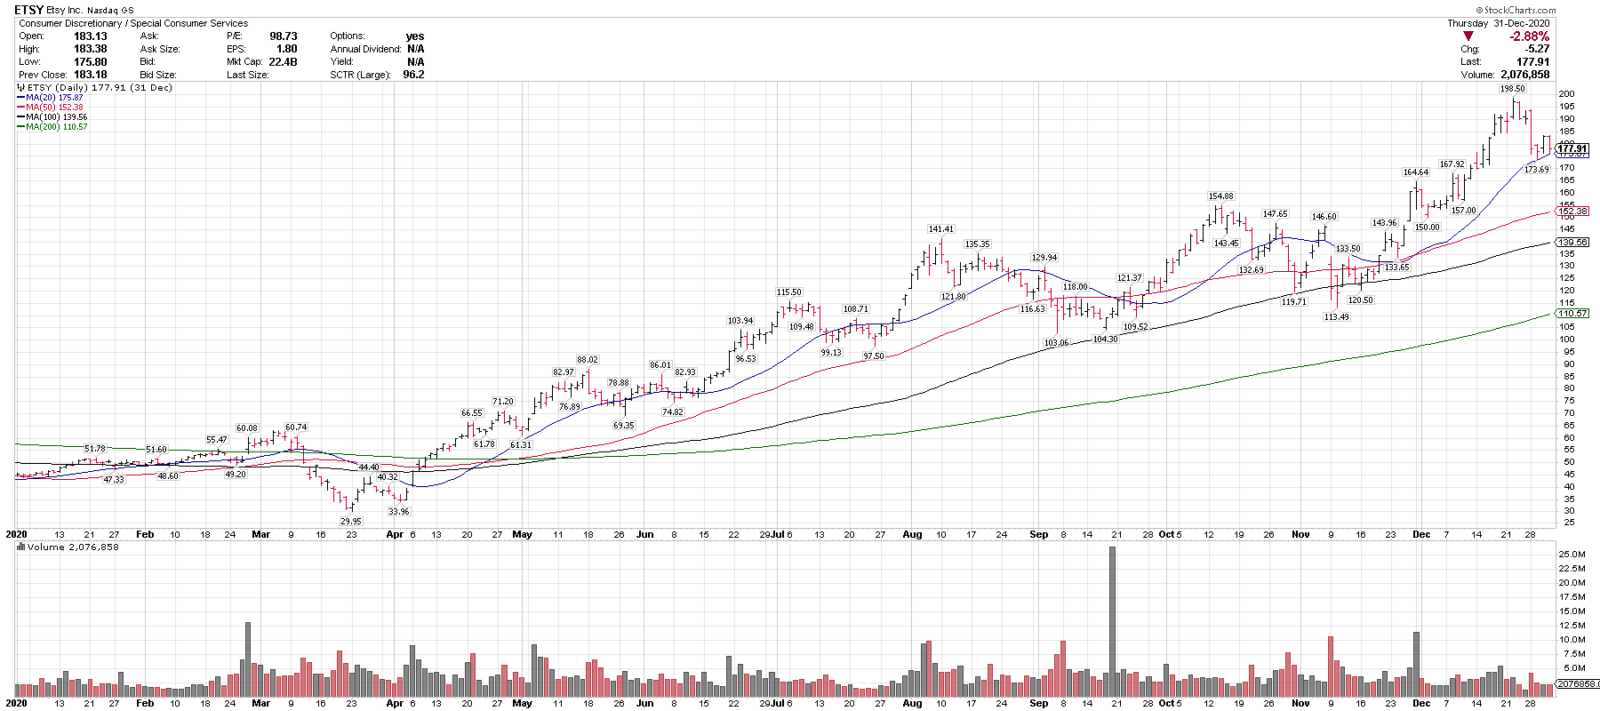
Etsy, ETSY.
Close: 177.91
Stop level for position traders and investors: 149.44
please see chart analysis below
- Etsy Inc. (ETSY) is one of our top technical ideas this week, and is on our just published Top 25 Stocks for 2021 List. https://bluechipdaily.com/blue-chip-daily-2021-markets-outlook-jan/
- ETSY is in a technical uptrend above all key rising moving averages, indicating an uptrend on multiple time frames.
- ETSY recently made a new all-time high, indicating strong price momentum as well.
- The stock recently corrected 12.4% off of all-time highs, into the rising 20-sma.
- A close over $200 could signal a new breakout and $155 and $170 is key support on any pullbacks.
- One item of note: With the start of the new year, sector rotation can often occur, and this is something that we are monitoring this week.
Disclosures:
- I am currently long ETSY since 12/07/20 at $154.88.
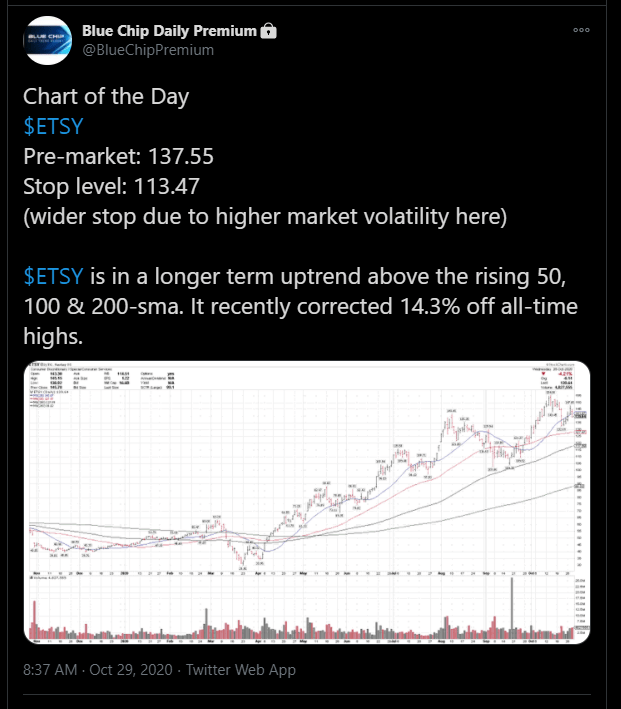
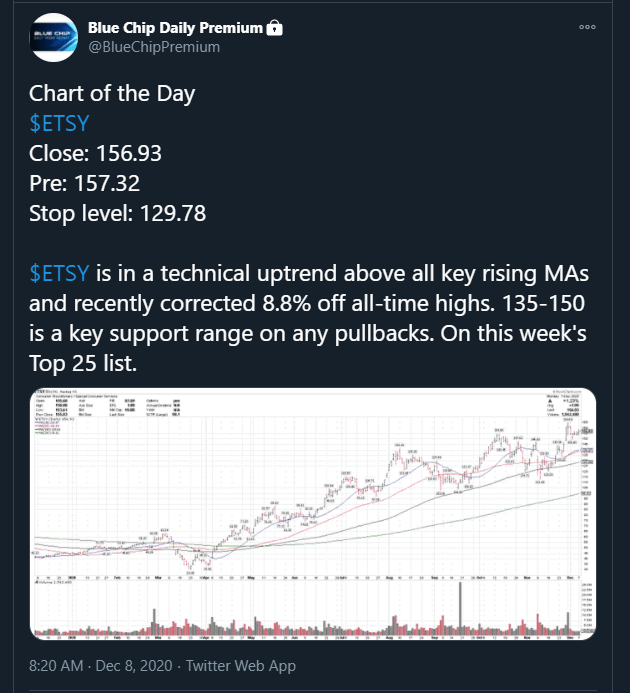
- ETSY went onto our Chart of the Day Buy List on 10/29/20 at $137.55 and again on 12/08/20 at $156.93.
- ETSY has been on our weekly Top 25 Stock Buy list on 11/08, 11/22, 11,29, 12/06 and 12/13.
See our best 2020 performing open positions and trade alerts for Members:
2020 Blue Chip Daily Buy List Top Performers – Blue Chip Daily Trend Report
Updated performance tab:
2020 Top Performers – Blue Chip Daily Trend Report
Have a great week,
Larry Tentarelli
Publisher